All posts by Tate Dwinnell

Upcoming IPO’s – RMG, HOO & IPCM

IPO’s are returning in 08 this week, but just trickling in and there don’t appear to be any "must haves" but there are 3 what appear to be solid IPO’s that begin trading tomorrow – RiskMetrics Group (RMG), Cascal (HOO) & IPC Hospitalist (IPCM).

RiskMetrics (RMG): provides risk management services to banks, corporations, asset managers, and other institutional investors to help them understand and manage their holdings and make better investment decisions. The company operates through two subsidiaries: Riskmetrics Solutions supplies data, analytics, software, and other information services. Institutional Shareholder Services (ISS) provides financial research and analysis to investors and corporations, allowing them to make informed decisions when voting their proxies or making other corporate governance determinations. RiskMetrics Group has some 3,300 clients worldwide.

RiskMetrics IPO Could Be a Bellwether
Wall Street Journal – Jan 21, 2008

How Does RiskMetrics Measure Up?
New York Times Blogs, NY – 11 hours ago

Cascal BV (HOO): provides water and waste water collection and treatment services around the world for populations ranging from 100,000 to 1 million. Cascal offers privatization, concession, build-own-operate-transfer, and maintenance services; most of its business comes through long term contracts. The company has water works in South America, Africa, and Asia as well as the UK. It also owns Pre-Heat, a gas installation and maintenance company in southern England. More than half of Cascal’s revenue comes from its UK operations.

 Utililty IPO: Cascal
Seeking Alpha, NY – Jan 22, 2008

IPC Hospitality (IPCM): provides some 470 hospitalists (physicians, nurses, and physician assistants, who focus on a patients’ care from the beginning to the end of their stay) to more than 300 hospitals and other inpatient facilities. Having a health care provider on-site to answer questions and oversee all of a patient’s treatment programs helps improve the quality of care and reduces the length of a patient’s hospital stay. The company’s hospitalists work in partnership with more than 21,000 physicians and 1,000 health plans in 16 states.

Healthcare IPO: IPCM The Hospitalist Company

20 Jan 2008 by SA Editor Abbi Adest

Fed to the Rescue, Capitulation Day But BE PATIENT

Whenever you have extreme moves in the markets, emotions run high.  You can see that clearly in a quick run through the blogosphere.  When the overseas markets began selling off and our own US futures sold off in tandem, the web was a buzzin.  Trash talking ensued from those who have been short, calls for a crash were common.  Would the Dow hit 10,000 before it’s all said and done?  The emails came in wondering what the heck to do.

It’s the kind of thing you see at bottoms.  Throw in the fact that the major indices were flashing oversold signals and the VIX was sure to spike at the open and you had a perfect recipe for a big flush out of sellers and resulting capitulation.  However, I have to admit I was concerned this morning about a potential crash.  Hank Paulson was was reiterating that the economy was strong blah blah blah.  Was this it?  Where was the Fed.  With the Dow taking out 12,000, the Nasdaq taking out 2300 and S&P 1300 the only way to avoid a meltdown today was massive Fed action.  .. and there it came.  Why the Fed has been hinting at a big cut and waited so long is the billion dollar question but 75 bp cut and the Fed saves the day.  A reactionary rather than a proactive cut, but futures took off ..
but only briefly.  We were right back to where we started.  Dow down over 400, Nasdaq 70, S&P 65. 

Uh oh, didn’t work this time.  The biggest cut in decades ahead of next week’s meeting and the market isn’t impressed.  The crash scenario is still alive and well but it’s no time to panic.  I emailed members last night and ran through some scenarios and what I planned to do but most of all it served as a reminder to avoid panic and remain cool headed if you have long positions.  It is critical to give the market 30 minutes to one hour to sort itself out at the open.  If you did that you were in good shape and avoided selling positions at what might have been the lows.

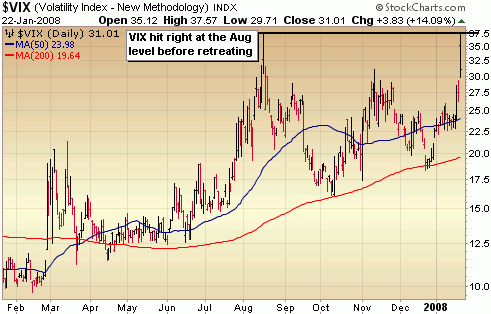
Just as the Volatility Index spiked to levels not seen since the low of last August (see below), buyers stepped in right from the open and pushed the indices well off their lows creating the potential for a capitulation day.  The gains of the day held up very well and we still closed near the highs of the day, but the lack of a stampede of buying into the close casts a shadow over today’s move.  We are not out of the woods yet and you should not be getting aggressive on the long side.  Institutions did not step up and buy into the close.

Today was a good start though.  I’d like to see a retrace of today’s move with light selling volume followed by some kind of confirmation day.  Then a big 2% move or more with volume higher than the day before.  Until that happens, cash remains the best place to be.   Remember that we’re just now getting into the bulk of earnings and as was seen with Apple (AAPL) after the bell today it’s going to be a mine field this quarter. 

There currently is no leadership in this market and good trade setups on the long side are few and far in between.  Wait for new quality bases to form and new leadership to emerge.  There will be plenty of time to profit.  Patience. 

::: Major Indices Performance – The Numbers :::

(Note: volume averages are based on the average over the past 50 days)
Data as of 4:00EST – End of Day January 22nd 2008

Nasdaq: DOWN 2.04 today with volume 37% ABOVE average
Nasdaq ETF (QQQQ) DOWN 2.58%, volume 81% ABOVE average
Dow: DOWN 1.06%, with volume 70% ABOVE the average
Dow ETF (DIA): DOWN 1.128%, with volume 62% ABOVE the average
S&P ETF (SPY): DOWN 1.01%,  with volume 95% ABOVE the average
Russell Small Cap ETF (IWM): DOWN .71%, with volume 57% ABOVE the average

::: SelflInvestors Leading Stocks :::

The Self Investors Leading Stocks Index is comprised of stocks in the Breakout Tracker, which is a database of the fastest growing companies near a breakout or having already broken out of a base.  Leading stocks didn’t do particularly well but outperformed the tech heavy Nasdaq.  Today’s rally was all about laggards recovering from extreme oversold conditions.

Summary:

* Decliners led Advancers 186 to 72
* Advancers were up an average of 2.4% today, with volume 62% ABOVE average
* Decliners were down an average of 3.25% with volume 58% above the average
* The total SI Leading Stocks Index was DOWN 1.67% today with volume 59% ABOVE average

::: Where’s the Money Flowing :::

Many investing websites provide leading industries based on price performance alone. However, without accompanying volume levels, this can sometimes be misleading.  The only way that I know of to gauge industry/sector strength WITH volume levels is through the analysis of ETF’s.  A couple years ago this was not possible, but as more traders/investors use ETF’s they become a much better tool for gauging the health of the market and seeing where the money is flowing (or not flowing).  Using the proprietary SelfInvestors Demand Indicator score which measures price and volume movements, I’m able to quickly see which sectors/industries are seeing the greatest inflows of cash.  For a detailed look at how I go about gauging sector/industry strength please see the following post: http://selfinvestors.com/si/industry_tracking/

* Current Leading Sectors/Industries (over last 30 trading days):  
Agriculture, Gold Miners, Bonds, Gold
                                          
* Current Lagging Sectors/Industries (over last 30 trading days): 
Broadband, Global Energy, Utilities, Aerospace/Defense

* Today’s Market Moving Industries/Sectors (UP):
Homebuilders, Retail, Real Estate

* Today’s Market Moving Industries/Sectors (DOWN):
Nuclear Energy, Software, Biotech, Broadband, Heath Care Providers, Health Care

::: Stocks :::

The stocks section will be an area where I highlight one stock selected from a group of stocks moving up with volume well above average and most likely breaking out of a base or consolidation.  I’m exhausted tonight so won’t highlight a stock of day today.. There were only two leading stocks above both moving averages and moving with volume today.  Check ’em out  —–

Meridian Bioscience (VIVO) and Yamana Gold (AUY).  I’ll be considering both personally for a purchase soon.

ETF Trends & Observations: Gold, Oil, Banks, India, China & More

About once a week I like to run through about 200 of the most liquid ETF’s to get a better sense of the market.  A good picture of the market can be painted by scanning through them so I thought I’d share my thoughts on what I’m seeing (in no particular order).   What are you seeing?

I post my thoughts on the general market in my weekly reports on Sunday, so won’t discuss it in detail again here but considering the futures are way off and tomorrow could get ugly I’ll just mention that just maybe tomorrow sets us up for that massive capitulation day that marks an intermediate bottom.  Pay attention to the VIX.  Remember: it’s not how we open but we we close.  If on Tuesday, we don’t at the very least close in the upper half of the trading range it could get real ugly.  There is quite a bit of room to run to the downside before any support comes into play.

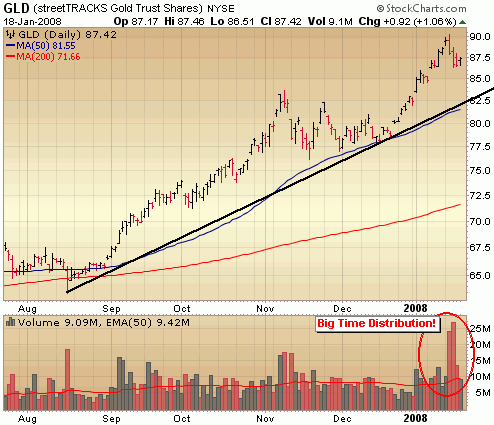
Gold is up 35% in 5 months and big distribution has come into the Streettracks Gold Trust (GLD) in the last few trading sessions.  Take some profits already! 

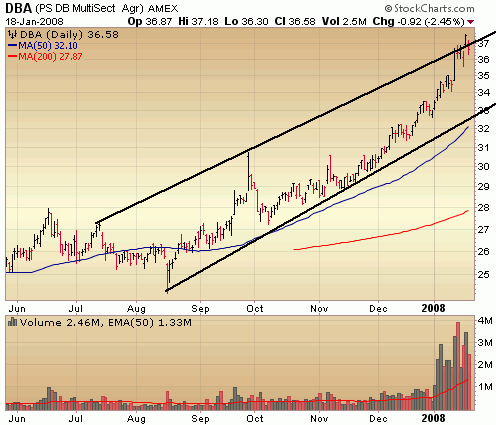
The agriculture stocks are not immune to the heavy selling and many of the top performers such as MOS, TNH, MON, CF, TRA and DE have been hit with big time institutional selling in recent days.  Is the Powershares Agriculture Fund (DBA) next to go?  It isn’t showing any signs of deterioration yet, but keep an eye on it for a short.  It’s extremely overbought and hitting the top of an upward channel.

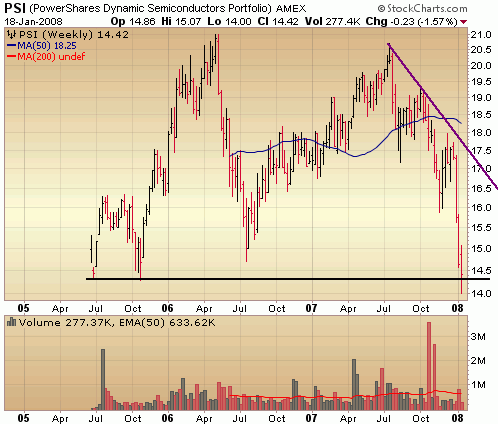
Semis are severely oversold.  I’m not saying that can’t stay oversold and dip further.  I’m just sayin.  It will take Intel several months to recover from that slaughtering.  Maybe semis become interesting later this year.  The Powershares Dynamic Semis (PSI) ETF is hitting some key resistance it might be ready for a snap back rally.  But that’s about it. 


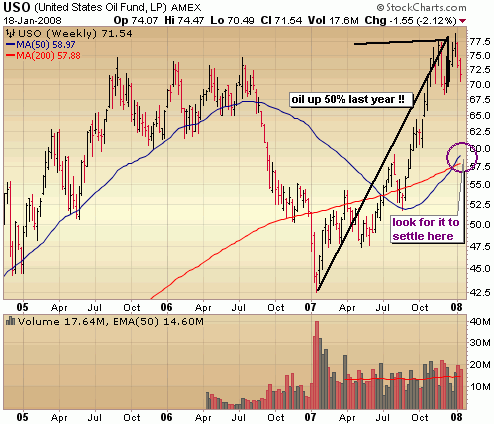
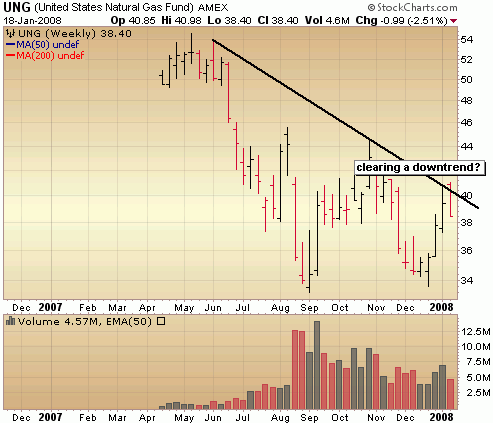
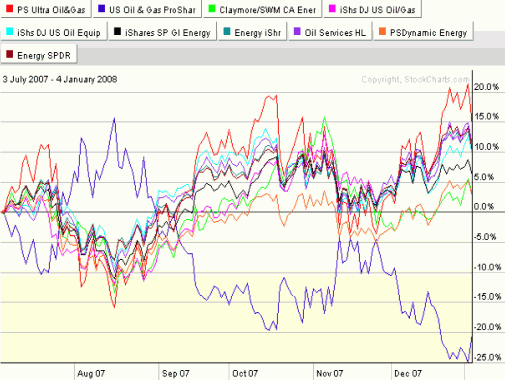
Divergence between oil and natural gas.  As oil breaks down and retreats from $100/barrel, natural gas appears headed the other way and on the verge of breaking out.  It’s hard to believe oil was up 50% this year.  I hadn’t realized that.  I see retrace of that run for the US Oil Fund to the $60 range.

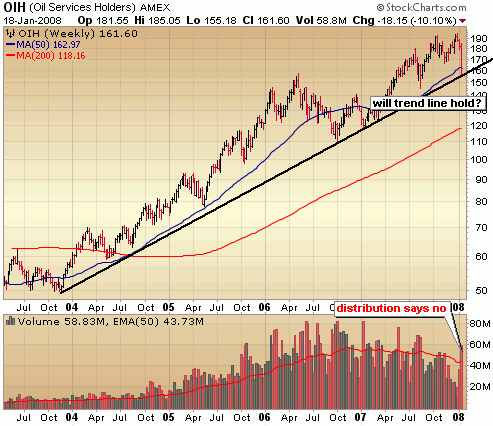
.. and that brings me to Oil Service stocks which are approaching a long term trend line.  It’s holding there now but given the distribution going on these names it’s just a matter of time before before the Oil Services Holders (OIH) takes out that long term trend line.  Oil Service stocks look done to me over the next few months.

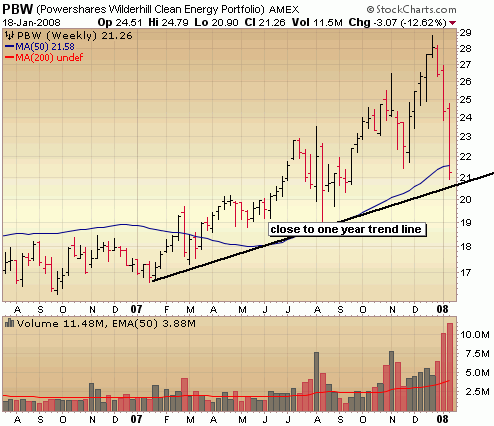
.. and that brings me to alternative energy which tends to trade in line with oil.  The great diversified way to play alternative way is the Powershares Clean Energy (PBW) ETF.  Solar stocks have been killed in the past few weeks and I have to admit some of them are beginning to flash interesting long term entry points.  It’s too soon just yet to get in, but they are worth paying attention to as is PBW.  Below is a weekly chart and you see it’s closing in on a trend line.  However, that is huge distribution going on.  Avoid at least until it begins to stabilize.

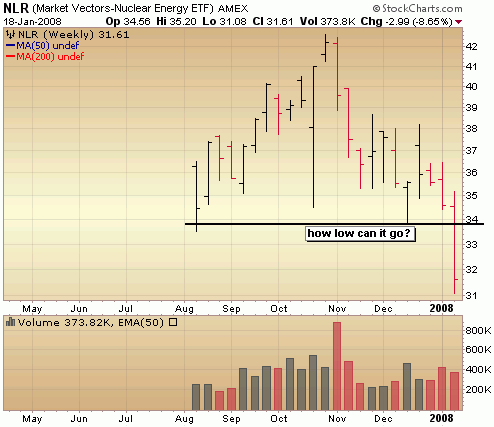
..and on the non renewable side of alternative energy we have nuclear, a source of much debate.  France is doing the right thing with nuclear and largely energy independent.  Nuclear energy traders are probably realizing it will be a long time before nuclear becomes a larger part of our energy source.

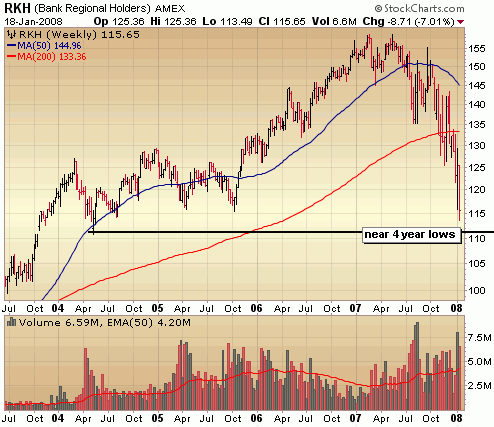
Everyone wants to know when homebuilders and banks will bottom.  I’ve touched on the homebuilders recently as they have begun to stabilize and it appears that the banks (at least the smaller regional ones) have begun to stabilize a bit.  Notice how I’m not calling a bottom.  Downward trendlines will need to be broken for that to happen and we’re quite a ways from that.  Note the capitulation 2 weeks ago on the weekly chart of the Regional Bank Holders (RKH) and a retracing of that move with lighter volume last week.  That is healthier action.  Look for support near the 4 year lows.

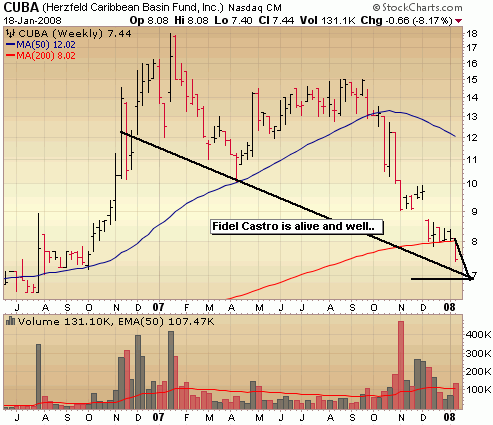
Fidel Castro is alive and well.  Ok maybe not well but he’s alive and that’s more than I can say for the Herzfeld Caribbean Basin Fund (CUBA).

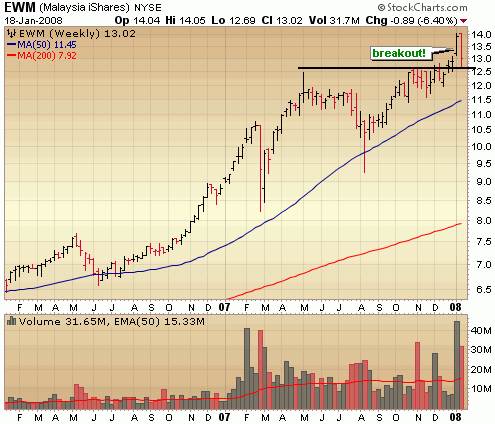
On the other side of the world Malaysia is flying high and defying gravity as the rest of the world crumbles.  Maybe it’s next in line.

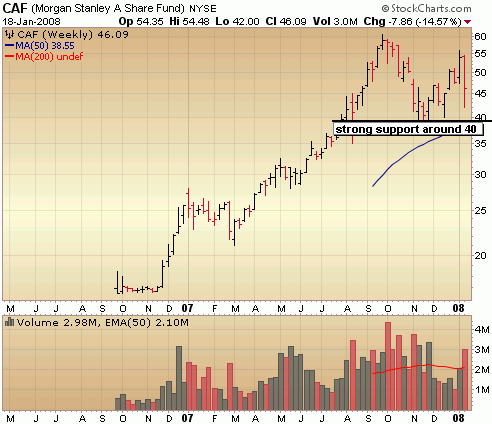
Emerging market high flyers China and India are another story and have the potential to be punished the most.  Looking at the big picture both have a long way to go before you could say serious damage has been inflicted.  In fact the Morgan Stanley A Shares Fund (CAF) could drop nearly another 15% and still be considered a bullish looking chart in terms of the long term picture. 

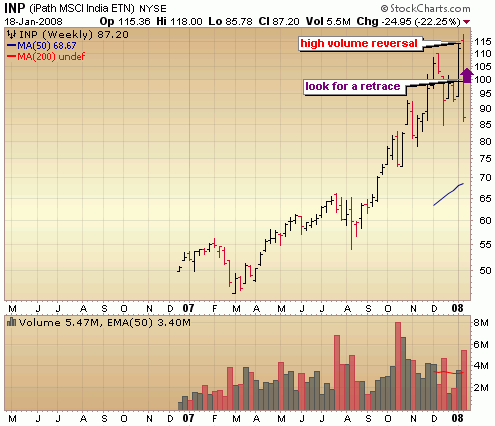
Looks to me like India has just begin its deterioration and may provide a great short entry soon.  INP will be down big on Tuesday so it may be some time before providing a good entry.  Note the potential top marking high volume reversal on the weekly chart in the iPath MSCI India ETF last week.  I’d be looking to get short on a retrace of this move somewhere in the 100 to 105 range.

Fear Here? Bottom Near? Look for Massive Capitulation

Nowhere to run to, nowhere to hide.  That was the mantra of last week as the bears ripped the market to shreds.  Just about every ounce of it.  Even Gold and Oil sold off.  Remember the good old days when every time Bernanke spoke, the market rallied.  My how times have changed. 

It is a bear market and has been for close to 2 weeks now as all major indices have now taken out support of more than 4 year trend lines.  In the past four years the strategy was to buy the breakouts and add to positions in strong companies on the dips.  Every market correction no matter how severe was met with ferocious buying, resulting in V like bases.  This time it’s different and bears are firmly in control.  The strategy changes to shorting and/or trimming positions into rallies (although oversold conditions within a bear market do present some short term long opportunities).

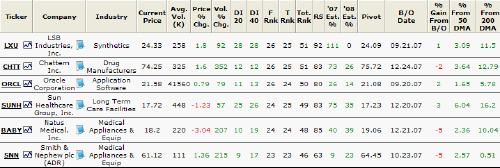
Dips aren’t finding buyers and the market leaders such as Research and Motion (RIMM), Garmin (GRMN), Google (GOOG) and Apple (AAPL) have all but disappeared.  There are no leaders in this market.  Take a look at the Self Investors "Hot Stocks" screen.  This filter spits out a list of companies that are above both the 50 and 200 day moving averages, showing great demand (a SelfInvestors Demand Indicator (DI) score of 20 or above), within a buyable breakout range (within 5% of the pivot point) AND/OR within 4% above the 50 day moving average.  In a nutshell, the best looking leading stocks.  In a typical market there are 20 – 40 candidates in this list.  Currently, there are just 6 – LXU Industries (LXU), Chattem (CHTT), Oracle (ORCL), Sun Healthcare (SUNH), Babus Medical (BABY) and Smith & Nephew (SNN).  Note that 4 of the 6 are medicals.  Keep an eye on medical industries for possible leadership once the market turns around.

Yeah it’s gloomy out there but I think we’re close to an intermediate bottom.  It seems like the market will never rise again, but bears do sleep and we are reaching levels that indicate an oversold rally is near.  Just remember that we really need that big capitulation day to mark a bottom.  Several days ago we got some minor capitulation which led to a short lived bounce and resulting failure.  We need panic selling followed by a stampede of buying, not just bargain hunting and short covering.  Only then can a bottom be in place.

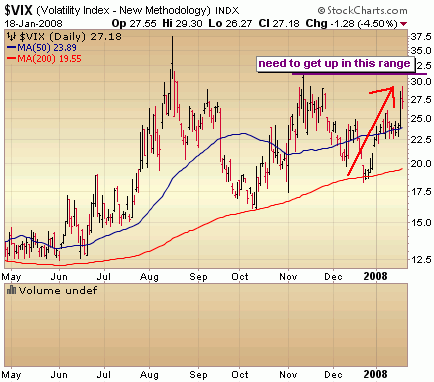
There has been much mention that the Volatility Index isn’t quite at panic levels but the fear is creeping into the market.  Perhaps once the VIX nears those November levels above 30 we can begin talking about a capitulation point. 

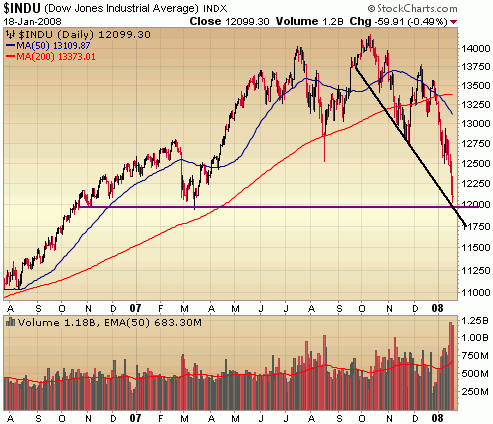
The VIX aside, the price and volume levels of the major indices aren’t indicating a bottom is in place yet, but we are sitting on some key support levels now and an area of a potential rally. 

As you’ll see in the charts of the major indices, we’re hitting support of a downward trend as well as areas of previous consolidation.  Nobody knows if we’ll capitulate, hold at these levels and rally into resistance but we certainly need to begin looking for it.  I’m looking for a test and possible breach of Dow 12,000 to induce some panic selling and induce a big reversal.  I think it happens sooner rather than later.  So look for another 100 – 200 point plunge in the Dow next week and keep an eye on the VIX if it does so.  If it gets above 30, perhaps the buying stampede begins.  To take advantage of any stampede consider trading a leveraged long ETF such as the Proshares Ultra Q’s (QLD) or the Proshares Ultra Russell (UWM)

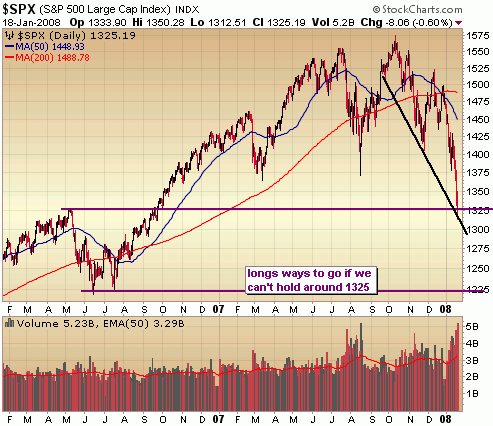
We see the S&P touching the bottom of a downward trend as well indicating a good potential point to begin rallying.  Also note this is the point of the 2006 high, creating another potential support area.  If we can’t hold in the 1300 – 1325 area it’s a long ways down to the next level of support, S&P 1225.  We need to hold here or it’s going to get even uglier.

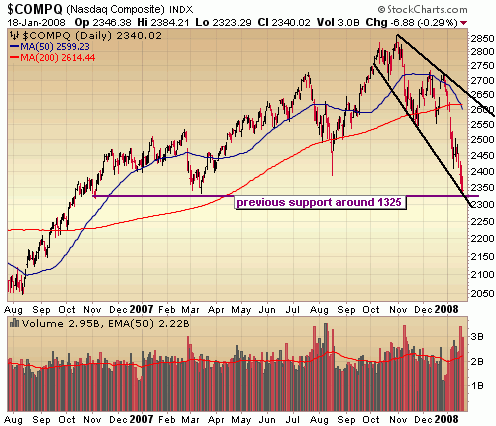
Same story with the Nasdaq.  Support at the bottom of the downward channel and an area of previous consolidation around 2325.  Also a long ways to go if we don’t hold  around these levels.  Next support is at Nasdaq 2000.  Yeah, that’s a nearly 15% additional drop from current levels.  Ouch.  We better get going here.

 ::: Model Portfolio :::

** This section will now appear as a separate report to be published on Wednesdays

The Self Investors Model Portolio just wrapped up 2007 with a 30.2% gain.  Would you like to receive buy and sell alerts within minutes of each transaction in the portfolio?  You can receive these along with ALL of the tracking tools and reports with the very popular Gold membership.  Don’t delay, get started today and join me for many more highly profitable months here at SelfInvestors.com.

::: Best/Worst Performers :::

– Top 10 Performing Industries For the Week –

1. Home Improvement Stores: 5.80%
2. Sporting Goods: 4.70%
3. Trucking: 3.80%
4. Residential Construction: 3.30%
5. Semiconductor – Equipment & Materials: 3.15%
6. Department Stores: 2.65%
7. Jewelry Stores:  2.15%
8. Food Wholesale: 2.10%
9. Specialty Retail: 1.15%
10. Medical Equipment Wholesale: 1.10%

– Top 10 Worst Performing Industries For the Week –

1. Surety & Title Insurance: -25.60%
2. Heavy Construction: -13.40%
3. Agricultural Chemicals: -12.30%
4. Copper: -11.55%
5. Technical Services: -11.40%
6. Oil & Gas Equipment & Services: -11.30%
7. Building Materials Wholesale: -11.15%
8. Wholesale Other: -11.10%
9. Industrial Metals & Minerals: -10.65%
10. Nonmetallic Mineral & Mining: -12.85%

– Top 5 Best Performing ETFs For the Week –
 
1. HLDRS Internet Infrastructure (IIH)
4.60%
2. SPDR Homebuilders (XHB) 3.30%
3. Ishares US Home Construction (ITB) 3.05%
4. Ishares Tawain (EWT) 2.05%
5. HLDRS Retail (RTH)
 1.50%

– Worst 5 Performing ETF’s –

1. iPath India (INP) -22.25%
2. PowerShares Asia (PDQ)
-15.70%
3. Market Vectors Global Alternative Energy (GEX)  -14.30%
4. India Fund (IFN)
  -13.20%
5. 
Powershares Clean Energy (PBW)  -12.60%

:::  IPO’s Worth Watching for This Week :::

This section will now appear as a separate post on Mondays.

While 2008 should be a much slower year for IPO’s considering the deterioration of the market, there will continue to be some good companies coming to market here and there.  I’ll be highlighting the best IPO’s every Monday.

::: Upcoming Economic Reports (1/21/2008– 1/25/2008) :::

Monday:         None – Holiday
Tuesday:       None
Wednesday: Initial Claims, Existing Home Sales, Crude Inventories
Thursday:      None
Friday:            None

::: Upcoming Notable Earnings Reports :::

Monday:
Satyam Computer (SAY), HDFC Bank (HDB)

Tuesday:
Jacobs Engineering (JEC), Fastenal (FAST), Apple (AAPL), Bank of America (BAC)

Wednesday:
Noble (NE), Ametek (AME), Stryker (SYK), Freeport-McMoRan (FCX), Parexel (PRXL), CNH Global (CNH), Energen (EGN), Gilead Sciences (GILD)

Thursday:
Siemens (SI), Nokia (NOK), MEMC Electronics (WFR), Alladin Knowledge Systems (ALDN), Sunpower (SPWR), Danaher (DHR), Microsoft (MSFT), VistaPrint (VPRT)

Friday:
Weatherford Intl (WFT), IDEXX Laboratories (IDXX), Caterpillar (CAT)

::: In Case You Missed It – SelfInvestors Blog Entries of the Past Week :::

1. 2030 Projections for the Oil & Gas Industry

2. Brief Hiatus

3. Take the Fear Out Of Options With a Straddle

4. Final Portfolio Review – SelfInvestors Up 30.2% in 2007

2030 Projections for the Oil & Gas Industry

Oil & Gas Industry Perspective:  What’s Ahead
by Robert Williams
Although these industry perspectives are designed to identify companies actively involved in all oil/gas industry aspects this issue focuses on year 2030 projections and Energy Industry Exchange Traded Funds (ETF). The first Industry Perspective highlighted oil/gas engineering companies and the second Industry Perspective focused on offshore crude oil exploration and production. The future energy use projections in this Perspective are based on industry reports issued by US Energy Information Administration (www.eia.doe.gov); International Energy Agency (www.iea.org; www.worldenergyoutlook.org) and American Petroleum Institute (API: www.api.org). The following perspectives are provided rather than churning out data tables and pie charts. Pie charts you can’t eat but candlestick charts you can take to the bank.
 
The question is will there be enough oil and gas in 2030 or will there be an excess due to Alternative Energy developments? Will we be driving hydrogen-fueled automobiles by 2030?
 
Industry Perspectives
 
1.     Energy usage in the United States is forecast by the Energy Information Administration (EIA) to increases 34% in the next twenty-five years, or 1.1% annually.
2.      Fossil fuels (oil, natural gas, and coal) account for 88 percent of the growth [out to 2030],” states the EIA “with coal use increasing by 53 percent, petroleum by 34 percent, and natural gas by 20 percent over that period.”The market share of oil, gas, and coal is expected to be approximately 86 percent in 2030, the same share as today. Globally, the story is much the same, with fossil fuels accounting for 83% of the increase in projected demand out to 2030.
3.      Energy consumption continues to increase because of population gains and higher per capita usage from greater wealth and access to new appliances and devices
4.      Globally, the Organization for Economic Co-operation and Development’s (OECD) International Energy Agency projects a 52% rise in energy consumption by 2030, a 1.6% annual increase led by developing countries many of which are expected to escape energy poverty and improve their living standards.
5.       In 2030 the average real price of crude oil is projected to be $72 per barrel in 2006 dollars or about $113 per barrel in nominal dollars.
6.       $100 per barrel crude oil could possibly be a psychological barrier to spur alternate energy development and really affect transportation consumption.
7.        Worldwide new refinery and refinery expansion programs will be on-stream in 2009 and 2010 which will maintain crude oil demand, with a definite shift to heavy crude oil/tar sands refining.
8.         The increase in China’s energy demand between 2002 and 2005 was equivalent to Japan’s current annual energy use
9.         India is set to become the world’s third largest oil importer after the US and China before 2025, according to the International Energy Agency (IEA). India’s energy needs would overtake Japan as the third largest net importer of oil before 2025.
10.      Despite high crude oil prices economic growth has been very strong especially for China and India but also globally. Is this the reason for high crude prices or pure speculation based on negative inventory reports and Nigerian violence news reports (as reported Jan 2, 2008)?
11.       Is ongoing global warming going to continue affecting energy consumption for winter heating and summer cooling? Natural gas is extensively used for electric power generation.
12.       Energy is consumed in four economic sectors of residential, commercial, industrial and transportation. All these economic sectors will continue to expand their oil and gas consumption.
13.       Crude oil is still required for road asphalt, roofing, petrochemical plants, packaging waxes, pharmaceuticals, adhesives and even cosmetics. Transportation has been and still is almost totally dependent on petroleum products. Natural gas is still required for chemical and rubber manufacture.
14.       Crude oil production has been ongoing since August 1859 and overproduction has driven prices down occasionally, but only temporarily.
15.       China is the world’s manufacturing hub (if you had not noticed) due to current cheap labor costs, its market size and rapid technological modernization. Next Oil & Gas Industry Perspective will highlight China oil companies and their global development.
16.        The transition to alternative and renewable energy will take a very long time which will be supported only by continued high crude oil prices.
17.         US Strategic Petroleum Reserves (SPR) are currently just less than 700 million barrels of crude oil. Congress has designated that the SPR shall hold 1 Billion barrels whereas President Bush has targeted 1.5 Billion barrels in 20 years. The federally-owned oil stocks are stored in huge underground salt caverns along the coastline of the Gulf of Mexico. Current days of import protection in SPR are 56 days. The IEA requirement is for 90 days of import protection. Average price paid for oil in the Reserve is $27.73 per barrel
18.           SPR allows the United States to meet part of its International Energy Agency obligation to maintain emergency oil stocks, and it provides a national defense fuel reserve.
19.           Author has five years engineering through to operations experience with Saudi Strategic Storage Program where petroleum products were stored in underground tanks protected for nuclear, chemical and biological warfare. Saudis do not need to store crude oil underground. 
20.           Home heating oil reserves (in above ground storage tanks) also exists in North East US of about 2 million barrels.
21.            New Federal buildings have new target codes to achieve at least 30% energy efficiency over prevailing building codes.
 
Oil & Gas Industry ETF
 
1)       SELECT SECTOR SPDR -ENERGY (XLE: AMEX) – Includes companies from the following industries: oil, gas, energy equipment & services.
2)       OIL SVC HOLDRS (OIH: AMEX) –. There are currently 18 oil service industry companies included in the investment most of which were identified in previous Industry Perspectives.
3)       CLAYMORE ETF TRUST ENERGY (ENY: AMEX) – Correspond generally to the performance of an equity index called the Sustainable Canadian Energy Income index. The index is comprised of 30 stocks listed on the Toronto Stock Exchange (the "TSX"), AMEX, NASDAQ or NYSE.
4)       ISHARES TR DJ OIL EQUIP (IEZ: NYSE Arca) – Includes companies that are suppliers of equipment or services to oil fields and offshore platforms, such as drilling, exploration, engineering, logistics, seismic information services and platform construction.
5)       ISHARES TR DJ OIL&GAS EXP (IEO: NYSE Arca) – Includes companies that are engaged in the exploration for and extraction, production, refining, and supply of oil and gas products.
6)       ISHARES TR DJ US ENERGY (IYE: NYSE Arca) – Includes companies in the following sectors: oil and gas producers and oil equipment, services and distribution.
7)       ISHARES TR S&P GBL ENER (IXC: NYSE Arca) – Includes oil equipment and services, oil exploration and production, and oil refineries.
8)       POWERSHARES ETF TRUST ENERGY SEC POR (PXI: AMEX) – The index consists of approximately 60 U.S. energy companies. These companies are principally engaged in the business of producing, distributing or servicing energy-related products, including oil services, pipeline, and solar, wind and other non-oil based energy.
9)       PROSHARES TR ULTRA O&G PRO (DIG: AMEX) – The investment seeks daily investment results which correspond to twice the daily performance of the Dow Jones U.S. Oil & Gas index. The fund normally invests in equity securities and/or financial instruments (including derivatives).
10)    PROSHARES TR ULTRASHORT O&G (DUG: AMEX) – The investment seeks daily investment results which correspond to the inverse of the daily performance of the Dow Jones U.S. Oil & Gas index. It may employ leveraged investment techniques in seeking its investment objective.
 
Please note that DIG and DUG are inverse to each other. Is there a profitable trading strategy that applies to switching between these two funds?

Summary
 
Hydrocarbons (crude oil and natural gas and their derivatives) are expected to remain the mainstay of the U.S. energy sector for the foreseeable future.  Hydrocarbons are projected to remain the dominant energy source on a worldwide basis, as well. However, it is important to note that technology development has made current hydrocarbon use much more environmentally friendly compared to several decades ago (e.g., reduced sulfur in gasoline and diesel, reduced toxics in gasoline), and additional technology development promises to continue this trend.
 
Brief Bio
 
Author’s 40 years experience includes oil/gas engineering in crude oil/petroleum products/natural gas refining, processing and pipelines on all continents, except South America and Antarctica, from Alaska and Australia pipelines to S.E. Asia offshore, from UK North Sea to Los Angeles fuel truck racks and from Romanian pipelines to West Africa FPSO.
 
 
“You can cause happiness wherever you go, or whenever you go”
 
“A bus or a train stops at a station, so why do I have a work station on my desk”
 
“The stock market provides hope and greed which is easily converted to fear and pain”

Brief Hiatus

Between battling flu bugs and an exhausting move I’m just not able to get back up to speed here in 08 as quickly as I had hoped.  Posting will be light again from me this week but I fully expect to be back working my tail off next week to bring you profitable ideas.  In the meantime, look for two excellent posts from SelfInvestors contributors Robert Williams taking a look at the oil industry and Barry Brush discussing an options straddle trade. 

Final Portfolio Review – SelfInvestors Up 30.2% in 2007

2007 was quite a year, perhaps one of the most difficult years to trade the markets in a very long time maybe ever.  I think 2008 could be more of the same, with traders scoring the biggest gains.  2007 was a good year for the SelfInvestors Model Portfolio, following up a 2006 gain of 27.6% with a 30.2% gain this year.  I think more important than the gains, were the lessons learned along the way.  It’s what keeps my job fascinating (if you can call it a job).  Every day presents new challenges, every year provides lessons and can highlight areas of improvement.  The important thing is to track your trades, review your trades, write about your trades in a journal.  It’s amazing what you can learn by going back and reviewing your thoughts over the course of the year and looking at the things you did right and the things you did wrong.  That’s one thing I have been doing more of right here at the blog for all to see. 

I believe in 100% transparency here at SelfInvestors with a review of my Model Portfolio every week.  I do this not only because I’m disgusted with the way that this business promotes itself (by highlighting a few big winners), but because it allows me a place to track my thoughts and more importantly so that my readers can learn from my triumphs and certainly my tribulations.  Reviewing the portfolio, writing the market analysis reports, the IPO updates and everything else on this blog has made a big difference in my trading.  Here’s a tip:  if you want to improve your trading set up a blog.  Who cares if nobody reads it.  It’s for you.  It’s a place to vomit your thoughts out in a permanent place and review at the end of the year.  Your results HAVE to improve.  It doesn’t even need to be public.  Set up a private blog if you have to.. whatever you do, set up a blog in 2008.  Email me if you need help getting set up.  It’s not as difficult as you might think.  Go do it now.

Enough rambling out of me.   I just wanted to highlight a few key points from the Model Portfolio this year and throw out some stats to squash some very common misperceptions about trading the market.

First and foremost.  Forgive the BOLD and UNDERLINE but you need to remember this.  I often get asked the question "What is your winning percentage?".    I cringe everytime I hear this.  It’s NOT ABOUT WINNING PERCENTAGE.  Let me just tell you right now what my winning percentage was this year.  I’m right a bit more than 50% of the time and I’m proud of that.  If I can be right 50% of the time I know I will do extremely well year after year. 

Why is that?  It’s all about money management.  I’ll say it again.  IT’S ALL ABOUT MONEY MANAGEMENT.  If my profit to loss ration is 2:1 or 3:1 I only need to be right half the time.  How do you succeed by failing so much?  BY KEEPING LOSSES SMALL.   In a difficult market like we had last year, my profit loss to loss ration is about 2 to 1.  Actually it was a little less than that as you’ll see below.  In a raging bull market, I can kick it up to 3:1. 

The bottom line is that in 2007 I failed half the time, but managed to outperform the S&P500 by nearly 10X!
– IN 2007 I put on 186 positions with a winning percentage just over 50% (94 winners to 92 losers)
– My average gain was 12.5%, while my average loss was 6.45%

It was a very good year, but I’ll be the first to admit I can improve.  For one, my shorting strategy was unsuccessful period.  That can’t happen again this year so I’ve looked at the number in great detail to find out where I went wrong.

– I put on 51 short trades this year, but on average each trade represented a loss of .43%. 
  (Yes my shorting strategy did not work this year!)
– I discovered that my Nasdaq Ultra Shorts (QID) were a problem this year with losses of -10.95%, -20.21%, -10.53, -1.06%, -12.37% and -4.73!  Yikes. 

Taking out the failed QID positions and my average gain on the 51 short positions jumps from a loss of .43 to a gain of .72%.  My style of trading is more successful with individual stocks.  That’s clear from the results, so I won’t be hedging with any of the Ultra ETF’s this year.  That’s one way I plan to improve my results.

Improvement Plan

Capture bigger trends!!!!!!  Few profits captured in solar on the long side this year and even fewer profits (ZERO) captured in shorting financials, realty and homebuilders.

Avoid the leveraged Ultra ETF’s of the major indices.  I’m better trading the inefficiencies of invidual stocks.

What Did I Do Right?

First and foremost as I mentioned above I kept losses small for the most part.  That part of my strategy will never change from year to year.  I don’t care what kind of market we are in.  If you’re not keeping losses small you won’t succeed.  Actually my average loss was a bit too large this year.  I like to be closer to 5%, so another area I will work on this year is staying away from the occasional 15 – 20% loss which can happen quickly in my Quick Strike Profit plays.

Supplementing the portfolio with higher risk, higher reward low priced stocks.  I began implementing what I call Quick Strike Profit plays in 2006 which has added a boost to the portfolio.  These are purely technical swing trades in big momentum stocks where I’m looking for a quick 15 – 30% gain in just a few days or weeks.  Examples of these kinds of trades in 2007 were CRDC (45% gain), MVIS (38%), NEXC (15%), BZP (17%), MSI (27%), ALTI (16%) and ZICA (20%).

Trading IPOs.  In previous years I found that I wasn’t doing a good job of keeping track of the best companies to market and missing out on some extraordinary gains.  In 2007 I did something about it, by developing the new IPO Tracker and IPO Portal  as well as adding an IPO section to the Weekly Reports to highlight the best upcoming IPO’s.  I didn’t catch them all this year, but scored some nice gains in LULU (26% and 23%), WX (36%) and PWRD (18%)

No leverage, lots of cash.  I didn’t use one penny of margin this year and maintained an average of a 40 – 50% cash position for more than half of the year!  That’s right, the portfolio outperformed the S&P nearly 10x with VERY LITTLE risk.

Diversified.  I carried around 10 positions across a variety of industries and hedged with short positions for nearly the entire year.  My short positions hurt me this year because of the QID failures but this year I will succeed on the short side.  I have to.  Having a short strategy is key to killing it in a tough year, so I’ll avoid the Ultra ETF short plays and stick to shorting individual stocks, which is where I did have some success in 07.

Google.  It was 10 – 15% of my portfolio this year.  A portion of my portfolio is made up of core positions and Google was the pillar this year, returning about 50%.

Stripper Stocks.  RICK and PTT (now VCGH) both took off this year.

Model Portolio Commentary Highlights

The following are some highlights over the year which captures my frustrations with my underperformance in the middle of the year, my trust in my strategy, a few lessons along the way and ultimately an achievement of my goal for 2007. 

May 28
After leaning the wrong way for much of the past several weeks, I’m still looking to get back in synch with this market after a strong performance in the first few months of the year.  With the YTD performance at 4% (compared to 6.9%), I’ve got my work cut out for me in the latter half of the year.

June 18
With the long overdue selling setting in, the portfolio is beginning to  get in better synch with this market and beginning to close the gap of underperformance.  I mentioned last week that I began getting short way too early and that hurt my performance, however I expect my current positions/strategy to begin paying dividends.  The portfolio was off just .2% last week, but still significantly lags the S&P with a 3.5% YTD return.  I’ve certainly got my work cut out for me if I’m going to whoop the S&P again this year.  I’m 15% cash.

July 15th
I still don’t regret the decision to hedge my bets with these Ultra Short ETF’s, despite te fact it hurt my performance considerably.  I have to trade what I see and what has worked well for me over the years.  From a technical perspective, my analysis was showing some trouble ahead.  It hasn’t panned out that way but I’m still in good position to beat the market by keeping pace during what has been a highly irrational (from a technical perspective) and volatile market.  A sizable portion remains in cash (30%).  UP 8.9% year to date.

Aug 12
As I’ve been saying for the past several weeks here, I starting hedging with short positions a bit too early and it hurt my performance as I misssed out on much of the rally from April to July.  A few people were even kind enough to remind me that they weren’t missing the rally.  Gotta love the gloating.  You won’t find me gloating much in this segment of the Weekly Report when I’m right just as you won’t find me kicking myself for lack of performance when I’m wrong.   Keeping your emotions in check and remaining level headed is critical.  The main purpose of this segment is to provide 100% transparency in my performance in the hopes that maybe other advisory services will have the balls to do so.. and as a reminder that it isn’t always easy to profit big in the market (despite what what many services will have you believe).  Hopefully, you can learn from my successes and failures just as I continue to learn from my own successes and failures.  I won’t always be right, but I will continue to remain confident and trust what the charts are telling me.  In all, the portfolio surged again last weak, vaulting 3.4% higher, bringing the YTD performance to 9.7% which is nearly 4x the performance of the S&P.  What a difference a couple weeks make.  While it may seem like I’m way too aggressive in this environment it should be noted that I’ve been trading small positions and am carrying what might be my largest cash position in a few years.  Overall current allocation is 52% long, 5% short and 43% cash.

Sept 23
Every couple of months or so, there is what I would call a major shift in the portfolio from short to long or long to short.  Considering I was treading lightly with just a few long AND short positions and evenly balanced on either side, I wouldn’t call last Tuesday a dramatic shift in the portfolio, but I certainly acted quickly and decisively by closing out my four small short positions immediately following the Fed decision.  The Self Investors Model Portfolio year to date performance increased to 10.9% and the allocation stands at 37% long, 0% short and a large 63% cash position.

Oct 7
For a few months I hadn’t been playing too many of what I call QSP (quick strike profit) trades which are basically swing trades where I’m looking for big profits in momentum stocks in a very short time frame.  However, while the market has gained strength over the past several weeks I’ve begun to play these quite a bit more and this week the strategy paid off in a big way.  The KEY: cut your losses quickly in these volatile plays and eventually that one big run will wipe out a few small losses and really accelerate your returns.  In addition to some nice gains in QSP trades recently, the portfolio continues to be led by Google (GOOG) a long term holding as well as IPO plays LULU and WX.  For the week, the portfolio surged to a 4.3% gain bringing the YTD gain to 15.6%.  Now that certainly isn’t world beating performance, but as I’ve said before, the market has been unusually difficult to read this year and I missed much of the move in the first half of the year.  I feel like now I’m catching up and in great position to at least double the return of the S&P by the end of the year just as I did last year.  I’m still carrying a decent cash position at 32% and probably won’t move too much more to the long side until we get some kind of pullback/consolidation.

Oct 21
My strategy of playing cautious with a large cash position of near 50% but initiating positions in fairly aggressive stocks continues to pay off extremely well. If you’ve been following my review of the portfolio here in 2007 you know that I struggled a bit in the middle of the year so this is a big turn around and hopefully is a good reminder to all who trade their own accounts that there will be peaks and valleys along the way.  The key is to keep emotions in check, stick with the strategies that have been successful in the past  and remain confident!

Nov 4
The overall market dipped a bit last week but the Self Investors Model Portfolio continues to surge higher tacking on another 3.2% for the week, bringing the year to date performance to  27.6% (exactly where it closed 2006).  I’m continuing to tread lightly in this volatile, unpredictable trading environment.  As I’ve mentioned before, it really is one of the most difficult markets to read I’ve seen in quite awhile so I’m not willing to make large bets on either side (currently sitting on 55% in cash).

Dec 2
With the volatility and uncertain market, I will continue to keep the portfolio sitting on a sizable cash position of around 50% (it’s currently at 46%) as well as hedge with short positions.  It’s a strategy that has worked extremely well in 2007 and I don’t anticipate deviating from it too much over the next several months.

Dec  19
At this point, I don’t really care what the market does from here to the end of the year.  I’m going to maintain a conservative approach and sit on around 40% cash.  If I don’t make another dime from now until the end of the year, I can be satisfied with the 30% gain here in 2007 and looking forward to next year when I anticipate a shorting strategy will be critical.  I’m ready and waiting.  Bring it on bears!

If you’ve read this far, thanks for sticking with my rambling vomitarium of free flowing thought on my performance.  I hope it helps you as much as it helps me. 

Good trading to you in 2008!

If you’re interested in trading along with SelfInvestors in 2008 have a look at my membership options or send me a shout.  I’d be happy to discuss the service that can be most beneficial to you. 
Minor Capitulation Near August Lows; Stock of Day – Parexel (PRXL)

Some capitulation today for sure ,but not massive by any means.  We opened surprisingly strong today as the market defied the downward momentum of the day before.  Some think that the Street.com’s Doug Kass article stating that the Fed will ease momentarily had something to do with it but I doubt it.  According to StreetInsider.com, Kass stated:

"I have friends who are very close to members of the Fed, and they say that the Fed will ease momentarily.

This morning, several of those friends gave me an indication of heightened concerns regarding the domestic economy — far more than what has been expressed by the President, the Secretary of the Treasury, and the Federal Reserve in various platforms over the last week.

And they say that the Fed will ease momentarily.

Enough said."

OK whatever.. more rumor.  Countrywide going bankrupt yesterday, the Fed with surprise cut today.  These kinds of rumors can lead to short term spikes either way but it’s just noise for now. 

The recession or no recession debate continues to rage on but there are certainly more and more coming out of the wood works calling for a recession.  Goldman Sachs economists predicted a recession this year with unemployment hitting 6.5% by 2009, prompting the Fed to slash rates to 2.5% by the 3rd quarter.  Bold predictions. .. and in the blue corner is Fed President Poole, trying to put a positive spin on things saying, "2008 looks to be a year of rising growth" and "economomic forecasters expect slow expansion in the first half of the year and a quickening pace in the second half."  He went on to say that the Fed can ease without risking inflation.  "Stable inflation expectations give the Federal Reserve a lot of room for maneuver."  Kind of makes you wonder what planet these guys are living on.  I can’t wait to see how Bernanke plans to save the day tommorrow with his speech titled ‘Financial Markets, the Economic Outlook and Monetary Policy’

Enough predictions, spin, manipulation and rumor.  Time for some technical talk.  I really would have liked to see some panic selling below those key support levels I discussed last night, followed by a flood of buying.  As I mentioned to my premium members today, holding short positions became too much of a risk after lunch.  The end of day buying near the August lows of the major indices flashed the exit sign on the short side, but this move doesn’t indicate it’s time to get aggressively long for the longer haul.  I personally put on a few swing trades on the long side to take advantage of an oversold bounce, but significant risk remains on the both sides of the market.  If you’re not a trader I STILL recommend staying out of this market for now.  Your body, mind and trading account will thank you.

The time will come to put on long plays a bit more aggressively, but it’s just a bit too early yet.

::: Major Indices Performance – The Numbers :::

(Note: volume averages are based on the average over the past 50 days)
Data as of 4:00EST – End of Day January 9th 2008

Nasdaq: UP 1.39% today with volume 35% ABOVE average
Nasdaq ETF (QQQQ) UP 2.13%, volume 53% BELOW average
Dow: UP 1.16%, with volume 43% ABOVE the average
Dow ETF (DIA): UP .88%, with volume 62% ABOVE the average
S&P ETF (SPY): UP 1.05%,  with volume 43% ABOVE the average
Russell Small Cap ETF (IWM): UP 1.01%, with volume 51% ABOVE the average

::: SelflInvestors Leading Stocks :::

The Self Investors Leading Stocks Index is comprised of stocks in the Breakout Tracker, which is a database of the fastest growing companies near a breakout or having already broken out of a base.  Leading stocks didn’t do particularly well today and lagged the general market.  Today’s rally was all about laggards recovering from extreme oversold conditions.

Summary:

* Advancers led Decliners 176 to 137
* Advancers were up an average of 2.27% today, with volume 26% ABOVE average
* Decliners were down an average of 2.07% with volume 56% above the average
* The total SI Leading Stocks Index was UP .37% today with volume 39% ABOVE average

::: Where’s the Money Flowing :::

Many investing websites provide leading industries based on price performance alone. However, without accompanying volume levels, this can sometimes be misleading.  The only way that I know of to gauge industry/sector strength WITH volume levels is through the analysis of ETF’s.  A couple years ago this was not possible, but as more traders/investors use ETF’s they become a much better tool for gauging the health of the market and seeing where the money is flowing (or not flowing).  Using the proprietary SelfInvestors Demand Indicator score which measures price and volume movements, I’m able to quickly see which sectors/industries are seeing the greatest inflows of cash.  For a detailed look at how I go about gauging sector/industry strength please see the following post: http://selfinvestors.com/si/industry_tracking/

* Current Leading Sectors/Industries (over last 30 trading days):  
Agriculture, Gold Miners, Commodities, Gold, Pharma
                                          
* Current Lagging Sectors/Industries (over last 30 trading days): 
Broadband, Technology, Aerospace/Defense, Industrial, Semis

* Today’s Market Moving Industries/Sectors (UP):
Global Technology, Regional Banks, Biotech, Technology, Real Estate

* Today’s Market Moving Industries/Sectors (DOWN):
Clean Energy, Home Construction, Internet Infrastructure, US Oil, Commodities, Internet

::: Stocks :::

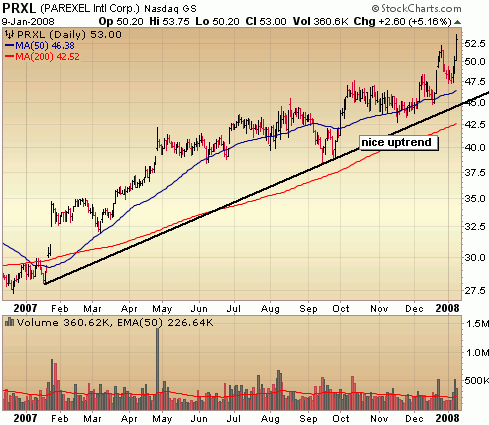
The stocks section will be an area where I highlight one stock selected from a group of stocks moving up with volume well above average and most likely breaking out of a base or consolidation.  There were very few leading stocks breaking out with big volume to new highs today, but one in particular stood out – Paraxel International (PRXL).  Despite a somewhat severe market corrrection over the past few months, PRXL just keeps chugging along to new all time highs with little attention.

ABOUT: 

PAREXEL International Corporation is a bio/pharmaceutical services company, providing a range of capability in clinical research, medical communications services, consulting, and informatics and technology products and services to the worldwide pharmaceutical, biotechnology, and medical device industries. Its product and service offerings include clinical trials management, data management, biostatistical analysis, medical communications services, clinical pharmacology, patient recruitment, regulatory and product development consulting, health policy and reimbursement, industry training and publishing, medical imaging services, interactive voice response systems, clinical trial management systems, Web-based portals, systems integration, patient diary applications and other drug development services. In September 2007, it completed the acquisition of Taiwan-based APEX International Clinical Research Co., Ltd., which was subsequently renamed as Parexel Apex International.

FUNDAMENTALS: 

I’m surprised that Paraxel (PRXL) hasn’t received more attention over the years.  This is a company that has posted substantial earnings growth in each of the past several years dating back to 2002, with the exception of 2005.  Excellent earnings growth is expected to continue for at least the next 2 years according to analysts.  Estimates call for a 28% earnings jump this year and 25% next year.  While net margins aren’t exceptional and not characteristic of a homerun stock at just 5%, they are above the industry average.  Return on equity is much better at around 15%.  Overall, this is a very good company fundamentally.

TECHNICAL:  

PRXL has been in a long, steady uptrend for over 2 years now and isn’t showing signs of slowing anytime soon.  Given the fact that it has been so strong in a such a weak market is a testament to its strength.  Having said that though, it’s a bit extended so is risky at these levels.  I would look to add shares on pull backs to near the 50 day moving average.


SELFINVESTORS RATING: With a total score of 49/60 (24/30 for fundamentals, 25/30 for technical), Parexel (PRXL) is a good SelfInvestors leading stocks and should be put on the radar.

Full Disclosure/Disclaimer: The stock of the day is by no means a buy recommendation.  Please do your own research and make a personal decision based on your own tolerance for risk.  I currently do not own a position in Parexel (PRXL)

Market Oversold, But It’s a Bear Market

Apologies for not getting the weekly report out this Sunday.  With a major move in the works for me and scrambling to get caught up after a few weeks off, it’s going to take a few more days to get back into full swing.  My priorities will change a bit this year as well.  No more all nighters getting blog posts up, updating databases, researching, etc.  

First and foremost, my health and time with friends and family will come first.  I’ve made many sacrifices over the past four years to create this site and it’s now getting much closer to the point where I’m happy with it.  That’s not to say I won’t continue to work hard and present profitable ideas here, it’s just that at times posting here may be a bit on the the light side.  Helping fill out the blog in 2008 will be the insights of 3 great bloggers, two of which you may have read late last year – Robert Williams (oil industry reports) and Barry Brush (options extraordinaire).  This year, I think you’ll also enjoy reading articles from Lance  Chastain, a serial entrepreneur bursting with insights and knowledge on personal and business success.  It will be a great contrast to the trading talk.

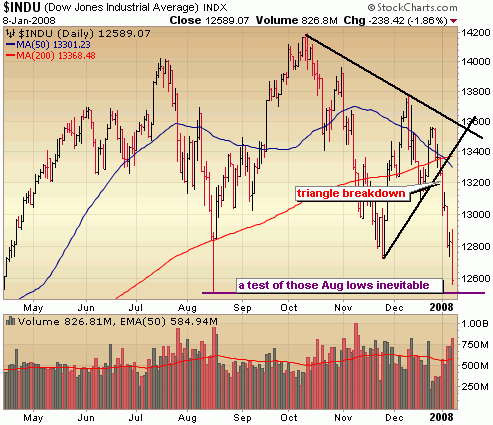
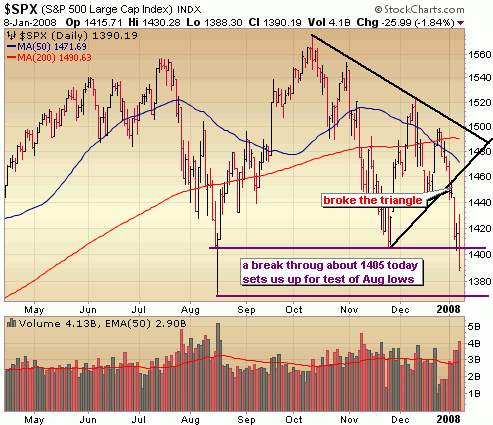
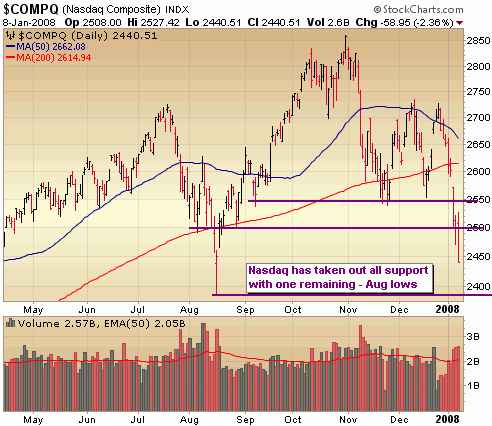
What a week to start 08 though!  With today’s loss, it marks the worst start to the S&P ever.   Yikes.  The Nasdaq is already down 8% this year.  In my last market report I mentioned that the bulls and bears had drawn the lines in the sand, with the Dow and S&P carving out triangle formations and the Nasdaq holding above key support around 1550.  A break down below those levels in the Dow and S&P last Wednesday was warning signal number 1 and on Friday when the Nasdaq took out key support, that was warning signal number 2.  The lines were drawn out in the charts and the bears have won.  There isn’t any other way to say it.  Yes, this is officially a bear market.. for the most part.  More on that below.

Having said that we are reaching oversold conditions in the short term and there will be some great trading opportunities on the long side very soon.  It looked as if today we might begin a weak oversold bounce following yesterdays minor reversal off the lows.  However, rumor of a Countrywide Financial (CFC) bankruptcy filing later this week took the wind out of a mid day rally and just as the market began to recover, the AT&T CEO mentioned at a conference that the company faces softness from the consumer and that the company is disconnecting more home-phone and high-speed Internet customers for failing to pay their bills.  This isn’t earth shattering news but indicates the market was looking for an excuse to sell.  It was a dramatic reversal in the last 2 hours of trading today and volume was heavy indicating an exodus by the institutions.

The daily charts below show the breakdown out of the triangle formations in the Dow and S&P and the setup for a test of those August lows.  I’ll be looking for some kind of capitulation below those August lows as an entry point to get fairly aggressive on the long side for a few weeks.


.. and in the Nasdaq, it’s break after break of support over the past several days setting up a showdown at the August lows around 2400.  Again, looking for some panic selling around this area and resulting capitulation as a signal to get long.

Bear Market Emerges

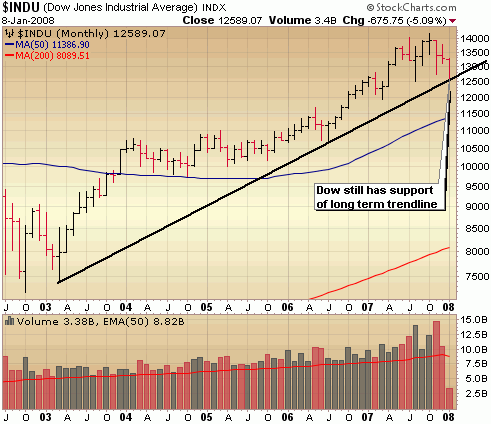
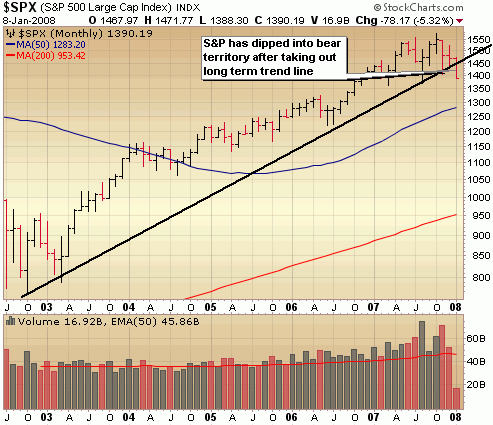
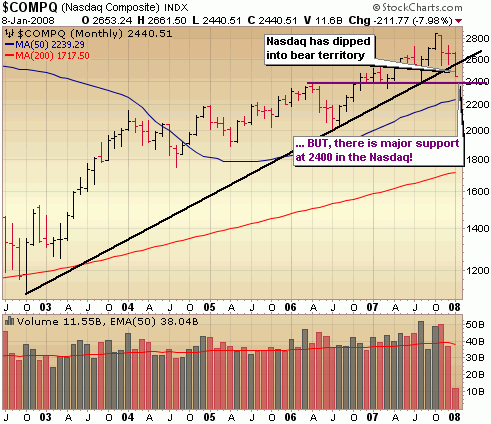
While the Dow sits right on the bear/bull mendoza line, both the S&P and Nasdaq have crossed over to the grizzly side by taking out long term trend lines.  Taking a look at the monthly charts you see the break of the trends but with major support levels close by. 

Dow 12500, just 89 points aways is a critical support level.  Remember that it’s highly possible we dip below that level which could trigger some panic selling.  The important thing is how the market closes.  I wouldn’t mind seeing a big flush of sellers tomorrow.  Down another couple hundred more intraday, followed my some massive end of day buying.  That’s my signal to get back in with more aggression on the long side.

The break below of the trend line that has defined the bull market over the past nearly 5 years signals a bear market in my opinion.  While we’re oversold in the short term and sizable rally will provide more short opportunities.  New major resistance around 1450.

The Nasdaq has also signaled a bear market with a breach of the long term trend line.  Look for a drop to major support around 2400 as an opportunity to trade on the long side for a bit, but ultimately this is a bear market and short positions should play a major role in your portfolio this year.

 ::: Model Portfolio :::

** This section will now appear as a separate report to be published on Wednesdays.  I’ll have a special end of year 2007 review of the Model Portfolio up tomorrow night or Thursday morning.

Would you like to receive buy and sell alerts within minutes of each transaction of the Model Portfolio?  You can receive these along with ALL of the tracking tools and reports with the very popular Gold membership.  Don’t delay, get started today and join me for many more highly profitable months here at SelfInvestors.com.

::: Best/Worst Performers :::

– Top 10 Performing Industries For the Week –

1. Gold: 9.55%
2. Drug Manufacturers – Major: 3.85%
3. Research Services: 2.30%
4. Beverages – Soft Drinks: 1.75%
5. Cigarettes: 1.65%
6. Health Care Plans: 1.50%
7. Farm Products:  1.45%
8. Specialized Health Products: 1.45%
9. Drugs Manufacturers – Other: 1.00%
10. Building Materials Wholesale: .95%

– Top 10 Worst Performing Industries For the Week –

1. Mortgage Investment: -19.15%
2. Residential Construction: -18.30%
3. Major Airlines: -16.25%
4. Surety & Title Insurance: -16.00%
5. Banks – SE: -15.25%
6. Semiconductors – Integrated Circuit: -14.50%
7. Personal Computers: -14.15%
8. Recreational Vehicles: -13.85%
9. Semiconductors – Broadline: -12.95%
10. Resorts & Casinos: -12.85%

– Top 5 Best Performing ETFs For the Week –
 
1. Market Vectors Gold Miners (GDX)
10.85%
2. Asa Limited Gold (ASA) 8.65%
3. Central Fund of Canada (CEF) 6.10%
4. Ishares Silver (SLV) 6.05%
5. US Natural Gas (UNG)
 5.90%

– Worst 5 Performing ETF’s –

1. Ishares US Home Construction (ITB) -19.05%
2. SPDR Home Builders (XHB)
 -16.80%
3. Powershares Dynamic Semis (PSI)  -14.00%
4. Thai Fund (TTF)
  -13.40%
5. 
Ishares Semis (IGW)  -12.75%

:::  IPO’s Worth Watching for This Week :::

This section will now appear as a separate report on Mondays, however with the beginning of a new year and the market struggling there are no IPO’s expected to begin trading over the next few weeks.  It might not be until February until we get new IPO’s coming to market.

::: Upcoming Economic Reports (1/7/2008– 1/11/2008) :::

Monday:         None
Tuesday:       Pending Home Sales, Consumer Credit
Wednesday: None
Thursday:      Initial Claims, Wholesale Inventories, Crude Inventories
Friday:            Export/Import Prices, Trade Balance, Treasury Budget

::: Upcoming Notable Earnings Reports :::

Earnings season doesn’t begin ramping up until next week!