All posts by Tate Dwinnell

Visa IPO: Too Much Hype – Consider These Top 15 In Demand IPO’s

The highly touted, the much anticipated and overly hyped Visa IPO is set to debut tomorrow under the ticker symbol "V".  It priced tonight above the expected range of $37 – 42 at $44/share.  Not much of a surprise there.  I get more emails regarding the Visa IPO then I have total in the 4 years of running this site.  Everyone one wants to know when and how they can get a piece of this action, some that don’t have a broker and have never traded a stock in their life.  Does that tell you about the demand in this thing?  It’s overboard.

I prefer IPO’s that lurk behind the scenes and double while nobody is watching.. By the time the masses are interested you’re out with big gains.  It’s how the game works.  I don’t like the Visa IPO out of the gates tomorrow for this simple reason.  Everyone talks about how well Mastercard (MA) did after it’s IPO, but nobody ever mentions that Mastercard (MA) had a fraction of the hype that Visa did and actually traded sideways for two months after its IPO before breaking out in late summer of 06 for a tremendous run. 

Don’t get me wrong.  I think over time Visa will produce outstanding returns, but jumping in out of the gates tomorrow for fear of "missing out" is a big mistake. 

There are other "off the radar" IPO’s that will produce far greater returns than the Visa IPO over the 6 months and I’m willing to bet a steak dinner on it.  Here’s the bet.  Of the list of IPO’s below that are showing the greatest demand over the past 30 days, I’m willing to bet that the average return of 8 of those will outperform Visa over the next 6 months.  It’s game on for the first person to take the bet in the comments section below.

This is a snapshot of the IPO Tracker here at SelfInvestors.com which shows IPO’s with highest DI score over the past 30 days.  DI is a proprietary indicator I use to measure the demand in a stock using price and volume.  It’s a database of only the highest rated IPO’s over the past 18 months or so in terms of fundamentals (earnings/sales growth, ROE, margins, management ownership, debt/equity). 

I"m currently offering a no obligation 30 day free pass to the tracker for those that join the new IPO community, which you can join below the banner above if you’d like.  I’m working hard to create the #1 private, moderated community exclusive to the best IPOs.  For more on the IPO Tracker, you might like to have a look at a new video demo I put together a few nights ago.  It’s what I like to call low fi production but hey it gets the job done.  I’m thinking of adding cheesy music from 80’s movies in my next videos so enjoy the barebones version while it lasts.

AND with that I present to you the top 15 IPO’s showing positively, absolutely, earth shattering demand over the past 30 days.  Most of these are off the radar and I can assure you nobody will ever email me asking how then can get in.. and that’s just the way I like it.
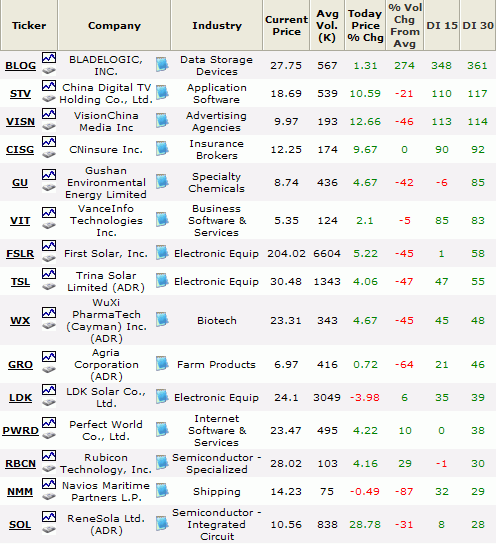
Now I choose my Great 8 (in equal parts)  to beat the return of the Visa IPO.

OK scratch BLOG it was bought out by BMC. Next.  Ok STV.  Now we’re getting somewhere.  I’m buying hand over fist between 17.50 and 20 with a stop out level below 15.  Big move up after earnings last week and looks ready to go again.  This is bottom dwellers land down here but the accumulations signals more down days then up over the next few months.  I’ll put it in my list of 8 to outperform the Visa IPO over the next 6 months.

Another China display advertiser VISN, but this one is going up unlike FMCN.  Risky but technically looks good.  Broke out at the end of February and pulling back to that area with a bounce off the 50 day moving average.  I’ll add it to the list of Great 8 to outperform the Visa IPO.

Insurance? Yuck.  Don’t like insurance.  Insurance stocks are for Buffet aficionados.  .. but CISG is interesting.  Might include it.

Gushan Environmental – Chinese, Biodiesel, Environment, Energy, IPO.  What’s not to like? Ok, well maybe the earnings aren’t the greatest in recent quarters.. I can’t take them all.  I’m already taking STV and VISN in my Great 8.  GU Out.

I’ll make a long story short –  taking all solar plays in my Great 8.  LDK, TSL, SOL and FSLR.  I’ll even throw Rubicon Technologies (RBCN), a play in the LED space to complete the "green" play picture and round out my Great 8 to beat the performance of the Visa IPO. 

So here’s the bet one last time.  The 8 IPO’s that I’ll take from this list (STV, VISN, CISG, LDK, TSL, SOL, FSLR, RBCN) will on average beat the performance of the Visa IPO over the next 6 months.  You don’t think so?  Chime in and let’s put a steak dinner on the line.

Disclaimer:  I don’t yet own any of the positions mentioned above, but soon, very soon.

Barry on Trading Tools, Mindset, ETF Options and Perspective

SelfInvestors.com contributor Barry shares some more thoughts on tools of the trade, trading emotions, the Fed, ETF options and keeping it all in perspective.  For more about Barry, please see his first introductory post.  Thank again Barry, another great post!

Get Ready, Get Set, Trade…. Options on ETFs by Barry Brush

I have a confession to make. "Trading is as much psychological as it is skill." The skill consists of being able to control the emotions of fear and greed that try to hitch a ride on every trade. It is being able to manage your time while preparing and taking action during the trade itself. Your mental set up is vital; but so too is your physical location and Setup. Depending upon your trading style, you have to be ready to mind the store when the store needs minding. If you have a trade in play and have set mental stops rather than sell stop limits, you’ll need to be available intra-day or after the close to execute your strategy. It goes without saying that your risk in a trade must be managed to a minimum; but your hardware must be flawless as well. Here’s a snapshot of my setup, and the place where I try to manage my risk.
I don’t have 6 twenty two inch monitors and a water cooled server in a closet. I trade at home in the family room from a Tempur-Pedic chair in front of a 17 inch Dell XPS laptop with all of the processor and RAM I could get into it. It sits on a cooling pad in the middle of my roll top desk with 12 of my favorite trading books to the left and a raft of option trading DVDs and CDs to my right. I keep a portion of my brains handy on about 100 3×5 cards I’ve developed over time. I use hardwired broadband on an eithernet with Wi-Fi and an AT&T air card as a backup. Their 3G network runs all my charts and real time applications from the front seat of our car while traveling. I’ve driven NY to FL and rarely broke lock on a signal. At home, Time Warner’s Roadrunner is not 100%, even in the great city of Charlotte, NC. For a spare, I bought one of those light weight Sony Laptop VGN some things on EBay for $600 and replaced the broken LCD myself for a few more dollars. If its time to exit, its time; and I don’t want to have to call my broker. It’s the principle of the thing.


I’m anal when it comes to backing up data on my computer; having learned the hard way after multiple disk failures over the years. Loosing a hard drive can be like a death in the family; so, my computer pumps its brains into both a 100 GB and 1.5 TB backup drives. Just to be safe, I subscribe to an online backup service at Carbonite.com for less than 80 bucks a year for the unlikely event of a fire or theft.

I like to make notes, FIB levels and Elliott wave ratios on the various charts I use, so the backups are important to me.  Even though I make notes on all my trades in the “At- A-Glance” daily planner that I use for my journal, I like to annotate strike price levels, entry points, stops and targets for the calls and puts I have in play on my charts. The artist in me also likes to draw out various technical price forecasting patterns on my charts. I may find a trade on a daily or 15 min chart but I like to pull the trigger on a one min chart to knock off the commission on an option trade. It’s amazing how often a Bull or Bear flag tells the truth or price breaks out of a triangle at exactly 1/3 from the tip. And the guy that’s in charge of Head & Shoulder patterns….. I sure hope they pay him more than the CEO of Bear Stearns; he’s earned it and then some.

 I also make reference on my charts to the applicable online account I’m trading with. By referencing my notes, as I cycle through my current daily watch list, I can quickly see what the market is telling me about each trade. I guess I could use some of those trade from your charts tools but I’m just not there yet. I also use a little program called RoboForm to simplify the whole online trading password thing; and love the capability of having them on a secure USB jump drive for traveling.

I check briefing.com each morning prior to the open for an awareness of what the market futures portend for the day. My cell phone starts ringing with text message alerts soon after the open because I’ve set up a ½ dozen or so 15 day moving average cross alerts so I always get a drift of the markets direction when its on a roll. Don’t pay for these. They are free everywhere. You just need to know your cell phones email address. During market hours when everything seems to be under control and on trend I’m always sharpening the saw by studying the advice of other traders through online newsletters or webinars. I try to take a break, say 11:30 to noon thirtyish to do some stretching or get a little exercise.

If you don’t have the luxury of trading full time yet and still attend a job, don’t worry, trading can still be your major monetary interest. Relaxing and making all of your decisions off of the close works perfectly well. In the evening, before or after American Idol, I make sure to read at a minimum the first two pages of the online Investor Business Daily; it’s Big Picture highlights and markets section.  I also like to skim through Robert McHugh’s daily market newsletter at technicalindicatorIndex.com.

That’s about all I need to feed my brain every day. I subscribe to and scan a lot of stuff to get good trading ideas. It’s not necessary; but I enjoy it. With sites like ours here at SelfInvestors.com you don’t really need to look very far. Tate does a terrific job of developing ideas. I like the challenge of taking some of his dogs and turning them into carriage horses with options trades. It seems that often just when he is bailing it’s a great time to get in with a put or a call. I actually bought a stock the other day. Well it was almost a stock err… ETF is what they call them, I think. What ever that stands for.

If you are convinced that the sky is falling, and that no one on Capitol Hill deserves to be there, check out EEV, FXP, TWM or QID. BUT… be careful here if you are an options trader. Follow your checklist and make sure the Bid Ask spread is manageable and the open interest is above 100 for the particular contract you trade.  Some of these are pretty new and thinly traded if at all. Don’t forget to buy enough time to hit your target. Being patient and waiting for the correct entry will reduce the time you need to buy, and thus your risk. Look for a retracement to Support or Resistance, Low volume pullback or break out on 150% of daily volume.

For fun, you might try analyzing an upside down cup and handle base. In my new book, I call it a “Pineapple Upside Down Cake”. That used to be my favorite when I was a kid; but you know, today, I still have a hard time getting my head around playing the downside even when my check list tells me I have a winner. So in a downtrend I raise my comfort level buying and selling Calls on UltraShort ETFs.

With rate cuts like automatic weapons fire, 200 billion dollars a week bailouts and no M1 in sight or in the public’s pockets; Boy! are we going to have some fun this summer! I wish some one would tell the boyz that if they don’t have any of our money left, its OK to go out of business. Don’t they realize that we have already taken ours out to pay for gasoline (energy) and food? Which by the way, under the “new rules” are excluded from CPI inflation calculations. Next thing you know, they’ll exclude the equity in our homes. OOPS! I think they already did that by prematurely raising rates to begin with.

Can you imagine the inflation indexed pay raises all government workers would get if food and gasoline were added back into the CPI. Who is in charge of that anyway, the same guy that runs Bear Stearns?

Wow! Have you checked out the new IPO resource Tate put up on the site?  In a word…AWESOME!

My wife and I and my 15-year-old daughter have an understanding about market hours; when I’m at my desk and the charts are flipping around like fish out of water, they keep the interruptions down to a low roar.  I actually think that working in the midst of family activities gives me a better perspective as to what my job is all about and why I’ve chosen the path I’m on.  Even though I consider every trade I play to be a living breathing entity, subject to every law of nature, when one is surfing the market, it’s nice to be reminded that meaningful life is all around you and that the kitchen is only a few steps away.

Cheers, 2Dimes / Barry Brush
To contact me send an email by using the Contact form (link above) and Tate will make sure I get it.  The best option is to submit your comment to the blog here 

The Fear Begins Now: St Paddy’s Day Looking Red

In the last weekend market report I talked about the importance of and relation of greed and fear.  It’s a part of trading, it’s a part of market cycles.  The greed of nearly free money has long come and go.  It’s time for fear to play it’s hand and that begins now.

From last week’s Where Are We in the Greed and Fear Cycle:

"With greed comes pain, with pain comes blame and the blame game ends in fear.  Only then can we start discussing a true bottom to a market and I don’t think we’re there yet.  As the characters of this housing horror show defended their practices in front of congress last week (where was Greenspan?) it’s quite clear the blame game is in full motion.  The public always pays first and now it’s time for the government to make an example out of a few ill intentioned CEO’s.  It’s all playing out according to the script and I don’t think we’ve seen the end of  this mess until a few of the larger financial/home builder companies go under and a few recognized executives are indicted. "

The last cycle of greed and fear produced such casualties as Enron and Worldcom.  Less than a decade later, Bear Stearns (BSC) takes its place in line.  Some good comments on what brought down Bear Stearns (BSC)

Can you sense the desperation?  With each passing day it seems the Fed is attempting to stave off a firestorm of financial collapse with water balloons, albeit BIG water balloons.  .. but eventually someone will get burned.  Uh I mean more will get burned.  The Fed seems to be running out of water balloon ammo. 

Do you believe the flat CPI number of last week?  Well do ya?   It’s probably just a setup for another big Fed rate cut on Tuesday, more dollar demise, gold rally, oil rally… more of the same.  Let’s see what PPI brings Tuesday ahead of the Fed decision.  At this point though, interest rates aren’t gonna cut it but oh what a rally we’re gonna have once we get that fear/panic driven shakeout over with.

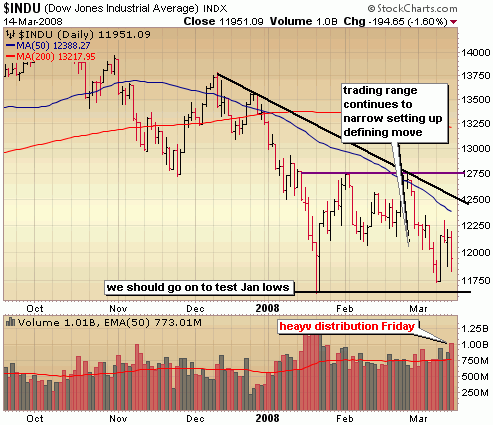
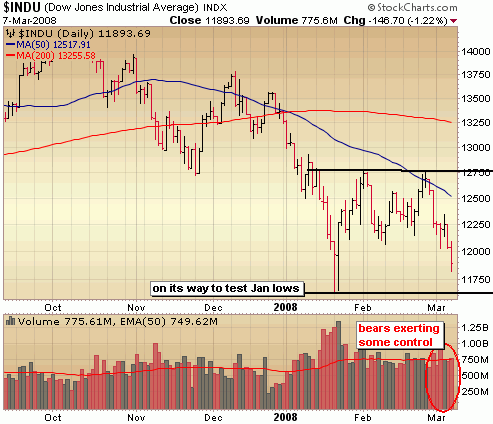
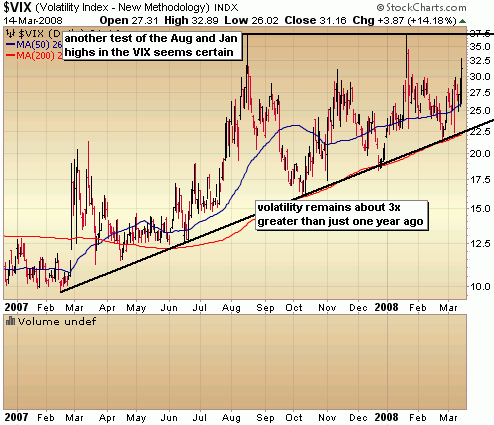
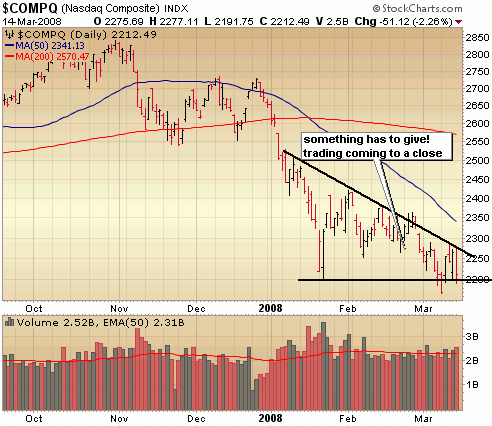
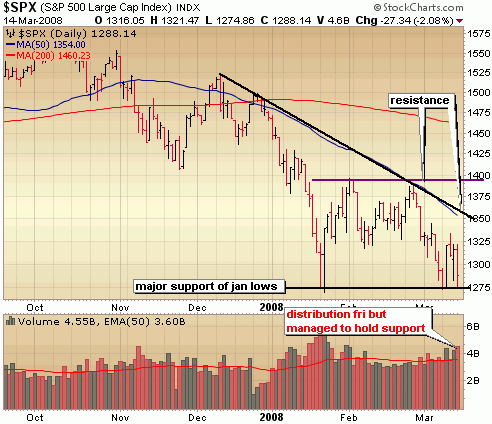
There is so much intervention and news driven skiddishness out there right now that it’s difficult to place much importance on the charts from day to day, but taking a step back reveals a narrowing trading range on all indices.  I won’t go into detail for each chart tonight.  What we’re looking at are indices that are holding support of those January lows but prone to failure given Friday’s distribution day and the spiking VIX.  Whatevever happens in the early part of next week, it’s going to be one wild ride.  Yes, you should still be out of  this market for the most part!


::: Model Portfolio :::

** This section will now appear as a separate report to be published every other Wednesday

The Self Investors Model Portolio wrapped up 2007 with a 30.2% gain.  Would you like to receive buy and sell alerts within minutes (NEW! now get them via instant messaging in near real time) of each transaction in the portfolio?  You can receive these along with ALL of the tracking tools and reports with the very popular Gold membership.  Don’t delay, get started today and join me for many more highly profitable months here at SelfInvestors.com.

::: Best/Worst Performers :::

– Top 10 Performing Industries For the Week –

1. Manufactured Housing: 7.41%
2. REIT – Healthcare: 5.90
%
3. Education & Training Services: 5.00%
4. Catalog & Mail Order Houses: 4.79%
5. Banks – Pacific: 4.45%
6. Long Distance Carriers: 4.40%
7. Silver:  4.25%
8. Banks – SW: 4.20%
9. REIT – Residential: 4.15%
10. Gold: 4.10%

– Top 10 Worst Performing Industries For the Week –

1. Toy & Hobby Stores: -26.15%
2. Health Care Plans: -17.35%
3. Major Airlines: -15.50%
4. Sporting Activities: -7.05
6. Investment Brokerage: -6.80%
7. Diagnostic Substances: -6.55%
8. Drugs Wholesale: -5.65%
9. Technical Services: -5.65%
10. Surety & Title Insurance: -5.55%

– Top 5 Best Performing ETFs For the Week –
 
1. Central Fund of Canada (CEF) 6.45%
2. Powershares Dynamic Banking (PJB) 6.35%
3. KBW Banking (KRE)  5.80%
4. Market Vectors Gold Miners (GDX) 5.55%
5. SPDR Homebuilders (XHB) 5.50%

– Worst 5 Performing ETF’s –

1. Indonesia Fund (IF) -11.50%
2. Morgan Stanley China (CAF) -11.35%
3. 
iShares US Health Care (IHF) -10.25%
4. iShares South Korea (EWY) -7.45%
5. iShares Malaysia (EWM)
 -7.00%

:::  IPO’s Worth Watching for This Week :::

The IPO market remains absolutely dead, but the big one happens this week.  The Visa (V) IPO begins trading on Wednesday.  I’ll have preview tomorrow night or Tuesday highlighting what others are saying about it and some of my own thoughts on strategy.

This section will now appear as a separate post on Mondays (if there are some interesting IPO’s coming to market).

While 2008 should be a much slower year for IPO’s considering the deterioration of the market, there will continue to be some good companies coming to market here and there.  I’ll be highlighting the best IPO’s every Monday.

::: Upcoming Economic Reports (3/17/08 – 3/21/08) :::

Monday:         Capacity Utilization, Industrial Production
Tuesday:       Fed Rate Decision, PPI, Building Permits, Housing Starts
Wednesday:  Crude Inventories
Thursday:      Initial Claims, Leading Indicators
Friday:            None

::: Earnings I’m Watching This Week :::

Monday:
Bear Stearns (BSC)

Wednesday:
China Mobile (CHL)

Fed Cuts Discount Rate, JP Morgan (JPM) Buys Bear Stearns (BSC) For 2 Bucks

This is the kind of news that will at least begin the process of a true bottom.  I’ve been talking about the cycle of greed and fear recently and the need for a big institution to go under.  Call it what you want but Bear Stearns being taken out for 2 bucks is a hair above bankruptcy.  I can’t imagine being a shareholder  in this.. directly or indirectly through a mutual fund.  You have a company trading at 55/share early Friday morning with a stock market value of nearly 7 billion.  JP Morgan (JPM) takes it out just 2 days later for 2/share just 2 days later, which values the company at a mere 236 million.  Amazing.

According to WSJ, JP Morgan is guaranteeing the trading obligations of Bear Stearns and its subsidiaries and is providing management oversight for its operations.  The WSJ also goes on to say that while some well known billionairre investors such as Joe Lewis and Bruce Sherman stand to lose a fortune, the hardest hit will be the rank and file Bear Stearn employees who hold a third of the shares in the company.  Enron anyone? 

Looks like the Fed is in the cutting move a bit early too.

After an initial surge, futures are down big.  S&P down 20, Dow down 142, Naz down 33.  It gets mighty interesting from here.

Bear Stearns (BSC) Bailout & Crash – Chart Worth a Thousand Words

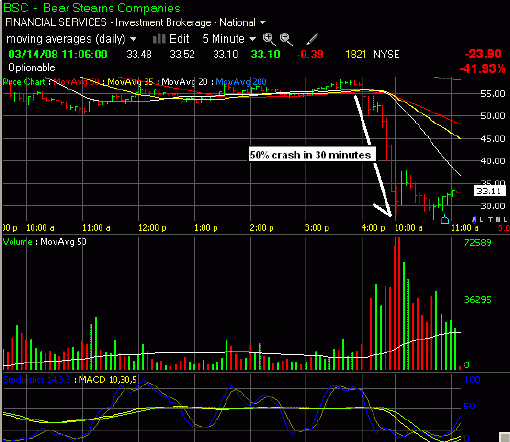
In my weekend report titled Where Are We in the Greed and Fear Cycle, I mentioned that this market would not mark a bottom until at least one major financial institution or homebuilder went under.  Well, this morning we came close in Bear Sterns.  Every attempt will be made by our government and better capitalized peers to help bail them out, but they can’t all be bailed out.  Some will have to fail and if this morning is any indication it will happen sooner rather than later. 

The chart of Bear Stearns (BSC) says it all.  Would you catch this falling knife?  Anyone short at the open?  What a trade that was!

chart courtesy of Telechart

Barry Ritholtz has an excellent ongoing update of this Bear Sterns bailout.

Note: I’ll be back posting more regularly next week.. been hard at work adding new features and products to SelfInvestors

Where Are We in the Greed and Fear Cycle?

In a sea of short term market volatility, it’s often difficult to see the big picture but we all need to remember that in the midst of manipulation, rumor, Fed speak and chat room BS there is just one constant that will never change.  Human emotion. .. specifically fear and greed.  We are reminded of this yet again as we cope with yet another boom bust cycle where lessons of the past are ignored and with near certainty a fresh round of CEO’s will be spending days at the crossbar hotel.

With greed comes pain, with pain comes blame and the blame game ends in fear.  Only then can we start discussing a true bottom to a market and I don’t think we’re there yet.  As the characters of this housing horror show defended their practices in front of congress last week (where was Greenspan?) it’s quite clear the blame game is in full motion.  The public always pays first and now it’s time for the government to make an example out of a few ill intentioned CEO’s.  It’s all playing out according to the script and I don’t think we’ve seen the end of  this mess until a few of the larger financial/home builder companies go under and a few recognized executives are indicted. 

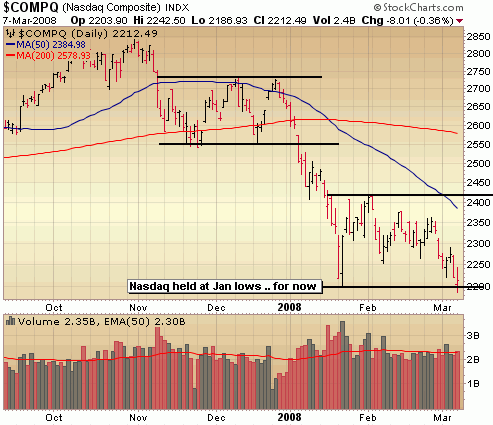
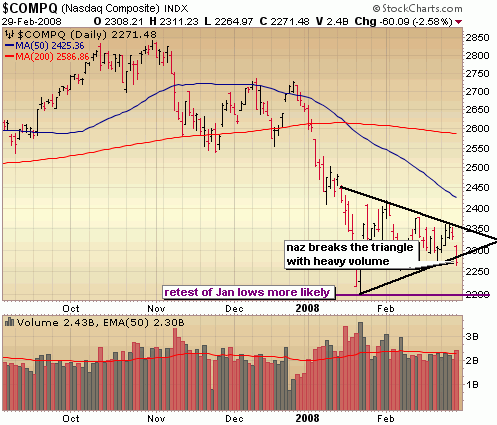
The technicals reveal that the market is currently at a critical point as they approach the January lows.  The Nasdaq actually tested this level on Friday but managed to close above this critical support level with a bit of a late day recovery.  All in all, not a bad day considering that poor jobs number but it was a day of distribution, so the Nasdaq is still very much in danger of taking out those January lows and closing below which would set it up for another leg down.


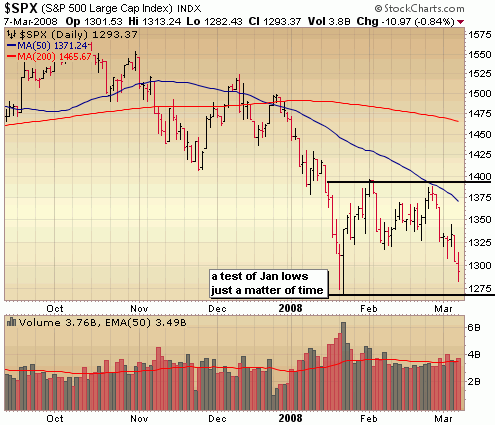
The S&P didn’t come all that close to the Jan lows on Friday but it appears to be just a matter of time before that level is tested.  It would be good to take out this level with some volume, followed a big round of institutional buying to help further flush out the weak hands and set this market up for a bull run.  However, as I mentioned above I think there is probably still some pain left in this market and it won’t happen that quickly.  It’s possible we get a weak bounce near those Jan lows before ultimately taking it out. 

The Dow looks like the S&P and needs to test the January lows as well.  Note the channel that’s shaping up. 

::: Model Portfolio :::

** This section will now appear as a separate report to be published every other Wednesday

The Self Investors Model Portolio wrapped up 2007 with a 30.2% gain.  Would you like to receive buy and sell alerts within minutes (NEW! now get them via instant messaging in near real time) of each transaction in the portfolio?  You can receive these along with ALL of the tracking tools and reports with the very popular Gold membership.  Don’t delay, get started today and join me for many more highly profitable months here at SelfInvestors.com.

::: Best/Worst Performers :::

– Top 10 Performing Industries For the Week –

1. Meat Products: 3.55%
2. Trucking: 1.95
%
3. Tobacco Products: 1.85%
4. Grocery Stores: 1.75%
5. Multimedia & Graphics Software: 1.70%
6. Gold: 1.10%
7. Air Delivery & Freight Service:  1.05%
8. Application Software: .80%
9. Broadcasting – Radio: .75%
10. Discount – Variety Stores: .75%

– Top 10 Worst Performing Industries For the Week –

1. Mortgage Investment: -20.35%
2. Processing Systems & Products: -11.45%
3. Consumer Services: -10.50%
4. Savings & Loans: -9.45
6. Catv Systems: -8.95%
7. Education & Training Services: -8.75%
8. Surety & Title Insurance: -8.45%
9. Rental & Leasing Services: -7.30%
10. Home Health Care: -7.25%

– Top 5 Best Performing ETFs For the Week –
 
1. US Natural Gas (UNG) 4.70%
2. US Oil Fund (USO)  4.10%
3. Powershares Commodities (DBC) 3.05%
4. Ishares Tawain (EWT) 2.40%
5. Ishares Silver (SLV) 1.90%

– Worst 5 Performing ETF’s –

1. Herzfeld Caribbean Basin (CUBA) -13.40%
2. iPath India (INP) -12.45%
3. 
India Fund (IFN) -10.80%
4. Morgan Stanley India Fund (IIF) -10.40%
5. iShares Home Construction (ITB
) -9.35%

:::  IPO’s Worth Watching for This Week :::

This section will now appear as a separate post on Mondays (if there are some interesting IPO’s coming to market).

While 2008 should be a much slower year for IPO’s considering the deterioration of the market, there will continue to be some good companies coming to market here and there.  I’ll be highlighting the best IPO’s every Monday.

::: Upcoming Economic Reports (3/10/2008– 3/14/2008) :::

Monday:         Wholesale Inventories
Tuesday:       Trade Balance
Wednesday:  Trade Budget, Crude Inventories
Thursday:      Import/Export Prices, Initial Claims, Retail Sales, Business Inventories
Friday:            CPI

::: Earnings I’m Watching This Week :::

Monday:
Bancolombia (CIB), China Security & Surveillance (CSR), Companhia Energetica (CIG), Gaiam (GAIA), Hovanian (HOV), LMI Aerospace (LMIA),

Tuesday:
Dicks Sporting Goods (DKS), DIVX Inc (DIVX), GigaMedia (GIGM), LSB Industries (LXU)

Wednesday:
Air Methods (AIRM), Flotek (FTK), Fushi Copperweld (FSIN), JA Solar (JASO), NGA Resources (NGAS), Sigma Designs (SIGM), T3 Energy Services (TTES), TBS Intl (TBSI), WuXi Pharma (WX)

Thursday:
Aeropostale (ARO), Akeena Solar (AKNS), Arena Resources (ARD), Comtech Group (COGO), Metalico (MEA), Pacific Sunwear (PSUN), Zumiez (ZUMZ)

Bears Make Defining Move, Retest of Lows More Likely

Last Friday’s action was a polar opposite of the previous Friday.  Last time around, there was Charlie Gasparino saving the day for the bulls, with the announcement of an imminent Ambac bailout.  A furious 30 minute rally saved the indices from breaking short term support levels, which would have created the likelihood of a retest of those January lows.  As it turns out, that move was just delayed by a week.  With a half hour to go on Friday and the indices breaking short term support levels once again (details in the charts below), you wondered if there was going to be yet another speculative rumor floated about that would save the day.  If not, then perhaps some good old fashioned plunge protection team buying to save the day.  Nothing.  This time around it was nowhere to be found, leaving the indices in a precarious situation with a retest of those January now very much likely in the coming days.  What a difference a week makes. 

Take a look at a chart of the Nasdaq and you notice that it has taken out support of a triangle formation with increasing sell volume on Friday.  If there is one bright spot to Friday’s move, it’s that sell volume wasn’t extreme, but you can’t help but believe that this sets us up for a retest of the January lows soon.

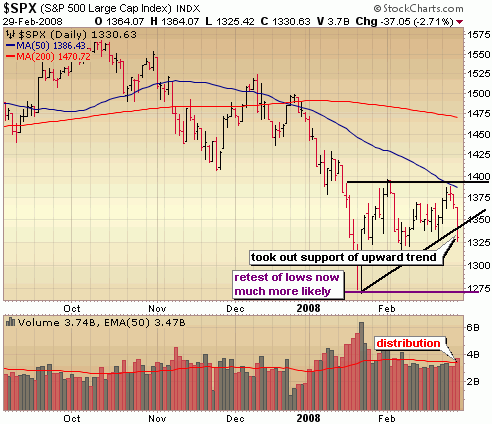
The S&P has also taken out support of the short upward trend off the big capitulation day a few weeks ago, setting up a likely move to test the January lows around 1275 in the coming days.

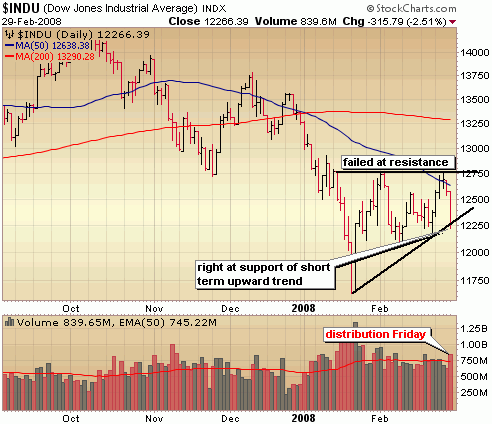
The Dow too, couldn’t quite bust through the next level of resistance around 12750, but hasn’t quite busted through short term support either.  However, given Friday’s momemtum to the downside, it appears to be just a matter of time.

Friday’s move was one of the most siginificant in since the capitulation in mid January and really puts the bears in control in the short term.  If you’ve captured some profits in recent days, it might be a good idea to lock it in and if you’re sitting on some losses don’t let them get out of hand.  Cut ’em quick and have a seat on the sidelines until the technical action improves.

::: Model Portfolio :::

** This section will now appear as a separate report to be published every other Wednesday

The Self Investors Model Portolio wrapped up 2007 with a 30.2% gain.  Would you like to receive buy and sell alerts within minutes (NEW! now get them via instant messaging in near real time) of each transaction in the portfolio?  You can receive these along with ALL of the tracking tools and reports with the very popular Gold membership.  Don’t delay, get started today and join me for many more highly profitable months here at SelfInvestors.com.

::: Best/Worst Performers :::

– Top 10 Performing Industries For the Week –

1.Silver: 9.25%
2. Toy & Hobby Stores: 6.40
%
3. Music & Video Stores: 6.25%
4. Computer Based Systems: 5.35%
5. Independent Oil & Gas: 4.25%
6. Gold: 3.30%
7. Consumer Services:  3.25%
8. Personal Computers: 3.20%
9. Computer Peripherals: 3.10%
10. Auto Parts Wholesale: 3.05%

– Top 10 Worst Performing Industries For the Week –

1. Dairy Products: -10.40%
2. Processing Systems & Products: -9.40%
3. Major Airlines: -9.35%
4. Sporting Goods Stores: -8.85
6. Banks – SE: -8.60%
7. Recreational Goods: -7.85%
8. Catalog & Mail Order Houses: -7.15%
9. Office Supplies: -6.35%
10. Banks – Mid Atlantic: -6.25%

– Top 5 Best Performing ETFs For the Week –
 
1. HLDRS Regional Bank (RKH) 6.38%
2. KBW Bank (KBE)  6.00%
3. US Broker Dealer (IAI) 7.40%
4. Ishares Brazil (EWZ) 7.30%
5. Market Vectors Gold Miners (GDX) 7.15%

– Worst 5 Performing ETF’s –

1. HLDRS Regional Bank (RKH) -6.40%
2. KBW Bank (KBE) -6.00%
3. 
iShares Broker/Dealer (IAI) -5.60%
4. HLDRS Internet (HHH) -5.10%
5. SPDR Financial (XLF
) -5.05%

:::  IPO’s Worth Watching for This Week :::

This section will now appear as a separate post on Mondays (if there are some interesting IPO’s coming to market).  It continues to be a very slow IPO market this year, but maybe Visa will help jump start it towards the end of this month.

While 2008 should be a much slower year for IPO’s considering the deterioration of the market, there will continue to be some good companies coming to market here and there.  I’ll be highlighting the best IPO’s every Monday.

::: Upcoming Economic Reports (3/3/2008– 3/7/2008) :::

Monday:         Construction Spending, ISM Index
Tuesday:       Auto/Truck Sales
Wednesday:  ADP Employment, Productivity, Factory Orders, ISM Services, Crude Inventories, Fed’s Beige Book
Thursday:      Pending Home Sales, Initial Claims
Friday:            Nonfarm Payrolls, Unemployment Rate

::: Earnings I’m Watching This Week :::

Monday:
51Jobs (JOBS), Home Inns & Hotels Management (HMIN)

Tuesday:
Balchem (BCPC), Gafisa (GFA), Perficient (PRFT), Simcere Pharmaceutical Group (SCR), Sun Hydraulics (SNHY), Trina Solar (TSL)

Wednesday:
Canadian Solar (CSIQ), Comtech Telecommunications (CMTL), Costco (COST), DXP Enterprises (DXPE), Fuel Tech (FTEK), Gasco Energy (GSX), Mindray Medical (MR), Smith Micro Software (SMSI), Union Drilling (UDRL)

Thursday:
American Oriental (AOB), Copart (CPRT), Daystar Technologies (DSTI), Dynamic Materials (BOOM), Sun Healthcare Group (SUNH), Urban Outfitters (URBN)

Friday:
Veolia Environment (VE)

::: In Case You Missed It – SelfInvestors Blog Entries of the Past Week :::

1. Despite Inflation Data & Google, Market Breaks Out But Volume A Concern

2. Losses Mount, Stock Rises in Fannie Mae (FNM) & Toll Brothers (TOL)

Losses Mount, Stock Rises in Fannie Mae (FNM) & Toll Brothers (TOL)

 I’m going to begin doing something a bit different for the earnings posts and instead of just highlighting the Self Investors Leading stocks that are moving with volume, I’m going to highlight companies that beat estimates and guided higher (or just beat by a wide margin) and companies that missed estimates and guided lower (or just missed by a wide margin).  Companies that are Self Investors Leading Stocks (ie. great fundamentals and above 200 day moving average) will be marked with (SLS) and will include the Self Investors fundamental rank in brackets.  It’s a score out of 30 and includes earnings/sales growth, ROE, profit margins, management ownership and debt levels.

Beat Estimates and Guided Higher Or Beat By Wide Margin

• LKQ Corp (LKQX) Auto Parts Wholesale, fundamental rank [26/30],  up 19%, carving out right side of new base (SLS)

• Interstate Hotels & Resorts (IHR) Lodging,  up 14%, breaking a deep, long downtrend

• Papa John’s Pizza (PZZA) Restaurants, up 11%, trying to begin carving out a new big base, has wheat and cheese inflation been priced in already?  It appears so!

• Warnaco Group (WRNC) Apparel – Clothing, up 9%, a new base begins

• Clean Harbors (CLHB) Waste Managements, up 9%, breaking out to all time highs today

• Masimo (MASI) Medical Appliances & Equipment, up 6%, look like the beginnings of a new base

• Dreamworks (DWA) Movie Production, up 4%, emerging from steep correction

• Stone Energy (SGY) Independent Oil & Gas, up 3%, adding to gains from recent breakout

• Herbal Life (HLF) Drugs Wholesale, fundamental rank [25], up 2%, still working on right side of a base (SLS)

• Sina.com (SINA) Internet Info Provider, down 4%, still below resistance of moving averages, trying to find a bottom

Missed Estimates & Guided Lower or Missed by Wide Margin

• Carters (CRI) Apparel – Clothing, down 23%, on its way to support around 15 at the very least

• Dycom Industries (DY) Heavy Construction, down 13%, this one died long before missing estimates on earnings

• Dresser Rand (DRC) Diversified Machinery, down 5%, still confined within a downtrend and actually looking like a decent short

• Toll Brothers (TOL)  Residential Construction, up 4%, missed estimates but rises anyway.. yet another signal of bottoming action

• Fannie Mae (FNM)  Mortgage Investment, up 3%, missed by wide margin with big losses mounting, yet the stock rises – you guessed it.. most of the bad news has already been built in.

Despite Inflation Data & Google, Market Breaks Out But Volume A Concern

When a market shifts from one of topping to bottom seeking, you begin to notice a shift in reaction to the news.  At tops, it seems the market shrugs good news aside and looks for an excuse to sell.  That’s because most of the good news has been built into the price already.  Near the bottom, you see the market begin to ignore some of the bad news and begin rallying on any glimmer of hope.  We have been seeing this in the homebuilders for a couple of months now, which is why I had been writing about a bottom in that space long before the talking heads jumped on board.  The market looks well into the future and prices those events in.  That’s why you see the stocks rise long before you begin to see the housing data improve.  I still get a kick out of the few emails reminding me that the homebuilders are doomed for many years and that there is no way this is a bottom.  Well, it’s nothing more than opinion.  The charts of the homebuilders and the reaction to their awful earnings reports were telling something quite different. 

The same thing happens in the overall market as well.  I alluded to this change of character a bit to my members in an email last night, saying:

"We kind of picked up where we left off on Friday to some degree.  A relatively flat day gave way to a wave of buying in the latter half of the day on yet more bond insurer happenings.  Where as Friday’s move was based more on speculation, today’s move was based on the lack of a downgrade from Standard & Poors in credit ratings on both Ambac and MBIA (although Ambac remains on credit watch).  It appeared the market was just looking for another excuse to rally which is a positive sign for bulls.  Remember that at market bottoms, the market begins to shrug bad news aside and rally on any glimmer of hope.  That’s what we saw today.  It led to a break out from those wedge formations in both the Dow and S&P which provides a bullish outlook for the market in the short term, but let’s not forget that we have big economic data pouring in over the next few days.  Today was a good start, but how the market reacts over the next few days will be critical and getting aggressive on the long side here doesn’t make much sense considering the economic news of late has not been good.  Great caution is still the best approach at this time."

The bad news continued to flow out of the gates this morning.  The producer price index at double the estimates and a Google sell off would have easily derailed this market just a few short weeks ago.  Instead, the market chose to look at the IBM buy back and the comments from Fed Vice Chairman Donald Kohn, saying that he doesn’t expect elevated inflation rates.  to continue.  Of course that’s quite the opposite of what Dallas Fed President Fisher said just a few hours later!  He said, "I’m more concerned about inflation than I have been of late. It’s a growing concern. We see it particularly in commodities and energy products."  You think?

Look at the retailers today.  If you had told me a few weeks ago that retailers would get big institutional buying and big breakouts, I’d probably have said you were crazy.  Weakening economy, rising inflation, housing problems.. yet retailers are rocking.  Just look at Urban Outfitters (URBN) and Buckle (BKE).  Both broke out big today and are great examples of basing buys and sells on the charts which are the best leading indicators around.  How about Home Depot?  Missed estimates and warned about declining earnings.  Stock was down big right?  Nope.  It ended flat.  If that’s not a signal that a bottom is being put in on Home Depot, I don’t know what is.  Pay attention to price and volume, particularly surrounding a news event.  It’s all you’ll ever need.

There’s no question the character of this market is beginning to change to the bullish side of the coin, but as far as I’m concerned this is still a bear market and it still pays to be careful.  That means initiating smaller positions than you normally would, not chasing stocks and cutting losses quickly.  The indices have broken out of the wedge formations I’ve been discussing here, but keep in mind there are big overhead resistance areas all over the place.  Let’s have a look.

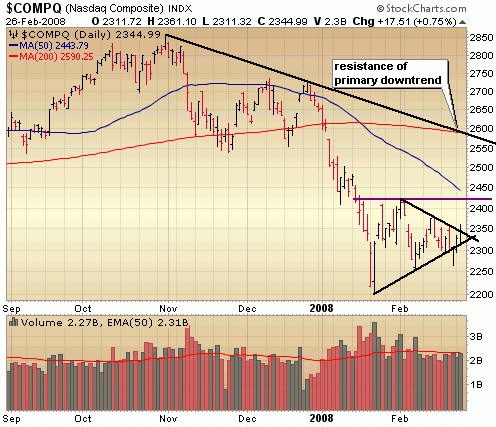
The Nasdaq actually just closed a hair above that wedge formation today and continues to lag the rest of the market.  Take out Google and you might have a different story.  At any rate it does look poised to at least test those January highs soon around 2425 as long as it holds above today’s lows, which marks the area around the bottom of the wedge formation.  The amount of buy volume over the past few days has been a bit of a concern.  You want to see institutions jumping in with both feet, but they aren’t doing that just yet which is why I remain cautious.

nasdaq

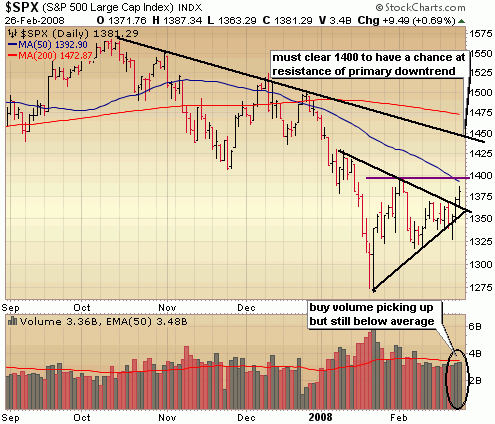
The S&P has cleared that wedge formation but again, volume is somewhat lacking indicating a lack of momentum.  It’s going to be tough to push through that resistance around 1400 without institutional help. 

s&p500

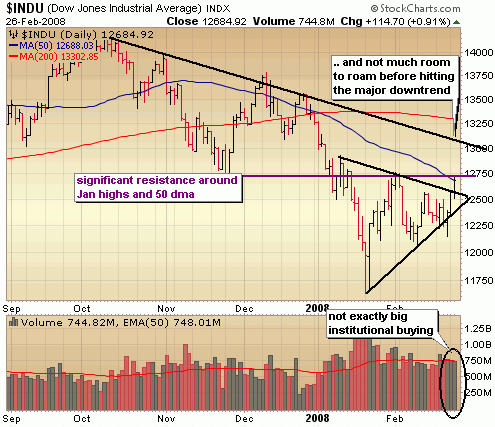
The Dow busted through the wedge AND hit resistance at the Jan highs today before pulling back a bit.  Not much conviction behind the moves of the past 3 days.  Notice that even if it does bust through the Jan highs, big resistance of the primary downtrend is not far ahead.

I like the reaction to the news of late and it does appear the character of the market is improving some, but it doesn’t make sense to get aggressive right here.  Any light volume pull backs would offer chances to get into companies with superior fundamentals and technicals, but putting on smaller positions until more leadership and institutional buying emerges is probably the best bet.


::: Major Indices Performance – The Numbers :::

(Note: volume averages are based on the average over the past 50 days)
Data as of 4:00EST – End of Day February 26th 2008

Nasdaq: UP .75% today with volume right around average
Nasdaq ETF (QQQQ) .39%, volume 15% BELOW average
Dow: UP .91%, with volume 1% BELOW the average
Dow ETF (DIA): UP .99%, with volume 17% BELOW the average
S&P ETF (SPY): UP .75%,  with volume 9% BELOW the average
Russell Small Cap ETF (IWM): UP .93%, with volume 5% BELOW the average

::: SelflInvestors Leading Stocks :::

The Self Investors Leading Stocks Index is comprised of stocks in the Breakout Tracker, which is a database of the fastest growing companies near a breakout or having already broken out of a base.  Leading stocks actually performed better than of all the major indices, which was encouraging.

Summary:

* Advancers led Decliners 161 to 75
* Advancers were up an average of 2.63% today, with volume 13% ABOVE average
* Decliners were down an average of 1.37% with volume 16% ABOVE the average
* The total SI Leading Stocks Index was UP 1.18% today with volume 14% ABOVE average

::: Where’s the Money Flowing :::

Many investing websites provide leading industries based on price performance alone. However, without accompanying volume levels, this can sometimes be misleading.  The only way that I know of to gauge industry/sector strength WITH volume levels is through the analysis of ETF’s.  A couple years ago this was not possible, but as more traders/investors use ETF’s they become a much better tool for gauging the health of the market and seeing where the money is flowing (or not flowing).  Using the proprietary SelfInvestors Demand Indicator score which measures price and volume movements, I’m able to quickly see which sectors/industries are seeing the greatest inflows of cash.  For a detailed look at how I go about gauging sector/industry strength please see the following post: http://selfinvestors.com/si/industry_tracking/

* Current Leading Sectors/Industries (over last 30 trading days):  
Coal, Agriculture, Natural Resources, Commodities, Biotech and Oil
                                          
* Current Lagging Sectors/Industries (over last 30 trading days): 
Health Care Providers, Utilities, Telecom, Aerospace/Defense, Broker/Dealers

* Today’s Market Moving Industries/Sectors (UP):
Home Construction, Home Builders, Retail, Commodities, Gold Miners

* Today’s Market Moving Industries/Sectors (DOWN):
Internet, Coal

::: Stocks :::

The stocks section will be an area where I highlight one stock selected from a group of stocks moving up with volume well above average and most likely breaking out of a base or consolidation.  I’m running short on time tonight, so won’t have a stock of the day tonight, but have a look at these Self Investors Leading Stocks that moved up with volume today and are above both the 50 and 200 day moving averages.  They are listed in order of Fundamental Rank. 

If you’d like, you can get access to my entire database of leading stocks (which includes great filters) with just a Silver Membership!

Ctrip.com (CTRP)
Mechel (MTL)
Natural Gas Services (NGS)
Meridian Bioscience (VIVO)
Website Pros (WSPI)
FCStone (FCSX)
Somanetics (SMTS)
Axsys Technologies (AXYS)
Greif (GEF)
Chindex International (CHDX)
Carrizo Oil & Gas (CRZO)