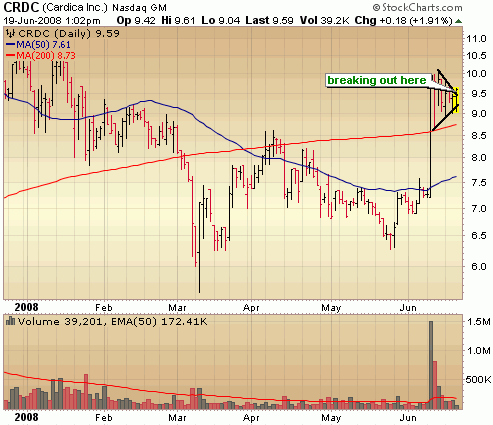
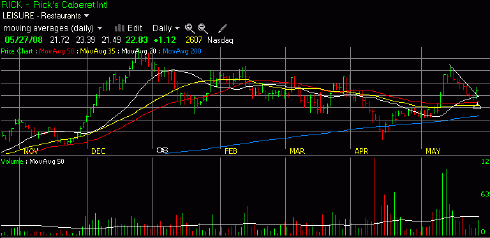
Last year I traded CRDC for a quick 45% profit and I believe it may be offering such an opportunity here again as it attempts a breakout from a bullish triangle formation. This is a highly volatile, speculative swing trade so play accordingly and please do your own research.
All posts by Tate Dwinnell
Gold & Silver Breaking Out?: Leverage with Double Long Gold ETN (DGP)
The following is analysis provided by TheCorrectCall.com exclusive to readers of SelfInvestors. I completely agree with this analysis. Breaking of bullish wedge formations/downtrends are taking place in the Gold & Silver ETFs. Great post!
:::::::::::::::::::::::::
In our daily screens of stock charts exhibiting positive and negative MACD crossovers, The Correct Call recognized a trend too large to ignore. Our heads turned when we saw at least 25% of the upside candidates were Gold/Silver stocks and ETFs. As we have noted many times before, we are big believers in confirmation. When we see a disproportionate number of companies in the same sector all presenting the same "buy signal", we feel it is safe to say something is happening.
In these turbulent times it nice to find some water in the desert.
Investors worried about mounting losses can possibly stem the tide by adding Gold to their portfolio. According to a study titled "Is Gold a Hedge or a Safe Haven? An Analysis of Stocks, Bonds and Gold" by Dirk G. Baur and Brian M. Lucey, gold is an "ideal venue to park money during periods of uncertainty." Their analysis found that in the US, Gold and stock returns are negatively correlated and that Gold acts as a hedge at all times. That means when stocks go down, Gold usually goes up.
That’s good news for investors.
All of the Gold/Silver stock & ETF charts we reviewed look this iShares COMEX Gold Trust (IAU). Each has roughly a 6 week narrow trading range with yesterday’s MACD breakout.
Conservative investors should buy IAU, streetTRACKS Gold Trust (GLD) or iShares Silver Trust (SLV).
More aggressive investors might consider owning individual stocks or DB Gold Double Long ETN (DGP). DGP’s objective is to give its owners twice the return of Gold’s price changes. That means if Gold moves up 5%, investors can expect see a return of 10%.
The precious metal stocks with charts pointing the way up include:
- Barrick Gold Corp. (ABX) Apollo Gold Corp. (AGT) Pan American Silver Corp. (PAAS)
If we have made The Correct Call, we would expect investors to profit by 10% or more in the next 3-to-6 months owning Gold/Silver stocks and ETFs. (double that for DGP.)
Due for a Rally, But Bears Still In Control
I’m gonna keep it real short this week and stick to the meat and potatoes of the technicals. After all, it is Father’s Day and the US Open is winding down.. :) Hope you’re all enjoying a little BBQ. The market continued to deteriorate last week with distribution still going on, but this market is due for some kind of short term oversold bounce as indicated by stochastics. Of course no indicator is perfect by itself and stochastics can remain in oversold territory for quite awhile, but the odds are there for a bit of a spike next week. However, bears are still in control and outside of some short term trading opportunities on the long side, it’s probably best for most people to sit on the sidelines for a bit longer. Keep an eye out for a rally in the indices to test resistance levels (Nasdaq – 200dma, Dow and S&P – 50 day moving averages).
::: Model Portfolio :::
** This section will now appear as a separate report about every other Wednesday.
The Self Investors Model Portolio wrapped up 2007 with a 30.2% gain and features annualized returns of 24%. This is a REAL portfolio with position sizing and NOT the "hypothetical" portfolios you see with many stock trading services.
Would you like to receive buy and sell alerts within minutes (NEW! now get them via instant messaging in near real time) of each transaction in the portfolio? You can receive these along with ALL of the tracking tools and video reports with the very popular Gold membership. Don’t delay, get started today and join me for many more highly profitable months here at SelfInvestors.com.
::: Best/Worst Performers :::
– Top 10 Performing Industries For the Week –
1. Investment Brokerage: 5.35%
2. Major Airlines: 4.45%
3. Regional Airlines: 4.35%
4. Home Improvement Stores: 3.95%
5. Investment Brokerage: 3.90%
6. Appliances: 3.80%
7. Electronic Stores: 3.80%
8. Education & Training Services: 3.75%
9. Machine Tools & Accessories: 3.75%
10. Security Software & Services: 3.70%
– Top 10 Worst Performing Industries For the Week –
1. Beverages – Soft Drinks: -4.75%
2. Banks – Midwest: -1.75%
3. Farm Products: -1.55%
4. Banks – SE: -1.50%
5. Meat Products: -1.40%
6. Medical Practitioners: -1.35%
7. Beverages- Brewers: -.95%
8. Banks – Pacific: -.85%
9. Banks – Mid Atlantic: -.85%
10. Cigarettes: -.60%
– Top 5 Best Performing ETFs For the Week –
1. Ishares Broker/Dealers (IAI) 5.70%
2. Japan Small Cap (JOF) 5.60%
3. SPDR Metals & Mining (XME) 3.70%
4. Ishares Home Construction (ITB) 3.35%
5. HLDRS Semis (SMH) 3.30%
– Worst 5 Performing ETF’s –
1. KBW Banking (KRE) -1.90%
2. US Oil Fund (USO) -1.90%
3. Asa Limited Gold (ASA) -1.70%
4. US Natural Gas (UNG) -1.30%
5. iShares Commodities (GSG) -1.20%
::: Upcoming Economic Reports (6/16/2008- 6/20/2008) :::
Monday: NY Empire State Index, Net Foreign Purchases
Tuesday: Building Permits, PPI, Housing Starts, Capacity Utilization, Industrial Production
Wednesday: Crude Inventories
Thursday: Initial Claims, Leading Indicators, Philly Fed
Friday: None
::: Earnings I’m Watching This Week :::
Monday:
Adobe Systems (ADBE), Lehman Bros (LEH), Titan Machinery (TITN)
Tuesday:
Goldman Sachs (GS)
Wednesday:
Casella Waste Systems (CWST), FedEx (FDX), Lindsay Corp (LNN)
Stock Market Sets Up for Further Declines; Garmin (GRMN) Still Shortable?
The following analysis is provided exclusively to readers of SelfInvestors via TheCorrectCall. Enjoy!
:::::::::
Yesterday’s selloff moved the Dow below a fairly major level of support at 12,200. In all likelihood, this violation will lead to more selling in the days ahead. The technical picture sets up almost too perfectly. According to what we see, the next stop is in the vicinity of the March 14th & 17th closing prices of 11,951-11,972.
From there, if our analysis holds to form, the next leg would follow along the angle of decent to converge at the end of the "T" formation; meaning a visit to the March 10 closing low of 11,740 sometime near the end of June-early July.
As you can see on the chart, this all looks too straightforward:
A stock that appears to be shortable during this downturn is Garmin, Ltd. (GRMN) which manufactures global positioning system (GPS)-enabled products and other related navigation, communications, and information products worldwide. It operates in four areas: Automotive/Mobile, Outdoor/Fitness, Marine, and Aviation.
The stock was one of Wall Street’s darlings for several years until it made a major top in late-2007. Since then GRMN has been a disaster and is off about 60% from its highs. Unfortunately for shareholders, the tough times could continue for quite some time.
There is brutal competition in the industry from the likes of TomTom and Navteq just to name a couple. Recently, Apple showed off navigation features on its iPhone, which lopped a few dollars off of GRMN’s stock due to competition fears. These fears might intensify as there is a lot of consolidation going on in the industry.
In late-April, the company said that earnings per share came in at 67 cents, below the consensus estimate of 75 cents. Revenues were also light by about $40 million. It is still up in the air as to whether or not this will be a trend, but most companies that miss like this tend to take longer than a quarter to turn it around.
Over the past two months, this year’s earnings estimates have fallen 48 cents to $3.94 per share. Analysts are only expecting single-digit growth for next year as well. The stock is not particularly expensive, but the momentum in both earnings and stock price point to lower prices in the near future. We see the stock testing its 52-low of $39.75 in the next few months.
2 Swing Trade Stock Ideas – Medifast (MED) & Netezza (NZ)
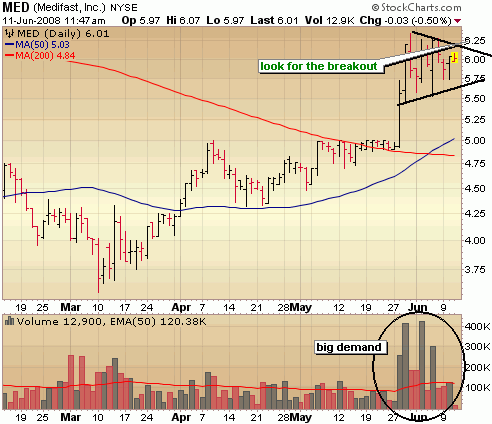
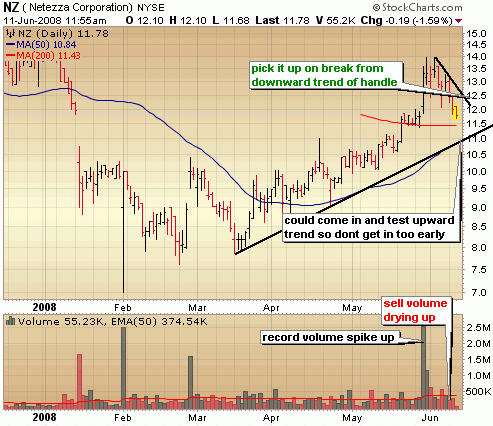
For you brave souls looking for a little momentum on the long side, I’ve unearthed a couple plays to put on the radar – Medifast (MED) & Netezza (NZ). I have no idea what these companies do and no idea what the fundamentals are and I don’t care… because they are momentum swing trades meant to be held for a few days up to a couple weeks. Nothing more.
Remember though, we are still in correction mode with the possibility of further declines. Do your own research please and consider smaller positions with tight stops.
MED is carving out a bullish triangle formation – I’m setting an alert above 6.15 and may trade the breakout from this pattern.
NZ is digesting a big ramp up with record volume and based on the dry up in sell volume may get ready to run again soon. I’m looking for a breakout from the downward trends as entry signal. I think it will settle out around 11.50 before ramping up again.
Disclaimer: I own no position in either.
Wind Energy ETF’s Are Coming
 Both PowerShares and First Trust Advisors have filed docs with the SEC to provide Wind Energy ETFs. The PowerShares Global Wind Energy ETF requires a minimum market cap of 200 million and will likely include some or all of the big wind players such as Vestas Wind Systems (Denmark), Clipper Steam Turbine (China), Gas Turbine Efficiency (Sweden), Gamesa Corp Technologica (Spain), Windflow Technology (New Zealand) or Wind Energy America of Eden (US). Get your free PowerShares Global Wind Energy ETF (PWND) analysis here
The First Trust ISE Global Wind Energy ETF will be made up of 2/3 pure plays and 1/3 of companies with a portion of their sales from wind and include companies of all sizes. Get your free First Trust Wind Energy ETF (FAN) analysis here
Countries with the most installed capacity of wind power include Germany, US, Spain, India and China with China leading the growth by tripling its capacity in 2007 over 2006. Some expect China to be the leader in wind power generation in just a few years.
Currently, the best way to play wind with a diversified strategy is through the Market Vectors Global Alternative Energy ETF (GEX) which lists Vestas Wind Systems (Denmark) as it’s largest holding at just under 13% of the fund. You can get a free analysis of this fund too.
Map of World Oil Reserves
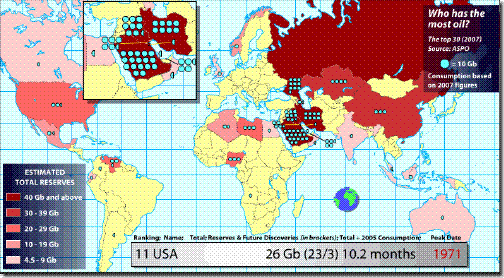
In doing some research for an oil trade article, I came across a darn good map of world oil reserves that’s based in flash and interactive so you can see which countries have the most in reserve and which are the largest consumers. No surprise in terms of consumption – the US and China are runaway leaders here. However, I was surprised that India wasn’t a bigger consumer of oil..but then again, they haven’t really reached the industrialized stage that China has, but when they do… perhaps at some point down the road $200 oil isn’t so far fetched. The most glaring thing that stands out to me though is the potential dominance that Russia may play in the oil game. They are undoubtedly sitting on billions upon billions of gallons of oil which is why I really like that Market Vectors Russia ETF (RSX) for the long haul. In the shorter term though, I actually like oil as a short and will highlight a couple ways to trade it tomorrow.
Check Out Our New Oil ETF Portal
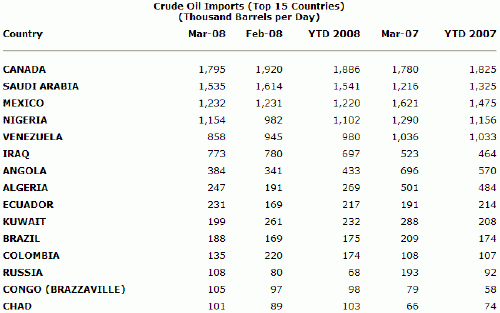
We import the most from Canada. Notice the increase in imports from Iraq and the decrease from Venezuela.. not too surprising.
Resource: Energy Information Administration
Nasdaq, a Double Top in the Making; Bears Firmly in Control
In any market, there will be differences of opinion but certainly at market tops and bottoms, the predictions become more bold. I was reading a few articles over at Seeking Alpha and came across one guy (who manages money for a living by the way) exclaiming that Thursday’s move was huge! He was as bullish as could be just as many of the so called professionals on CNBC have been. There is nothing wrong with having an opinion and the courage of your convictions, but where is the "money management"? Where is the preservation of capital? I don’t have the all answers but one thing I do have is a sense of when it’s time to ease up and err on the side of caution. I realize there is incentive for Wall St to keep their clients invested, so you won’t hear the call to move to cash very often, but at the same time they fail to realize how just a little bit of integrity can go a long way.
My approach is that the bulls are going to have to prove me wrong every time. After all, down is the path of least resistance. When the overall market takes out major long term trends lines in the first few months of the year, carves out a bear market rally and hits key resistance in the process, you damn well better believe I’m going to be cautious and recommend moving to cash or hedging your bets until the bulls can prove themselves. It’s been the theme of late here at SelfInvestors and that didn’t change last week.
On Monday, I sent the following to members:
(you may receive my "almost" nightly market notes by registering at the top left)
Be in Cash or Be Hedged
"It had been relatively quiet in the financials ever since the Bear
Stearns debacle and the capitulation surrounding that certainly
created a bottoming process and paved the way for a run in the
indices which is where we sit now. However, the magnitude of the
problems in housing and in skyrocketing oil prices don’t get sorted
out in a few months time. Sure, you could argue that the economic
numbers haven’t been all that bad and the trend of weak, but better
than expected economic numbers certainly does continue. Today the
ISM Manufacturing Index came in a bit weak and continued to indicate
some contraction, but came in better than expected and higher than
the previous month at 49.6. BUT, how long can it last? The US
economy is incredibly resilient as it proved after the tech bust and
Septemeber 11 attack but how much can it bend without breaking? That
certainly remains to be seen and all predications are just
..predictions. One thing is for certain though. The indices are
indicating intermediate topping action following this healthy spring
rally. As I mentioned in my weekend report, why not lock in some of
that hard earned profit and sit tight for a couple weeks and let the
economic data flow and the indices give us a better indication of
where it’s headed next?
On the technical side of things, the action in the indices could have
been far worse than where we closed. Down 200 in the Dow at one
point, you got the feeling that maybe we’d get one of those big 300
– 400 point swoons.. something we haven’t seen in some time.
However, I was impressed by the way the market held it together and
staged a little rally at the end of the day. Volume was not heavy
today and indicated fairly healthy profit taking following last week’s
advance. The Nasdaq took out support of the 200 day moving average
again, but the S&P was able to hold above the 50 day moving average..
a somewhat remarkable feat considering the financial headlines today.
If you’re able to keep fairly close tabs on the market each day,
there are some good trading opportunities out there on the long side
but I recommend hedging those with some short plays or simply buying
put options. If you don’t have time to watch this market closely
right now, are an inexperienced trader and/or are accustomed to
longer hold times, I feel the best strategy is to sit on the
sidelines for a couple weeks to see how this pull back shakes out."
The following day, the selling was more severe and the following was sent to members:
Dow and S&P Have April Lows in Sight
"Today’s technical action was significantly more severe than
yesterday as sell volume came in above average indicating
institutional distribution. It sets us up for further deterioration
in the coming days. The S&P finally penetrated that 50 day moving
average which could be preparation for a move down to the April lows
at 1325. The Nasdaq remains submerged below the 200 day moving
average and in all likelihood will test the 50 day moving average
around 2400. The Dow is having the most difficulty and has taken out
both key support levels of the moving averages and will most likely
test the April lows in the 12200 range in the coming days."
Then we got that out of blue move on Thursday, pushing the Nasdaq right to the brink of a potential breakout move. There was some momentum behind it so I had to respect it to some degree, but still wary of a potential double top in the Nasdaq given the bearish signals of the previous days. I sent the following to members Thursday night:
Nasdaq Within Striking Distance
"I have to admit, today’s move took me completely by surprise and the
action kind of reminded me of the irrational trading in the latter
half of 07 when it seemed the technicals didn’t matter much.
Earlier this week, we got significant distribution as the indices
slid further from important resistance areas. The Dow looked down
right ugly. Then bammo! A nearly 2% surge in the indices with a
little momentum behind it as the market seemed to ignore the
financial turmoil (a cut in ratings for Ambac & MBIA) that it had
sold off on just earlier in the week. The trend of "better than
expected" economic numbers continued today with a decline in weekly
jobless claims and decent May retail numbers which some expect to be
strong again in June due to the stimulus of rebate checks. Rather
than hurting the market today, a $5 surge in crude ignited the market
with energy leading the way with a more than 4% advance.
So where does it leave us? You know I’ve been mentioning that it’s
best to be cautious up here and I still think that is the best
strategy until proven otherwise. While this one day of trading does
negate some of the bearishness in the technicals recently, it
doesn’t signal that the coast is clear. It’s still just one day of
trading likely fueled in large part by short covering. I said that
if I was wrong and the indices broke out to new all time highs, than
I’d simply adjust my strategy and get more aggressive long. With
today’s surge, the Nasdaq is sitting right on the May high which is
a significant source of resistance. The S&P reclaimed support of the
50 day moving average and it just may hold that level. As for the
Dow, it’s got significant technical damage to repair and today’s move was
a good start towards that. For me to get increasingly long, I want
to see the Nasdaq take out that May high and close above it, then
pull back in an orderly fashion. When the Dow re-tested its May high
on May 19th , it quickly sold off 700 points in a couple weeks so we
have to be mindful of a double top in the Nasdaq as well. "
The Nasdaq wouldn’t come close to a breakout attempt on Friday as the unemployment rate spiked higher than expectations and crude soaring yet again to record highs with $150/barrel in sight. The big surprise to me on Friday? That the average work week came in at 33.7.. who the heck works less than 40 hrs anymore? The action on Friday as downright ugly with institutions clearly dumping large positions. Let’s take a look at the major indices below.
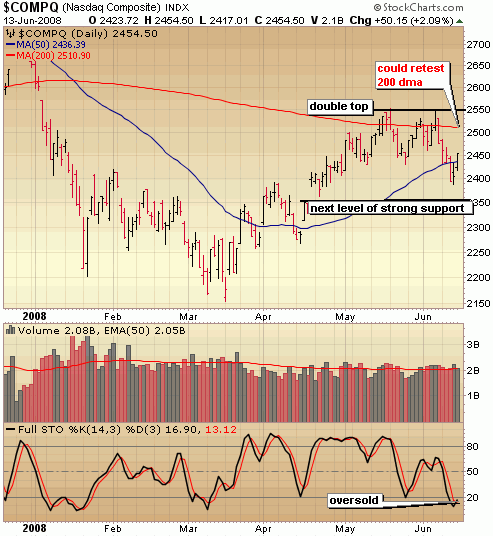
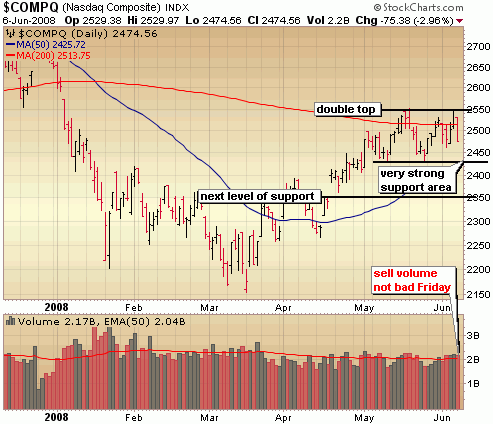
The Nasdaq is without a doubt leading the way and is actually in relatively decent shape up here, but I still think it needs to come back and test where the May lows and 50 day moving average converge around 2425. It wouldn’t mind seeing it bounce around in this range for another month or two, setting it up for a breakout attempt above 2550. Volume was not particularly intense on Friday which is encouraging. Note the double top in the making at 2550.
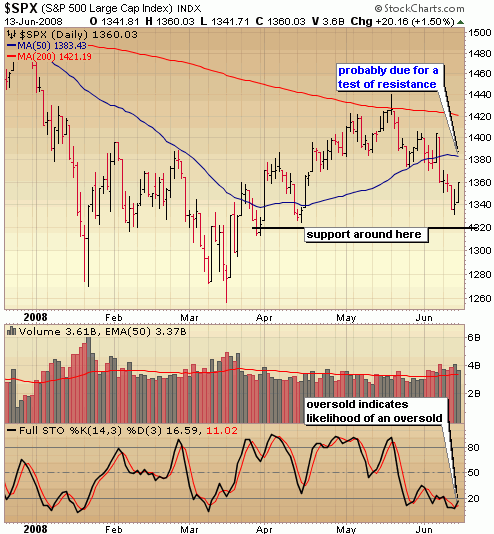
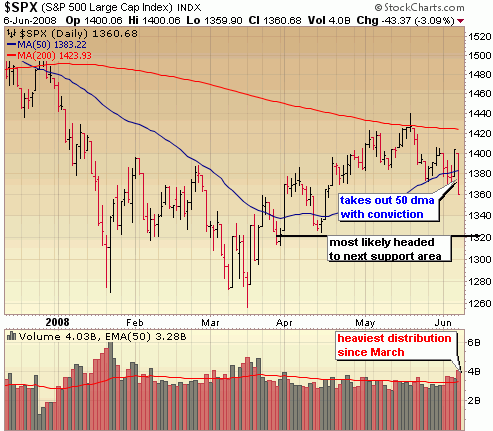
It’s a much different story in the S&P, which took out the June and May lows (and the 50 dma yet again) with big time conviction. We could certainly see a bit of a bounce to come back and test what is now resistance of the 50 dma before testing the next level of support around 1320, but I wouldn’t bet on it.
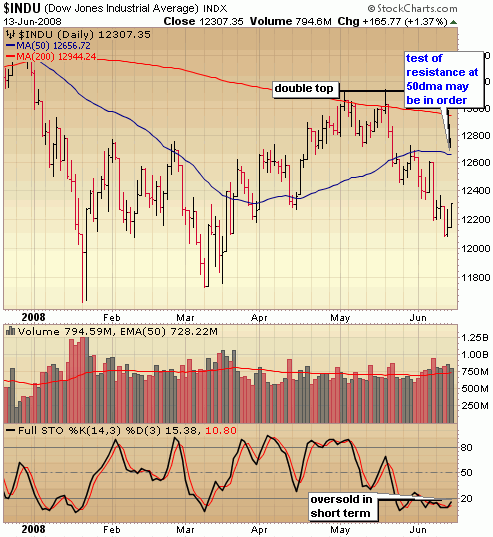
It gets even uglier in the Dow which has been sliding for weeks now, following a double top of its own up around 13200. It’s sitting on some minor support area right now but given the fact it was down 400 on Friday with absolutely no buy interest throughout the day, it is just a matter of time before it starts trading down around those March lows.
::: Model Portfolio :::
** This section will now appear as a separate report about every other Wednesday.
The Self Investors Model Portolio wrapped up 2007 with a 30.2% gain and features annualized returns of 24%. Would you like to receive buy and sell alerts within minutes (NEW! now get them via instant messaging in near real time) of each transaction in the portfolio? You can receive these along with ALL of the tracking tools and reports with the very popular Gold membership. Don’t delay, get started today and join me for many more highly profitable months here at SelfInvestors.com.
::: Best/Worst Performers :::
– Top 10 Performing Industries For the Week –
1. Agricultural Chemicals: 6.05%
2. Music & Video Stores: 3.60%
3. Healthcare Info: 2.90%
4. Independent Oil & Gas: 2.75%
5. Regional Airlines: 2.40%
6. Electronics Wholesale: 2.10%
7. Long Distance Carriers: 1.80%
8. Oil & Gas Equipment & Services: 1.50%
9. Wholesale – Other: 1.45%
10. Printed Circuit Boards: 1.40%
– Top 10 Worst Performing Industries For the Week –
1. Meat Productss: -10.60%
2. Banks – SE: -10.50%
3. Surety & Title Insurance: -10.10%
4. Advertising Agencies: -9.40%
5. Aerospace/Defense: -9.10%
6. Residential Construction: -8.50%
7. Auto Parts Wholesale: -7.90%
8. Banks – MidAtlantic: -7.75%
9. Jewelry Stores: -7.30%
10. Foreign Regional Banks: -7.20%
– Top 5 Best Performing ETFs For the Week –
1. Greater China Fund (GCH) 5.70%
2. Turkish Invest (TKF) 5.60%
3. HLDRS Internet Architecture (IAH) 5.40%
4. Japan Small Cap (JOF) 5.20%
5. HLDRS Broadband (BDH) 4.65%
– Worst 5 Performing ETF’s –
1. iShares Silver (SLV) -6.25%
2. Thai Fund (TTf) -6.15%
3. Asa Limited Gold (ASA) -4.60%
4. Market Vectors Gold Miners (GDX) -4.50%
5. iShares Gold (IAU) -3.90%
::: Upcoming Economic Reports (6/9/2008- 6/13/2008) :::
Monday: Pending Home Sales
Tuesday: Trade Balance
Wednesday: Fed Beige Book, Treasury Budget, Crude Inventories
Thursday: Export/Import Prices, Initial Claims, Retail Sales, Business Inventories
Friday: CPI
::: Earnings I’m Watching This Week :::
Monday:
Exide (XIDE)
Tuesday:
Quality Systems (QSII)
Thursday:
China Medical Technologies (CMED)
A Stock Trade Ideas Video: Solars (TAN), Clean Energy (PBW), Water (PIO) & More
Every week, I do a video presentation for my premium members highlighting new trade ideas or discussing current positions in the Model Portfolio. I thought tonight I’d share the video with my blog readers. Some of the ideas are past decent entry points, while others may still provide decent entry points. More importantly, there are some good chart reading lessons in the video that those new to trading might find valuable. Enjoy.
Click the image below to launch the video and please allow a few seconds for the video to load.
Longs: RICK, ANSS, BIDU, MORN, ACL, MATK, TDY
Shorts: URBN, NUE, MOS, SYT
ETFs: GCH, DUG, TKF, EWA, NLR, RSX, PIO, PBW, TAN
If you’d like to view the video presentations each week, get all the tracking tools for breakout stocks, ipo’s and ETF’s as well as buy and sell alerts right to your desktop, then the Gold membership is for you. Your support of my independent research is greatly appreciated.
