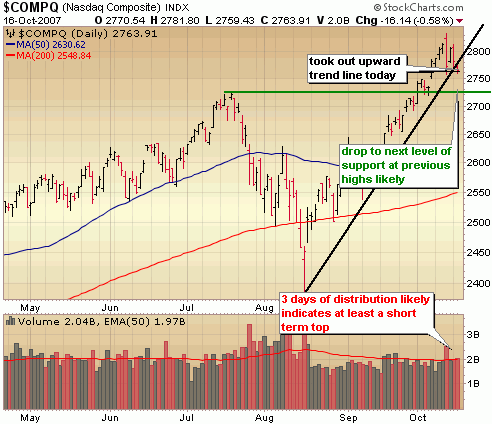
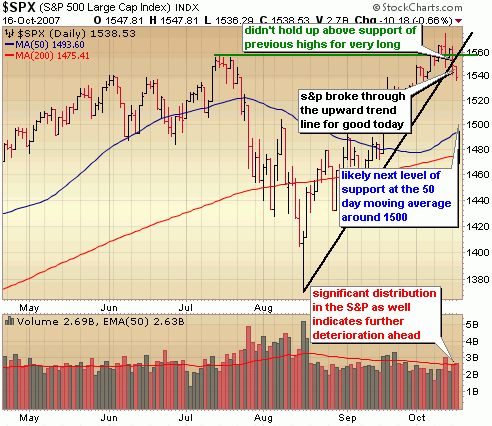
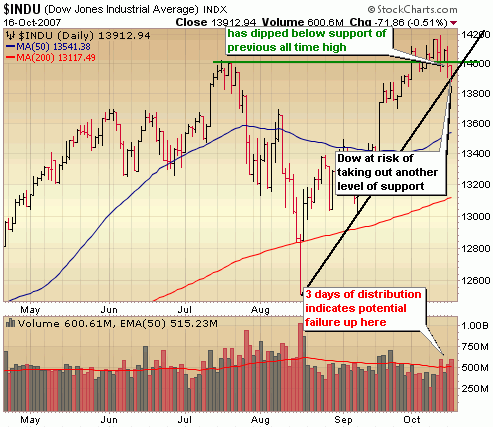
The credit woes that plagued the market in August got a bit of reprieve following the euphoria of the big Fed rate cut, but stark reminders are emerging within the financial statements of financial companies as they begin reporting earnings. The ramp up in oil prices may be finally be causing some concern as well. From my perspective the reasons for selling don’t matter much though. All I’m concerned with is price and volume movement and support/resistance levels. We can all debate until we’re blue in the face how severe the credit woes are or how long housing will remain mired in a slump or at what point oil prices become a major concern for the economy. What stands out to me most is the high volume reversal of last Thursday and subsequent back to back distribution days yesterday and today resulting in a break of the upward trend lines of the major indices. The action indicates a top at least temporarily. In my after market report last Thursday, I discussed the major resistance area of the Nasdaq but after re-reading what I wrote I realized that I didn’t highlight the selling intensity as well as I should have. It was very important, topping like action and I should have centered around that more than I did. The bottom line is that all indications point to further deterioration in the coming weeks. Preserve that capital and consider locking in profits quicker.
Note the big intraday reversal in the Nasdaq on Oct 11th. The intraday high on that day just happened to touch major resistance at the top of a long upward trend. Coincidence? No way. Today we broke through a steep shorter term upward trend line and there is a good chance that the Nasdaq will deteriorate further and test the next level of support at those July highs around 2725.

The S&P wasn’t able to hold above the July highs very long and broke through its own upward trend line for good today with some significant volume behind it. While the selling wasn’t particularly intense today, it does mark the 3rd day of distribution in just the last 4 trading days. There isn’t any major support from here until we get to around 1500 so there is some room left to the downside from here.

The Dow is hanging on by a thread at support of its upward trend line but volume levels indicate that won’t last long. I think we’ll at the very least test 13600 in the coming days.

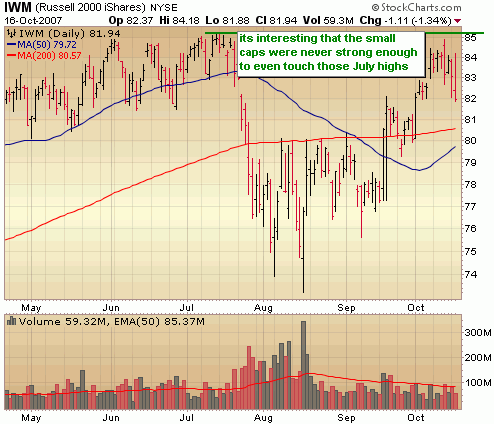
It’s interesting that the Russell never touched the July highs.

::: Major Indices Performance – The Numbers :::
(Note: volume averages are based on the average over the past 50 days)
Data as of 4:00EST – End of Day October 16th 2007
Nasdaq: DOWN .58% today with volume 2% ABOVE average
Nasdaq ETF (QQQQ) DOWN .47%, volume 52% ABOVE average
Dow: DOWN .51%, with volume 17% ABOVE the average
Dow ETF (DIA): DOWN ..61%, volume 10% BELOW the average
S&P ETF (SPY): DOWN .79%, volume 12% BELOW the average
Russell Small Cap ETF (IWM): DOWN 1.1%, volume 42% BELOW the average
::: SelflInvestors Leading Stocks :::
The Self Investors Leading Stocks Index is comprised of stocks in the Breakout Tracker, which is a database of the fastest growing companies near a breakout or having already broken out of a base. Today’s selling wasn’t particularly intense as indicated by the action in leading stocks. Volume levels did not indicate institutions were dumping large numbers of shares.
Summary:
* Decliners led Advancers 251 to 112
* Advancers were up an average of 1.46% today, with volume 3% ABOVE average
* Decliners were down an average of 1.94% with volume 4% BELOW average
* The total SI Leading Stocks Index was DOWN .89% today with volume 2% BELOW average
::: Where’s the Money Flowing :::
Many investing websites provide leading industries based on price performance alone. However, without accompanying volume levels, this can sometimes be misleading. The only way that I know of to gauge industry/sector strength WITH volume levels is through the analysis of ETF’s. A couple years ago this was not possible, but as more traders/investors use ETF’s they become a much better tool for gauging the health of the market and seeing where the money is flowing (or not flowing). Using the proprietary SelfInvestors Demand Indicator score which measures price and volume movements, I’m able to quickly see which sectors/industries are seeing the greatest inflows of cash. For a detailed look at how I go about gauging sector/industry strength please see the following post: http://selfinvestors.com/si/industry_tracking/
* Current Leading Sectors/Industries (over last 30 trading days):
Gold, Internet Infrastructure, Gold Miners, Software, Agriculture
* Current Lagging Sectors/Industries (over last 30 trading days):
Retail, Homebuilders, Semis
* Today’s Market Moving Industries/Sectors (UP):
Oil
* Today’s Market Moving Industries/Sectors (DOWN):
Home Construction, Biotech, Internet, Financial, Realty, Oil & Gas Services (fairly broad selling today)
::: Stocks :::
The stocks section will be an area where I highlight one stock selected from a group of stocks moving up with volume well above average and most likely breaking out of a base or consolidation. Sorry, short on time tonight so no stock of the day today but you might like to have a look at these leading stocks that above the 50 and 200 day moving averages and moved up with significant volume today:
QMAR, LULU, RICK, TEF, ESLT, DAR, SOLF and RVBD
A Silver Membership at SelfInvestors for just $19.95/month gets you all the tracking tools for leading stocks, IPO’s and ETF’s! More details here.
The volume that has been coming with the down days is what worries me the most. The market has been hitting new highs lately on unimpressive volume, and it has perked up most in these recent down days.