IPO Mania


(my apologies for the array of font sizes and styles – the transfer didn’t go as well as planned.. I suppose variety isn’t so bad.  As always click on the thumbnail charts for the larger version)

Over the past couple of months, a slew of successful IPO’s have hit the market, renewing excitement not seen since the good ‘ol days of the late 90’s.  Most investors are well aware of the biggest IPO in history – Google, which soared more than 100% in less than 3 months.   But there are other less recognized names that have gone on to equally astonishing gains in very little time.  The goal of this special report is to highlight some of these companies and introduce you to what could possibly be the biggest IPO of the year, PortalPlayer. 

Before I begin, I’d like to discuss the best way to go about purchasing an IPO.  William O’neil, the founder of CANSLIM has often stated that the best way to go about it is to wait for the stock to carve out its first base, shaking out the speculators in the process.  I would have to agree that this is the safest way to profit from an emerging leader new to the market.  By waiting, you’ll also have a better idea as to the stocks "history".  By history I mean the amount of volatility in the stock, volume patterns as well as support and resistance areas.  However, (there’s always a however right?) depending on your appetite for risk, purchasing a small position within the first 30 days can be very profitable.  Here are a few things to consider when making a purchase in an IPO

  • First of all, make sure the company is growing and making money (all of the stocks highlighted in this report are).

  • Once the lockup period is over (the period where insiders are unable to unload shares), the stock price could come under some selling pressure as the supply of shares increasesConversely, during this period, the combination of high demand and a lock on supply can fuel big gains.  Lock up periods are usually around 180 days, but can vary from company to company.  For example Google has decided to go with a series of lockup dates to avoid dumping the entire amount in one day.  The first large release of shares to the market occurred on Tuesday, November 16th when the size of the float (the number of shares available for trading by the public) more than doubled with the release of 39 million shares.  Subsequent lockup periods will end in mid December, January and February.  On February 14th, the last day of the lockup period, 170 million shares will flood the market.  Watch to see how this affects the stock price.  Does the stock bounce back after some selling pressure?  If so, that means the institutional demand for the stock outweighs the increase in supply.  The sign of a strong stock.

  • Immediately upon expiration of the quiet period (40 days from public offer), analysts affiliated with investment banks that participated as the lead underwriter or as a co-manager in the deal typically initiate favorable research coverage.  What can happen is that an IPO will run up in price several days before the quiet period ends in anticipation that favorable coverage will be initiated and then sell off once the recommendation is released.  Just another example of "buy on the rumor, sell on the news". 

Ok, let’s get to it.  The following companies are exhibiting outstanding growth and have recently come to market with their IPO.  Of course, all companies highlighted here are merely suggestions and are not a buy recommendation.  As always, please do your research and/or consult your financial advisor before making any purchase. 

Portal Player (PLAY)

In what could be one of the biggest IPO’s of the year, Portal Player began trading publicly on Friday, closing at 26.06 (good for a 53% gain from its initial offer price of $17/share – the stock opened trading above $25/share, so you didn’t miss much). 

As a supplier of the guts that make up the "must have" Apple Ipod, the hype in this company is well founded.  Since establishing a relationship with Apple, the company has  enjoyed astonishing growth, especially in the recently reported quarter ending in September (the first profitable quarter in the company’s history).  In fact, the company increased earnings 450% and sales 113% from the previous quarter!  That kind of growth over an entire year would be impressive.. but 3 months? Wow.  Imagine what kind of growth they’ll report after this quarter, with the Ipod expected to be near the top of many Christmas wish lists.  The future looks bright as well, with the hard drive based MP3 market expected to increase 60% a year for the next few years.

Of course, big rewards and risks go hand in hand.  While the relationship with Apple has obviously led to good fortunes for this company, it is both a blessing and a curse.  With 93% of sales coming from sales of the Ipod, any change in this relationship or problems on Apple’s end would be a big blow to the company.  In addition, as the market for portable MP3 players continues to expand, you better believe that other companies will want a piece of the pie. 

Whether you have a position in this stock or are on the sidelines, it will no doubt be fun to watch this one!

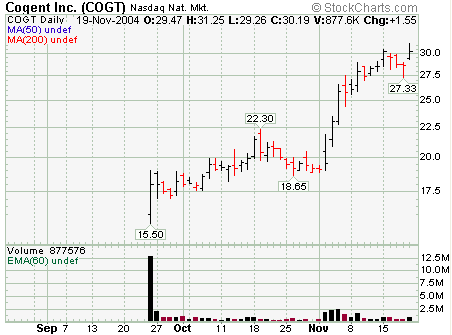
Cogent (COGT)
cogt cogent ipo


Cogent, Inc. is a provider of automated fingerprint identification systems (AFIS) and other fingerprint biometrics solutions to governments, law enforcement agencies and other organizations worldwide. The Company’s AFIS solutions enable customers to capture fingerprint images electronically, encode fingerprints into searchable files and compare a set of fingerprints. The Company’s AFIS solutions include Cogent automated fingerprint identification system and Cogent live-ID; Its AFIS products include programmable matching accelerator servers and live-scan systems; Cogents AFIS services include the design, integration and training, as well as outsourced live-ID biometric processing services, and the Company’s ASIC applications include BioGate, national identification card programs and MobileIDENT. Cogent offers all of the elements to deploy fingerprint biometric solutions, including search and retrieval software, capture devices and systems integration services.

In the past few months Cogent has received contracts totaling 74 million from the National Electoral Council in Venezuela to install a "one voter, one vote" system using its fingerprint identification technology.  In late September, Fujitsu Microelectronics America announced that Cogent’s software had been integrated into the JumpDrive TouchGuard, the newest USB portable storage product from Lexar Media that replaces awkward passwords with the convenience of a finger swipe to control access to data stored on the device.  Just last week, Cogent, Inc. announced that it has completed the activation of its Automatic Fingerprint Identification System (AFIS) for the Department of Public Safety and State Police in Connecticut and Rhode Island. The total contract and orders are valued at approximately $10 million.

Financials
Cogent is a company that has seen its earnings and sales surge over the past year.  Quarter over quarter sales growth has come in at 390%, 295%, 224% and 687%, while earnings growth in the same time period has been equally, if not more impressive with growth of 999%, 600%, 800% and 600%.  Earnings growth is expected to slow in ’05, but remain strong with growth of 51%.  The company enjoys a strong balance sheet with rising margins (net margin currently at 55%) and 208 million in cash.

Technical
Since the IPO, Cogent has run up nearly 100%, balking at the thought of carving out a decent base.  A pull back is certainly in order as it appears overbought at this point.  With no clear support areas, it makes it difficult to make a sound buy decision, but I would expect support to be in the 22.50 – 25 range which might offer a reasonable place to initiate a small position.  A better strategy is waiting for the stock to carve out a decent base and purchasing at a breakout from consolidation.

Shanda Interactive (SNDA)
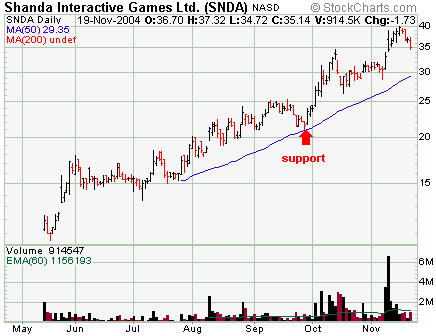


shanda interactive snda ipoShanda Interactive Entertainment Limited (Shanda) is an operator of online games in China. It offers a portfolio of online games that users play over the Internet. The games, licensed from third parties, as well as developed in-house by the Company, include The Legend of Mir II and The World of Legend. Shanda’s commercially launched games have approximately 1.4 million peak concurrent users and 931,570 average concurrent users. The Company operates massively multiplayer online games (MMOGs), including massively multiplayer online role-playing games (MMORPGs) and casual online games. MMORPGs allow thousands of users to interact in a virtual world by assuming ongoing roles or characters with different features. The games are continuous, and players accumulate features and communicate with one another through instant messaging. Casual games, which include BNB, are less complex and time consuming than MMORPGs, but attract a broader range of users, including more home users.  Considering that 90% of the Chinese population is still offline, there remains a large, untapped market of potential gamers.

The company is continuing to expand its business through strategic acquisitions and investments.  Recently, Shanda has completed acquisitions of Bianfeng, a developer and operator of online chess and other board games, Quidian, an interactive online literature portal as well as Digital Red, a developer of games for mobile phones.  While not yet contributing a major portion of revenues, the fastest growing segment of the company is online advertising.   In October, Shanda announced a strategic relationship with EbayEachNet, a subsidiary of eBay, that places EbayEachNet advertising on Shanda websites.  One concern with the company that has yet to be resolved is its ongoing rift with China Telecom which began selling its discount gaming cards at a greater discount than the company was selling them for.  Shanda has threatened to end the contract with China Telecom, while China Telecom has threatened to cut off its internet access.  Can’t we all just get along!

Financials
Over the course of the past year, earnings and sales growth has remained strong with quarter over quarter sales growth for the past 4 quarters of 126%, 63%, 109% and 133%, while earnings growth has come in at 100%, 8%, 60% and 93%.  Net profit margins have remained steady in the past few years at around 45% which is excellent.  Return on equity, while still strong at 23% has been declining for the past few years.

Technical
Shanda has nearly tripled in price since its IPO and is well overdue for a correction.  Jumping in at this point would be a mistake.  Wait for a pull back to the 50DMA, where it was able to find support at the end of September.  A bounce off support may offer a buying opportunity, but a more likely scenario is for the stock to carve its first significant base.  It’s possible that the uncertainty surrounding the relationship with China Telecom could provide the catalyst for a correction.

Note: While Shanda is certainly a company to keep an eye one, another way to invest in the growth of Chinese online gaming is SINA which is a larger, more established company that has solidified its position as a leader with its relationship with Yahoo.

Bucyrus International (BUCY)
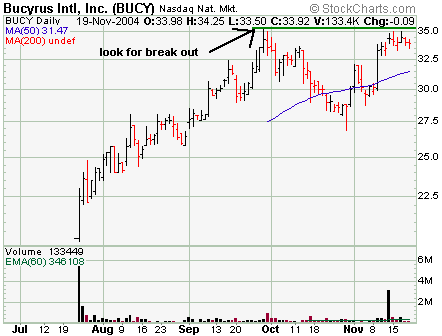
bucyrus bucy ipo chartBucyrus International, Inc. designs, manufactures and markets large excavation machinery used for surface mining, and provides aftermarket services, supplying replacement parts and offering maintenance and repair contracts and services for these machines. The Company manufactures its original equipment manufactured (OEM) products and manufactured aftermarket parts at its facility in South Milwaukee, Wisconsin. Its principal OEM products are draglines, electric mining shovels and rotary blasthole drills, which are used primarily by customers who mine copper, coal, oil sands and iron ore throughout the world. In addition, the Company provides aftermarket services in mining centers throughout the world, including Argentina, Australia, Brazil, Canada, Chile, China, England, India, Peru, South Africa and the United States. The largest markets for this mining equipment have been in the United States, South America, Australia, South Africa and Canada.

Fundamentals
Bucyrus is a company that has just recently turned profitable (first profitable quarter in June ’04), capitalizing on the strength of the commodity industry.  Earnings have been impressive recently, especially in the last two quarters with quarter over quarter growth of 625% and 377%.  Growth in earnings is expected to continue to surge through ’05 with estimates of 151% growth over 2004.  Margins remain poor, but they have been improving each year for the past few years.

Technical
After running up nearly 100% in just a couple of months, the stock has carved out a short base on analyst valuation concerns and a secondary offering which has been completed.  A break out above recent consolidation may offer a buying opportunity.  Look for volume to surge as it does so.

Syneron Medical (ELOS)
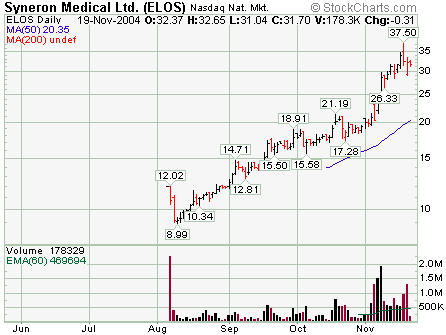


syneron medical elos ipo chartSyneron Medical Ltd., incorporated in July 2000, designs, develops and markets aesthetic medical products based on electro-optical synergy (ELOS) technology, which uses the synergy between electrical energy and optical energy to provide effective, safe and affordable aesthetic medical treatments. The ELOS technology combines optical energy, which is derived from light waves, with electrical energy, in particular radio frequency energy that results from the flow of electric charge through a conductor. This combination enhances the user’s ability to target accurately the tissue to be treated and enables real-time measurement of skin temperature, resulting in increased patient safety and comfort and improved treatment results. The Company’s products are sold primarily to physicians and other practitioners, target a wide array of non-invasive aesthetic medical procedures, including hair removal, wrinkle reduction and rejuvenating the skin’s appearance through the treatment of superficial benign vascular and pigmented lesions.


Recently, Syneron has released a series of positive announcements, solidifying its place in the non invasive aesthetics industry. On October 18th, the company announced the Health Canada approval for the VelaSmooth, its new aesthetic device for body contouring and the treatment of cellulite.  The VelaSmooth is a medical device that reduces the appearance of cellulite and safely and effectively re-contours the skin’s surface and body shape. Its launch marks a new era in the medical treatment of cellulite. On October 25th, the company announced that the US Food & Drug Administration (FDA) has granted 510K marketing clearance to Syneron’s Aurora(TM) and its derivative systems for "removal of unwanted hair from skin types I-VI, and to effect stable long-term, or permanent, hair reduction". This new clearance expands on the previous clearance for hair reduction granted in July 2002, reflecting the excellent long-term results documented in more than 24 months of clinical studies.  Last week, the company was granted Medical CE Mark 0344 approval of its Vela(TM) system for non-invasive cellulite treatment in Europe.  "This unique medical CE Mark further proves that Syneron products meet the exacting quality and efficacy standards of the international medical community," said Hans Edel, Managing Director of Syneron GmbH. "With this latest regulatory approval, Syneron is able to market the widest offering of products in Europe of any medical aesthetic company."

The non-invasive aesthetic procedure industry is a rapidly growing field with many competitors (see Palomar (PMTI) and Laserscope (LSCP) – both are also rapidly growing companies.  Palomar has the luxury of a partnership with GE to assist in product development and marketing).  According to IBD, Syneron separates itself from competitors by offering the customer more than just the device.  It has lined up an insurer that cut its malpractice premiums for procedures done with Syneron gear.  Additionally, the company sends in a consultant to evaluate the doctor’s practice and provides a 3 year warranty. 

Fundamentals
From the company’s inception in 2001, growth has been nothing short of amazing.  In 2002 and 2003, the company grew earnings 300% and 320% respectively, with growth expected to exceed 170% for 2004.  However, growth is expected to ease in ’05 with estimates of 11% growth.  I would expect those estimates to be revised upward as recent product approvals lead to increasing sales.  Profit margins are excellent and nearly double that of its nearest competitors, Laserscope and Palomar Tech.  The company has an impressive balance sheet with 90 million in cash and no debt.

Technical
Another IPO that has soared since coming to market, having yet to carve out a base.  In fact, it hasn’t yet come close to testing support of the 50 day moving average.  Wait for a pull back to the 50DMA to see if it bounces.  If so, it may offer an opportunity for some short term profits.  Looking longer term, look to initiate a larger position after the stock has had a chance to carve out its first base.

Other Rapidly Growing IPO’s to Watch

  • Google (GOOG) of course! Stock is carving out it’s first base – look for a pull back to the 50 day moving average as a buy opportunity.  Stock faces increasing pressure as lock up periods expire and supply expands.
  • Rightnow Techonologies (RNOW): provider of integrated customer relationship software is consolidating gains after tripling in four months
  • 51job Inc. (JOBS): provider of integrated human resource services in China has doubled in price since going public in late September and has yet to carve out its first base
  • Kanbay International (KBAY): global provider of information technology services to the financial industry has shown good institutional support by bouncing off support levels – it is weakening technically and may be carving out its first base
  • Westllake Chemical (WLK): its been up, up and away for this manufacturer and marketer of basic chemicals – the stock has more than doubled since its IPO and has not come close to testing major support.  Wait for a pull back to the 50 day moving average as a potential buy opportunity
  • VNUS Medical (VNUS): provider of minimally invasive treatment of venous reflux disease is wasting no time in carving out its first base – after surging in the first few days of its IPO, the stock has plummeted in recent days to begin the left side of a potential base.

The above report was sent to SelfInvestors.com members several days ago – if you’d like to receive these special reports as well as market outlook and industry reports, you may sign up at www.selfinvestors.com.

Discussion of Changes to Breakout Tracker

Question:

Thank you so much for your long memo regarding the upcoming (and recent) changes. I am glad you have decided to go weekly on the update. I was becoming concerned with the obviously enormous amount of work you had to do each day, wondering how it was humanly possible to keep it up. So, I welcome the change. Besides, there are many places to go to get detailed daily updates.

I had not noticed the column change from breakout rank to 50% DMA. I guess that corroborates your view of its relative importance. I welcome the change. I think another value with this new column is the IBD notion that a sell signal flag is raised when the price gets too extended by becoming more than 51% above its 50 dma. It is not easy to get this visual information from Metastock, so you are providing a valuable service on this little-used signal.

Your description of the new look and function of Breakout Tracker sounds great. I can hardly wait. When you have the time, I will be very interested in finding out how you will be calculating the new sixty-point ranking system.

Finally, one last question. Are the numbers in the Breakout Tracker calculated each day? I’m thinking of the pivot point which sometimes tends to meander a bit.

Best of luck on your update. There are many of us who will be thankful.

My Response:

You make a good point about the additional use of the 50DMA info – I had forgot to mention that, nice work.  Let me give you a quick rundown of the new ranking system (in fact now that I think about it I will send all members a look at how the rank is determined sooner, rather than later):
 
TECHNICAL: based on 30 points
  • 10 points (Relative Strength):  eg. RS of 78 recieves score of 8
  • 10 points (Shape): score base on volatility of day to day action as well as overall shape (eg. wild intraday price swings with a V like base will receive a much lower score than a long flat base with tight intraday action)
  • 10 points (Buy Vs. Sell Volume): i look at a daily and weekly chart to determine buy vs. sell volume – the more buy volume the higher the score
FUNDAMENTAL: based on 30 points
  • 15 points (Earnings/Sales Growth): I look at consistency, history, amount of growth, acceleration and future growth estimates (future growth is very important something I noticed IBD wasn’t factoring in to their ranking system). I give it more weight in my system.
  • 10 points (Profit Margins/ROE): I look at relation to industry average and if it’s rising or declining.  (ie. if both margins & ROE are well above the industry average and have been rising the last couple years, the stock will recieve a score of 10)
  • 5 points (Management Ownership/Institutional Positions):  If management owns a large portion (say 20% or more) and institutions are initiating many new positions, the stock receives a score of 5.
The risk number that is included in the Tracker is just a measure of volatility.  I personally don’t use it and don’t think it’s all that valuable, but if you find it valuable  I will probably leave it be.  To come up with a true risk reward ration requires a lot of work and takes into account many factors (support areas, RS, trend lines, sector, future growth, etc.) It is very difficult to come up with an exact numer for something like this.  When I look to enter a position I look at where the buy point is from the nearest major support area (another good use of the new %50DMA column)  – this gives me a good idea as to my potential risk (assuming I will hold and allow it to test that support).  My risk is the % I could lose if the stock drops below support.  Assuming that high ranked stocks will offer the greatest potential rewards, which I think is fairly safe to assume, you can get a decent picture of risk vs. reward.  For example, take a stock like HURC which I mentioned last night.  Here is a stock that is highly ranked (53).  I see that it has been skating along major support of the 50DMA (indicating very strong support there) for the last couple days.  To me, this is an extremely high reward vs. risk stock because if the stock drops below the moving average (which it appears unlikely to do) i’m out with a very small loss.  As it turns out, the stock bounced for a 12% gain today.  Now that’s what I call a nice reward!  As you can see it would be very difficult to determine this on a day to day basis, but combining the ranking system with the %50DMA column and a quick analysis of the chart, you can start spotting some real nice opportunities.
 
You asked about updating the info.  Unfortunately, usually the pivot points aren’t repositioned. Although I have at times gone in and changed a pivot when it was clear that wasn’t quite the best buy point.  IF you could give me an example I would be happy to discuss it.  Also, please dont’ hesitate to notify me if you think the pivot is wrong or there are other errors.  This database is maintained by me and yes I do have bad days and make errors.  If I can get members to notify me of problems, it would be a big help. 
 
Hope this helps .. and hope you’re making some money! 

Send Those Bears Into Hibernation

The following is a portion of the free report I send out to subsribers of SelfInvestors.com. What I’ll do is post portions of the report during critical moments for the market, but eventually would like to post the entire report here once I get the technical kinks worked out – stay tuned! If you’d like to receive the entire report every evening you may sign up here

I mentioned in last night’s report that some good news could really send this market.. and good news we got! The big drop in crude on an unexpected rise in inventories as well as some decent economic data put traders in a buying mood ahead of elections. For the second straight day, volume surged higher than the day before creating an unprecedented two straight days of accumulation! The last time that happened was exactly one month ago. Today’s action was a major boost to a tired market in danger of rolling over, but key resistance remains before an all out rally can be declared. The end of the elections could just be the final catalyst to send the bears into hibernation for good!

Let’s take another look at the major indices to get an idea of where we’ve been and where we need to be. We’ll start with the Nasdaq which is comprised of the majority of CANSLIM style stocks. Clearly, today was a big step in the right direction as the Nasdaq surged above resistance of the 200 day moving average. However, another large hurdle remains in the form of the downward trend line. If the Nasdaq can get above this line and find support there once it does, that would be a MAJOR accomplishment.

The S&P battled two major areas of resistance today (the 50 and 200 day moving averages) and came out on top… of both resistance levels. While this is impressive action, it too has yet to overcome the downward trend line.

The Dow, a conglomerate of large, blue chip, slow growers has clearly lagged the rest of the market this year and remains submerged below all major resistance levels. These levels include "psychological" resistance of Dow 10,000, the 50 day moving average, the 200 day moving average and the downward trend line.

SECTOR REPORT: The Quiet Ascension of the Brokers & Dealers

Much of the attention lately has focused on technology (especially Google!), but behind the scenes, Brokers and Dealers are staging a nice advance as well. As the index works its way up the right side of its base, notice the good support at the 50 day moving average and then the surge above resistance of the 200 day moving average today.

Taking a look at the Breakout Tracker (a premium service I provide at SelfInvestors.com), there are currently 7 stocks listed in this sector (that make up the Asset Management and Investment Brokerage industries). Six out of 7 have broken out to gains with an average gain of 10% (two are still in a buyable range).

Industry Spotlight: Security Software
In today’s world, combining security and technology means big business and the Software Security industry is beginning to catch fire. Take a look at companies like Symantec (SYMC), Aladdin Knowledge Systems (ALDN), RSAS Security (RSAS), Blue Coat Systems – insider buying (BCSI), Safenet (SFNT), Internet Security Solutions (ISSX) & Tumbleweed Communication (TMWD). These are the leaders in the software security arena.

TASR Review

Taser is moving this morning on news that a Department of Defense study by the Human Effects Center of Excellence concluded that TASER technology is generally effective without significant risk of unintended results, but obstacles remain. For one there are rumors of large lawsuits on the horizon as a result from deaths during Taser incidents. In addition, the company can expect competition over the next few years as competitors race to produce safer, more effective products in order to capture a piece of this growing field. Finally, the company will report earnings Tuesday which could create significant volatility for the stock. Despite the risks, signifant profit potential remains in the stock. Let’s take a look again at the chart. (See past posts regarding Taser for a more detailed look at the chart)

You can see in the chart above that selling volume is once again drying up and Taser may be on the verge of a big shift to buyers. Look for a break above short term resistance at 40 with large volume as the signal for a potentially large move up, while a break below short term resistance at around 36 as a signal that the stock will need to spend more time basing. All eyes will be on the upcoming earnings report, which could be a catalyst for movement in either direction (see the post on why it’s a good idea to avoid holding a high risk stock through an earnings report).

As always, please do your own research before making any buy or sell decisions.

Do You Provide Clear Buy and Sell Signals?

Question:

I joined a new  IBD group that met for the first time last month in the
Chicago area. The group  is interested in learning how to successfully
invest using CANSLIM. Just to keep things simple do you provide clear buy
and sell signals for the stocks that you recommend.

 I’m a little skeptical that anyone’s recieved a 100% return in the current
market. Do you provide proof that your portifolio made 100% this year?

My Response:

Thanks for your inquiry.  To simply answer your first question.. yes, I do
provide clear buy and sell signals to my members in a few different forms.
One way I do this is through a Weekly Stock Watch which is sent to members
every Sunday evening and takes a look at the best opportunities for the week
ahead.  Each stock is accompanied by analysis of the chart and buy and sell
strategies.  As you know, I also run a model portfolio so that members can
see a "real world" portfolio in action.  For each stock I provide
trading notes throughout the holding period at critical points (such as
break above resistance or below support, etc.)  When a position is purchased
or sold, the member is notified within a couple minutes time (usually as
fast as I can get an explanation written and sent out).  Of course, I
recommend that members do their own research before blindly purchasing these
picks.

You asked about performance.  That 100% performance is an annualized return
(actually, I need to update that.. it’s currently 95%).  That includes a
string of big winners that were recommended when I was working as an analyst
for CANSLIM.net near the end of 2003 (these picks included RIMM, AUO, COH).
As you know, it has been a difficult market in the past year for growth
investors.  Year to date, the SelfInvestors.com Portfolio is up 8.3%,
compared to a 6.6% year to date return when you average the major indices.

I’d like to discuss a bit too my investing strategy which is aligned with
the ultimate goal of many of the most successful investing strategies. 
It’s as simple as keeping losses small while letting your winners run. 
It’s not about how many winning trades you have, it’s the size of your
gains vs. losses.  For example, over the last couple months my winning
percentage has been less than 50%.  Buy by keeping losses small
(losing trades have averaged 5% loss) they can be easily recovered from. 
In fact, one pick (Jupiter Media – up 43% has more than covered these
losses).  That is the key to this strategy… you are basically searching for
the big winner and the good news is that you don’t need to be right very
often if you practice sound money management.

I have talked quite a bit about the portfolio, but the real gem of the
service is the Breakout Tracker, which I think you’ll find incredibly
useful.  No other site offers a service like this.  Imagine having a list of
every potential breakout ranked according to fundamental and technical
analyis which can be sorted by industry group, relative strength, % change
from average volume (similar to IBD’s Where Is the Big Money Flowing), etc. 
A quick and highly effective strategy that I encourage members to use is
focusing on industry groups that are leading the market and create a watchlist
of the highest rated stocks in those groups that are near a breakout.  Set alerts
for your pivot points and be prepared to make the purchase!  The Breakout
Tracker allows you to do this in just a few minutes each evening.

I would encourage you to sign up for the free report which begins the
process of implementing a successful high growth strategy.  It discusses the
health of the market and pinpoints sector and industry group strength.  As I
do with all members I would be happy to discuss investing and/or my services
in greater detail if you’d like.  I’ll remind you that I aslo offer a free
premium trial, which I will be increasing to 30 days very soon (it’s
currently 10 days, which I don’t think gives the potential member a good
idea of what the service offers).  Anyway, I hope I’ve answered your
questions here and sincerely look forward to working with you in the future.

More Notes On Buying And Selling Strategy

Question:

I want to ask you a question and advice on something.  I read your notes on
GIVN and feel the same way about HANS today.  What happened to that thing
today???  I caught it right above it’s pivot point this morning and watched
it go over 30 and thought this will be a good one!
Next thing I know I am stopped out 7% down in a flash. I have to leave to go
to my part time job at 2:15 PM EST.  When I got back home, I saw where it
really took a beating.  Thank goodness for stop loss orders.

Here’s what I learned from this one and I want your advice on how you would
have handled it.
I read somewhere that if you enter a trade, it should go up from the start
to some degree.  In other words, it should be a good trade from the start.
Now, it might wiggle a little after it moves up in a slight pullback but
should not tank before the end of the day.  I usually watch a new trade for
some time after I buy to see how it reacts.  I always immediately enter a
stop loss in case the computer or market crashes.  It is usually at some
support level around 7% to 8% below the buy price.  But today I learned to
put a shorter stop loss in on the first day especially since I can not be
here all day on the trade day.  If it survives the first day with a
reasonable gain, then the next day I will move it lower.  At least that’s
how I think it would work in this type of market.  In a bull market, maybe
the 7% stop would be best.

Finally, my question.  How do you handle a new buy the first day in this
type of market?  Where would be the best place to put a stop loss on initial
buy?  I know you can’t advise what to buy and stuff, but let me know what
you might do in these circumstances.  And another question.  Bill says to
let the winners run to about 20% from the pivot point before it bases again
and think about taking some profits while they are going up.  With this
market, many are not getting anywhere near even 15% before they fizzle. Two
stocks I am holding now have over 10% gain and I don’t want to lose it.
I’ll tell you what they are. JUPM is up 12.77 % and OS is up 11.51%.   How
close do you think Bill would put a stop loss under these?  There’s no
telling what could happen in this market we are in and I just thought I
would ask.

My Response:

Let’s tackle your HANS purchase first… did you get a chance to read the report for this stock?  In it I said  This is a stock that is showing heavy accumulation by institutions and appears to have room to run.  However, I would be hesitant to purchase at the formal pivot of 29.18 due to the fact that it sits far above the first line of major support.  Any significant shake out in the stock will force you out of the position.  In a perfect world the stock will continue its decline to around 25 on lower selling volume, offering a better purchase point.  Does this mean you should avoid the stock completely should it surge from here above the all time high?  No.  Give yourself a chance at success, but be vigilant about keeping your losses small.  This would mean selling the position should it drop below the pivot point on increasing sell volume. "
 
This an excellent company that should continue to do well, but keep in mind that just because it’s a great company and it surpasses a pivot point does not mean it’s a great buy.  In that report I suggested taking a look at the distance from the first line of major support and the pivot point.  Clearly, this is a stock that has run up quickly in the last couple of weeks, was far extended from support and needed to consolidate gains.  This is one of those breakouts that had a high probability of coming back to the pivot or worse, dropping more than 8% below the formal pivot.  (Now it could also be argued that the pivot is 25.29 – technically it is more than 1/2 up the base.  I didn’t list this point as the pivot because I felt that after the run up it had it needed to spend more time consolidating and that a proper pivot would be higher in the base – in the future I will leave personal opinion out of it and stick to the technical rules for finding pivot points). 
 
Now, that being said, I don’t think it’s a mistake to take a chance on a breakout of a stock like this.  Stocks have certainly shot to the moon without a meaningful consolidation in the past and will happen again, but not very often.  However, this is not a stock that I would have purchased, set a 7% stop and walked away from.  It’s one that I would want to monitor (i’ve attached an intra day chart to give you some thoughts on how I would have played this during the day). 
 
OK some tips on making the purchase:
  • Purchasing in the first half hour of trading is rarely a good idea… this is the time that amateurs do most of their trading and the true direction of the stock has not been revealed.  Looking at that chart of HANS, the stock gapped up immediately at the open, consolidated and then plummeted below support of the bottom of the gap within a couple of hours on heavy volume.  It would have been best to watch a 5 or 10 min chart and waited until it cleared the consolidation on heavy buy volume… which it never did and the purchase would not have been made.
  • Make sure volume is surging: Divide the 50 day average volume by 6.5 hours (hours in a trading day) and then multiply by where you are in the trading day (this is done automatically in the Breakout Tracker, but delayed 15 minutes.)  When monitoring a breakout you will want to know if volume is surging in real time.  Of course you could see this on a 5 minute chart as well.  Helps to have one monitor for your 5 minute charts and one for executing trades.
When To Sell (may like to have look at the tutorial section on selling as well)
  • Typically, you’ll want to lock in a profit at 20-25% if the stock doesn’t increase by this amount in less than 2-3 weeks.  Stocks that jump 20% in a short time frame (JUPM has this potential and possibly OS) should be given a chance to run.   Of course if the market turns negative, these rules will be modified and positions will be closed much sooner or held longer depending on conditions.  Currently, the market is strong and positions should be given a chance to ride out.. especially positions like JUPM.  I don’t believe in hard and fast rules for selling though.  It really depends on the overall market, price, volume and where support levels

Same Chart, Same Result: Predictable Price/Volume Patterns

A couple of weeks ago I posted a chart on Taser (TASR) and pointed out that sellers were about done and it was a matter of time before buyers took control. What are the clues? The selling volume was drying up with each day and there was a decent probability that the stock would form a near symmetrical double bottom base. Taking a look at the chart, you see that the second bottom spent an almost identical amount of time forming the bottom before buyers took control with a surge in volume. Now it’s important to realize that charts won’t usually form quite this symmetrically, but if you are familiar with the shapes of the most common chart patterns and can spot volume dry up/buying surges you can often times predict future price movement. Will you alway be right? Absolutely not! It’s all about probability and using as many pieces of information in order to steer the odds of success in your direction. Here’s a current chart of Taser:

Let’s take a look at another example of predictable price movement in the chart of CALM (Cal Maine Foods). During the low card diet craze of last year, this egg producer ran up over 1000% in just months. Since late March it has been carving out a nice looking doube bottom base.

Again, notice the symmetry on either side of the middle peak of the W formation? Notice the the dry up in selling volume on both sides before buyers take control?

In both the case of TASR and CALM, you’ll notice that the formal CANSLIM pivot has not been reached… but I believe there are certain times when it’s ok to buy before the pivot: If buying before the pivot the following conditions should be met:

* Market in uptrend
* Decreasing selling volume, surging buying volume
* Support levels are near (within 10% of purchase price)
* Base has exhibited quite, predictable price action in the past (no erratic bases!)

By becoming familiar with common price patterns, you will soon be able to predict future movement and your success rate will dramatically improve. Start studying those charts … as many as you have time for! Are there unpredictable price/volume patterns? Absolutely.. there are many more unpredictable patterns than predictable patterns. Stick with predictable patterns.

Here are a couple of examples of erratic, unpredictable price patterns that should be avoided.

Would you be comfortable with your hard earned money in this stock? I know I wouldn’t!

How about this one?

New Breakout Tracker Is Stunning! Some Suggestions….

Question:

You new breakout web page is stunning. I like the design and the idea of multiple pages which gets rid of the clutter. With that said, I have two questions:
  • With so many pages of stocks is there any way to "find" a specific stock, i.e., if I use the Find Command (Ctrl-F) on page 1 will it wander through all the pages to find it for me? As opposed to paging through all the pages manually.
  • Hiding the comments section is a nice touch. However, I copy and paste these great comments into a stock tracking software (Checklist Investor) so that all the relevant informational pieces from various sources are in one place for a specific stock. Is there any way to copy these comments? I tried right clicking on the comments logo but that didn’t have any options that copied the info.

My Response:

I’m glad you like the new breakout tracker.. I am very pleased with the way it turned out.   I hadn’t thought of what you are suggesting and glad that you did – i’m always interested in the ways that members use the service.  The most exciting part of the new tracker is the multitude of ways analyze the data.. ie. performance of stocks w/ specific ranking, avg buy volume for industries as a whole, the % of the time these breakouts reach a 20% gain vs. the % of time they hit an 8% loss, etc.  This is where the service is headed.  The overall vision is to create analytics page with all kinds of this informative info… in order to hone in on the absolute best strategy for profiting from the market.
 
Regarding your specific suggestions I will discuss them with my programmer in the coming days.  These should be fairly easy to implement.  The notes are kept in a database and it should be fairly easy to pull them out into a .CSV Excel.  What I could do is make the entire watchlist available for download as an Excel file so members can use the data in any they want to. 
[update: these features have been implemented]

Finding Opportunities, Executing the Trade (in a nutshell)

Question:

Probably the most difficult thing I have found about investing is catching
the breakouts as they are happening.  Here’s what I would find hellpful:

1.  I would like to get a glimpse into your trading room and see what it is
you are watching & doing to catch breakouts. Is there some way you could
write an article telling us in simple language — here’s how I start my day,
here’s what I watch thoughout the day, here’s what’s on my computer screen
thoughout the day,  here’s the thought process I’m going through once I spot
a possible breakout and here’s when I pull the trigger.   Maybe write an
article about a typical trading where you talk us through your day.

Its seems that there are 3 things you have to watch throughout the day to
catch a breakout as it is happening: 1) price as it approaches the pivot
point 2) A chart showing daily volume (not sure if daily or intraday, say 5
minute would be best) and 3) Volume % increase.  Are these 3 things
primarily what you are watching?  What is it you have on your screen?

I’ve thought it out and it seems like I need a 2 monitor setup to do this: 1
monitor with real time quotes on the hottest of the hot stocks plus charts
on stocks that look like the price is approaching the pivot point that day
and a second monitor where you could watch volume % increase on those
stocks.  This of course is now going to be available at SelfInvestors.com. 
By watching the price, the chart & the volume –you should be able to catch
the breakout.  Is this how you do it?  If not –how.  Could you please write
an artice on this.  I’m tired of missing breakouts & then trying to get in a
stock that’s now 3, 4 or 5% past the pivot point!!! I want to learn how to
nail the breakout!

Well, I better get to work.  I look forward to a long and profitable
relationship!  Your service is awesome!

My Response:

So, what’s my process in seeking a quality stock and executing a purchase at the breakout…
The process really starts after the market close the day before…looking at the overall health of the market, pinpointing sectors and industries leading the market, then finding the best stocks within those sectors and industries.  The design and layout of SelfInvestors is a reflection of the way I go about investing in the markets.  In fact I use the website just as you might as a member – and it has allowed me to become a much more disciplined and profitable investor.  The website has truly refined my strategy and to be honest I’m still refining that strategy every day.  Hence, the changes in the service.  I am constantly thinking about how I can make it easier to profit from the market and the tools you see now are just the beginning.  After all, the site is only 4 months old! It’s amazing to think about the process that has been made in that amount of time.. I’ve got many new features planned in the coming months!
 
Ok, enough rambling.  You asked specifically about getting in at the breakout.  I can tell you that this is the most asked question I get from members and I can understand why.  Very few have the ability to sit at their computers all day and watch the markets… even if you did, I think it’s a bad idea.  Before I get into how I go about buying the breakout and how you can best catch the breakout let me just add here how I responded to this question in the past:
See My Previous Response Here
Ok, John..on to your specific situation.   You are able to spend a couple minutes watching a stock as it approaches the pivot from what it sounds like.  I think we are in similar situations.  I certainly don’t have the time to watch real time price moves all day long either and wouldn’t recommend it if you could.  It leads to irrational decisions and sloppy trading.  In a nutshell, here’s the process I use (I like you’re idea of an article and will try and find the time in the next couple weeks to put together a more detailed approach .. how I go about using the tools at SelfInvestors and taking that info to execution of a purchase)

 
Night Before
1. Putting the daily report together keeps me focused on the health of the market and keeps me clued in to sector and industry group rotations
2.  I’ll sort by Total Rank and focus on stocks that are highly ranked and within an industry that is performing well (this sort will most likely bring up all of the "Hot" stocks as well)
3. Make a list of these stocks and take a closer look.. Is the base quiet? Does buy volume exceed sell volume? How close is the stock to breaking out? I will probably add another column to the Breakout Tracker soon – % from the pivot.. this way you can sort and get a list of stocks of stocks that are closest to breakout.  So you can be sure to focus on them the next day.
4. Once you have your list of a few stocks, you’ll enter them into a real time watchlist.   I use TCNet Platinum for this.
5. Make sure you know what the average hourly volume is for each stock as well as it’s pivot point and any support/resistance levels (keep track of this in a log book).  Keep in mind that the Breakout Tracker uses delayed quotes and is refreshed every 15 minutes.  You’ll need a real time look at volume levels when purchasing a breakout. 
 
Once you’ve got your hourly volume avg (Total avg volume/ 6.5 hrs in trading day) and your pivot point, you’ll want to set an alert (which you should be able to set through your broker or whatever trackig software you use) below the pivot point price. say 3-5% or so.  Is the stock still acting quiet?  Set another alert a bit closer.  You’ll know when the stock is getting ready to run because the volume will pick up significantly and you’ll see price shoot up, pull back quite a bit, shuffle back and forth and then take off.  This is the volatility and big volume at the breakout.  Once the stock hits the pivot, execute the trade without hesitation.  Believe in your research.. or mine:} and roll with it.  If you are wrong… and you will be some of the time, cut your loss.  If you’ll notice in the porftolio I am wrong more than I am right, but my average gain is more than double my loss for every trade I make.  All it takes is a few big winners and that’s the goal with my approach.  You must accept the fact that you may be wrong 50% of the time or even more.
  
Well, gotta run.. it’s been a long day.  I realize I may have rambled here.. maybe even to the point of incoherency. Please let me know if you have any further questions and thanks for being a part of SelfInvestors.. have a nice weekend!

ETF, IPO & Breakout Stocks Analysis, Tracking & Research