Category Archives: Weekly/After Stock Market Review Archives

Every Sunday evening a full market review is sent to members of SelfInvestors.com which provides commentary on the technical and economic picture, a review of the SelfInvestors Model Portfolio, the best/worst performing industries and ETF’s for the week, IPOs to watch, upcoming economic reports as well as notable earnings reports. In addition, on days when the market makes a significant move I’ll highlight the technical action discussing price/volume movements and support/resistance levels, industries/sectors leading and lagging the market as well as a Stock of the Day. In the past these were sent in the middle of the trading day but I’ve since begun publishing them and sending them to members after the market closes. These reports will be archived here as well.

Bulls Losing Grip; Hot IPO – Spreadturn Communications (SPRD)

After a week of vacation, it’s going to take me a couple of days to get my head around this market so no detailed commentary for this week.  A quick look at the charts reveals a continuation of a dead cat bounce early in the week, followed by more big distribution (Wednesday & Friday).  Clearly, the big fellas are continuing to dump positions at these levels, but the technical damage has been relatively contained up to this point.  The S&P dipped below support of the 50 day moving average, but both the Dow and Nasdaq have retained their support levels… for now.  The downside momentum on Friday was significant, indicating further weakness ahead for the market.  I still believe that the S&P and Dow will test support of their February highs at some point.

::: Model Portfolio Update :::

I wasn’t actively trading the portfolio while on vacation this week, so just one transaction was made.  I locked in a 19% profit in my Mastercard (MA) position.  I’ve been mentioning that I hadn’t been in synch with the market during the April/May run and missed out on much of the opportunity.  However, I’m getting back in synch in the past couple weeks and the portfolio is getting in line with the performance of the overall market with a 5.2% YTD gain.  I remain confident that I can significantly outperform the S&P again this year despite the April/May set back.  Currently, the overall allocation remains a bit biased on the long side with 56% long, 24% short and 20% cash.

::: Best/Worst Performers :::

– Top 10 Performing Industries For the Week –

1. Industrial Equipment Wholesale: 5.40%
2. Internet Info Providers: 4.65%
3. Auto Dealerships: 3.25%
4. Agricultural Chemicals: 2.85%
5. Semiconductor – Memory Chips: 2.75%
6. Major Airlines: 2.35%
7. Printed Circuit Boards:  2.35%
8. Regional Airlines: 1.90%
9. Data Storage Devices: 1.75%
10. Oil & Gas Drilling & Exploration: 1.60%

– Top 10 Worst Performing Industries For the Week –

1. REIT – Retail: -5.80%
2. Drug Related Products: -5.60%
3. Investment Brokerage: -5.50%
4. Specialty Eateries: -5.30%
5. REIT – Healthcare Facilities: -5.20%
6. REIT – Diversified Industrial: -5.15%
7. Personal Service: -4.95%
8. General Contractors: -4.40%
9. REIT – Offices: -4.35%
10. Water Utilities: -4.35%

– Top 5 Best Performing ETFs For the Week –
 
1. Herzfeld Caribbean Basin (CUBA)  6.00%
2. Morgan Stanley China (CAF) 5.50%
3. Ishares China (FXI) 4.75%
4. Morgan Stanley India (IIF) 3.70%
5. Powershares China (PGJ) 3.25%

– Worst 5 Performing ETF’s –

1. Chile Fund (CH)  -7.00%
2. Ishares Realty (ICF) -4.65%
3. SPDR Utilities (XLU) -4.30%
4. Powershares Agriculture (DBA) -4.25%
5. Powershares Biotech (PBE) -4.20%

:::  IPO’s Worth Watching for This Week :::

Another hot China IPO hits the market this week – this time in wireless communications.

1. Spreadturn Communications (SPRD):  China-based fabless semiconductor company that designs baseband processor solutions for the wireless communications market. The company offers a portfolio of highly integrated baseband processor solutions that support a broad range of wireless communications standards, including GSM, GPRS and TD-SCDMA, an international 3G standard for wireless communications promoted by China.  Trading set to begin on Wednesday.

2. comScore (SCOR):  provider of digital marketing intelligence platforms. The company’s products enable its users to measure their Internet usage patterns, online and certain offline buying behavior and other activities, and it lets comScore project consumers’ online behavior.  Trading set to begin on Thursday.

3. ShoreTel (SHOR):  provider of Internet Protocol telecommunications systems. The company’s systems are based on its own distributed software architecture and switch-based hardware platform, which allows multi-site enterprises to be served by a single telecommunications system.  Trading set to begin on Thursday.

4. Data Domain (DDUP): provider of capacity-optimized storage appliances for disk-based backup and network-based disaster recovery. The company’s storage solutions address protection storage requirements with low operating costs, ease of use, high performance, reliability and compatibility with leading enterprise backup software using its Global Compression technology with industry standard components  The company is not yet profitable but growing quickly.  Trading set to begin on Wednesday.

5. PROS Holdings (PRO):  software provider of applications allowing companies to improve financial performance by enabling better pricing. PROS offers its software products to about 90 clients across five industries in 42 countries.  Trading set to begin on Thursday.

::: Upcoming Economic Reports (6/25/07 – 6/29/07) :::

Monday:        Existing Home Sales
Tuesday:       New Home Sales, Consumer Confidence
Wednesday:  Durable Orders, Crude Inventories
Thursday:      GDP (final), Initial Claims, FOMC Rate
Friday:           Personal Income, Personal Spending, Core PCE Inflation, Chicago PMI,
                      Construction Spending

::: Notable Upcoming Earnings Reports I’ll Be Watching This Week :::

Tuesday: Oracle (ORCL)
Thursday: Research in Motion (RIMM)
Indices Break Short Downward Trend; Stock of Day – Lifecell (LIFC)

I don’t know about you, but a bit of motion sickness is setting in.  Today marks the 5th 100 point move or greater in the Dow in the last 6 trading days as bulls and bears battle it out.  There wasn’t a ton of conviction behind today’s move but it was enough to call it a day of accumulation and indicate that the bulls aren’t going to roll over and play dead just yet.  With the indices breaking out of their short term downward trends, we could see further upside pressure but keep in mind important inflation numbers come tomorrow and Friday so anything is possible.  At this point, the market is still in decent shape (never even got close to breaking support of the 50 dma), but the bias is still bearish, so continue to be cautious out there.

::: Major Indices Performance – The Numbers :::

(Note: volume averages are based on the average over the past 50 days)
Data as of 4:00EST – End of Day June 13th 2007

Accumuluation across all indices.

Nasdaq: UP 1.28% today with volume 5% ABOVE  average
Nasdaq ETF (QQQQ) UP 1.1%, volume 32% ABOVE average
Dow: UP 1.41%, with volume 12% ABOVE the average
Dow ETF (DIA): UP 1.41%, volume 54% ABOVE the average
S&P ETF (SPY): UP 1.50%, volume 74% ABOVE the average
Russell Small Cap ETF (IWM): UP 1.32%, volume 81% ABOVE the average

::: SelflInvestors Leading Stocks :::

The Self Investors Leading Stocks Index is comprised of stocks in the Breakout Tracker, which is a database of the fastest growing companies near a breakout or having already broken out of a base.  Leading stocks did very well in terms of price performance today vaulting 1.53%, but just as with the overall market, there wasn’t much conviction behind the move.
Summary:

* Advancers led Decliners 351 to 62
* Advancers were up an average of 2.05% today, with volume 1% ABOVE average
* Decliners were down an average of 1.39% with volume 7% ABOVE average
* The total SI Leading Stocks Index was UP 1.24% today with volume 5% ABOVE average

::: Where’s the Money Flowing :::

Many investing websites provide leading industries based on price performance alone. However, without accompanying volume levels, this can sometimes be misleading.  The only way that I know of to gauge industry/sector strength WITH volume levels is through the analysis of ETF’s.  A couple years ago this was not possible, but as more traders/investors use ETF’s they become a much better tool for gauging the health of the market and seeing where the money is flowing (or not flowing).  Using the proprietary SelfInvestors Demand Indicator score which measures price and volume movements, I’m able to quickly see which sectors/industries are seeing the greatest inflows of cash.  For a detailed look at how I go about gauging sector/industry strength please see the following post: http://selfinvestors.com/si/industry_tracking/

* Current Leading Sectors/Industries (over last 30 trading days): 
Internet, Agriculture, Technology, Software, Telecom, Networking
(it’s all about tech right now!)   
                                          
* Current Lagging Sectors/Industries (over last 30 trading days): 
REIT, Real Estate, Realty, Gold Miners, Global Dividend

* Today’s Market Moving Industries/Sectors (UP):
Oil & Gas Services, Realty, Industrial, Materials, REIT, Utilities

* Today’s Market Moving Industries/Sectors (DOWN):
None

::: Stocks :::

The stocks section will be an area where I highlight one stock selected from a group of stocks moving up with volume well above average and most likely breaking out of a base or consolidation.  Today’s stock is one of the highest rated biotechs that I  track – Lifecell (LIFC) which broke out of cup with handle base today following news of FDA approval for a new tissue graft made from pigs.

ABOUT:  LifeCell Corporation develops and markets tissue-based products for use in reconstructive, orthopedic and urogynecologic surgical procedures to repair soft tissue defects. The CompanyGÇÖs products include AlloDerm, for plastic reconstructive, general surgical, burn and periodontal procedures; Cymetra, a particulate form of AlloDerm suitable for injection; GraftJacket and GraftJacket Xpress, for orthopedic applications and lower extremity wounds; AlloCraftDBM, for bone grafting procedures, and Repliform, for urogynecologic surgical procedures. The Company’s tissue process technology produces a regenerative tissue matrix, a three- structure that contains proteins, growth factor binding sites and vascular channels that provide a template for the regeneration of normal human tissue. It markets AlloDerm in the United States for plastic reconstructive, general surgical and burn applications through a direct sales and marketing organization.

FUNDAMENTALS: LIFC is a company with a history of posting excellent growth.  Over the past 3 years, the company has posted year over year earnings growth of 180%, 100% and 111%.   Sales growth has been impressive as well, with consistent sales growth in the neighborhood of 50% in that time.  With this kind of growth it’s no surprise that margins and ROE are well above industry averages.  I like to see net margin a bit higher for leading companies, but 15% is quite good.  ROE has been rising steadily for several years and sits at around 19%.

TECHNICAL:  The stock just cleared a handle formation intraday with volume more than double the average,  resulting in a successful technical breakout from a cup with handle base.  It finished the day right at the high of the handle.  Overall, this can be a volatile stock at times and the big, high volume drop in the left side of the base back in October is of some concern.  However, initiating a small position and using a tight stop may prove to be a worthy trade.  After all, this is a company with a proven history of outstanding growth.

SELFINVESTORS RATING: With a total score of 48/60 (27/30 for fundamentals, 21/30 for technical), Lifecell (LIFC) is a very good breakout stock.

Full Disclosure/Disclaimer: The stock of the day is by no means a buy recommendation.  Please do your own research and make a personal decision based on your own tolerance for risk.  I currently do not own a position in Lifecell (LIFC).

Institutions Still Selling Into Rallies, But Support Near

Today marked the end of a classic suckers rally, dead cat bounce.. whatever you want it to call it.  Just as we saw on Monday, the big fellas (institutions) sold into the rally toward the end of the day.  The only difference between today and yesterday is that the selling today was a bit more intense although not alarming.  The good news is that the indices are right at key support levels, so there isn’t reason to be overly concerned about this market falling apart at this point.  We’ll just have to see how the indices trade around key support of the 50 day moving average tomorrow.  At this point, it’s a bit too late to be getting into new short positions and a bit too early to initiate new longs, so sit tight for now.  If we get a big move down at the open tomorrow, I will be shopping a bit on the long side.

::: Major Indices Performance – The Numbers :::

(Note: volume averages are based on the average over the past 50 days)
Data as of 4:00EST – End of Day June 12th 2007

Distribution across all indices.

Nasdaq: DOWN .87% today with volume 5% ABOVE  average
Nasdaq ETF (QQQQ) DOWN .6%, volume 38% ABOVE average
Dow: DOWN .97%, with volume 3% ABOVE the average
Dow ETF (DIA): DOWN .98%, volume 82% ABOVE the average
S&P ETF (SPY): DOWN 1.09%, volume 115% ABOVE the average
Russell Small Cap ETF (IWM): DOWN 1.64%, volume 79% ABOVE the average

::: SelflInvestors Leading Stocks :::

The Self Investors Leading Stocks Index is comprised of stocks in the Breakout Tracker, which is a database of the fastest growing companies near a breakout or having already broken out of a base.  Leading stocks while down significantly did not get hit with any conviction.  Today saw constructive selling in leading stocks.

Summary:

* Decliners led Advancers 337 to 76
* Advancers were up an average of .91% today, with volume 14% ABOVE average
* Decliners were down an average of 1.72% with volume 7% BELOW average
* The total SI Leading Stocks Index was DOWN 1.24% today with volume 3% BELOW average

::: Where’s the Money Flowing :::

Many investing websites provide leading industries based on price performance alone. However, without accompanying volume levels, this can sometimes be misleading.  The only way that I know of to gauge industry/sector strength WITH volume levels is through the analysis of ETF’s.  A couple years ago this was not possible, but as more traders/investors use ETF’s they become a much better tool for gauging the health of the market and seeing where the money is flowing (or not flowing).  Using the proprietary SelfInvestors Demand Indicator score which measures price and volume movements, I’m able to quickly see which sectors/industries are seeing the greatest inflows of cash.  For a detailed look at how I go about gauging sector/industry strength please see the following post: http://selfinvestors.com/si/industry_tracking/

* Current Leading Sectors/Industries (over last 30 trading days): 
Internet, Agriculture, Technology, Aerospace/Defense, Telecom
                                              
* Current Lagging Sectors/Industries (over last 30 trading days): 
REIT, Real Estate, Realty, Gold Miners, Broadband

* Today’s Market Moving Industries/Sectors (UP):
None

* Today’s Market Moving Industries/Sectors (DOWN):
Nanotech, Real Estate, Gold Miners, Oil & Gas Services

::: Stocks :::

The stocks section will be an area where I highlight one stock selected from a group of stocks moving up with volume well above average and most likely breaking out of a base or consolidation. 

Very few stocks moved up with volume today – no stock of the day.

Market Topping Action; Utilities Get Whacked Again

The market this week got a dose of reality as traders began to question the reasons for running this market up in an environment of slowing economic growth, higher interest rates, inflation concerns and a continuing housing slump.  The merger mania over the past several months has been able to avert attention away from these underlying problems, but that can only prop up the market for so long.  Long term rates surging last week put it on the radar and was the "headliner" of the week.  That probably means it’s not going to move higher over the next several weeks, but the long term  trend in rates off a 2003 low has certainly been up. How long can the almighty consumer continue their spending ways in this kind of environment?  Probably not much longer. 

It’s important to realize that while the market has priced in the majority of the housing slump, it has not at all priced in concerns over the consumer.  With the exception of a very weak retail number in April (which appeared to be an aberration at this point) retail numbers have not been consistently weak.  However, recent poor numbers from Walmart indicate that trouble may lie ahead.   If and when the market begins to price in consumer concerns, it could get ugly.  Wow, do you I sound bearish.. and I consider myself a bull at heart!  I want stocks to go up .. really I do.

If you’ve been reading my reports over the past few years you probably know I rarely discuss the economy.  Today, I just felt the need to ramble and rant a bit.  The reason I don’t concern myself too much with the latest economic numbers and predictions is fairly simple.  The market does a good job of pricing in these events well before they occur.  So, by reading the price and volume movements of the charts of the major indices we can gauge with some degree of certainty just how well the economy WILL be doing.  At the risk of sounding like a broken record, I have been mentioning for at least a few weeks that the market is getting fatigued and that all signs point to institutions selling into any rallies.  Price and volume movements (higher volume selling, lower volume buying and high volume churn) over the past few weeks predicted a looming sell off of some degree. 

It’s important to remember that bull runs like we had don’t just roll over and die.  After all, institutions need more time to unload all those large positions and get more defensive.  After we stabilize following the selling of last week, the market could very well retest those highs.  However, I do think those early June highs mark a top for at least several months.

Market Action This Week: Decidedly Bearish
Outlook for the Next Month: Leaning Bearish


::: Model Portfolio Update :::

With the long overdue selling setting in, the portfolio is beginning to  get in better synch with this market and beginning to close the gap of underperformance.  I mentioned last week that I began getting short way too early and that hurt my performance, however I expect my current positions/strategy to begin paying dividends.  During the week, I closed out two very small position in NVEC for a 2% loss and JOBS, a quick strike profit play for a 6% loss.  These were replaced with 2 stronger, very small long positions in high quality names.  Both held up remarkably well during the week – in fact one of the positions actually finished with a gain with volume on Thursday.  Sometimes you get lucky.  I did add another short position to the portfolio as well, bringing the total short allocation to about 35%.  About 50% remains on the long side (15% of that is in Google) with a 15% cash position.  The portfolio was off just .2% last week, but still significantly lags the S&P with a
 3.5% YTD return.  I’ve certainly got my work cut out for me if I’m going to whoop the S&P again this year.

::: Best/Worst Performers :::

– Top 10 Performing Industries For the Week –

1. Personal Computers: 3.30%
2. Music & Video Stores: 1.90%
3. Medical Practitioners: 1.60%
4. Data Storage Devices: 1.20%
5. Diversified Electronics: .55%
6. Discount – Variety Stores: .55%
7. Catalogue & Mail Order Houses:  .35%
8. Education & Training Services: .35%
9. Consumer Services: .30%
10. Computers Wholesale: .25%

– Top 10 Worst Performing Industries For the Week –

1. Health Care Plans: -8.80%
2. Major Airlines: -6.45%
3. Diversified Utilities: -5.80%
4. Shipping: -5.75%
5. Pollution & Treatment Controls: -5.45%
6. Electric Utilities: -5.30%
7. Dairy Products: -4.90%
8. REIT – Healthcare Facilities: -4.90%
9. Manufactured Housing: -4.85%
10. Specialty Eateries: -4.80%

– Top 5 Best Performing ETFs For the Week –
 
1. Herzfeld Caribbean Basin (CUBA)  4.25%
2. Chile Fund (CH) 3.05%
3. China Fund (CHN) 1.55%
4. Ishares South Korea (EWY) 1.10%
5. Ishares China (FXI) 1.05%

– Worst 5 Performing ETF’s –

1. SPDR Select Utilities (XLU)  -5.60%
2. Ishares Germany (EWG) -5.45%
3. PowerSharers Dynamic Utilities (PUI) -5.40%
4. HLDRS Utilities (UTH) -5.25%
5. Ishares Utilities (IDU) -5.10%

:::  IPO’s Worth Watching for This Week :::

No solar IPO’s this week, but a new ethanol IPO should get some undeserved attention.

1. GeoVera Insurance Holdings (GEOV): The company focuses on providing specialty homeowners and residential earthquake insurance. GeoVera sells its products in states prone to these natural disasters in the northwestern and southeastern US. First established in 1993 as a division of United States Fidelity and Guaranty Company, GeoVera distributes its products through a network of more than 1,600 brokers and agents.  The company has seen rapid growth over the past couple years.  Trading set to begin on Wednesday.

2. Biofuel Energy (BIOF):  The ethanol upstart is set to begin construction on the company’s first two (out of six total) plants, in Nebraska and Minnesota, is under way and should be completed in early 2008. Its remaining facilities (Iowa, Illinois, Kansas) are scheduled to begin construction in 2007; the sixth will serve as an alternate plant. Annually, BioFuel’s plants are expected to produce 575 million gallons of ethanol and 1.8 million tons of distillers grain (ethanol manufacturing process byproduct used in animal feed). The company is partnering with agribusiness giant Cargill, which gives it reliable corn supplies, an established logistics/transportation network, and marketing expertise.  Trading set to begin on Tuesday.

::: Upcoming Economic Reports (6/11/07 – 6/15/07) :::

Monday:        None
Tuesday:       Treasury Budget
Wednesday:  Fed Beige Book, Export/Import Prices, Retail Sales, Crude Inventories
                      Business Inventories
Thursday:      PPI, Initial Claims
Friday:           CPI, Capacity Utilization

::: Notable Upcoming Earnings Reports I’ll Be Watching This Week :::

Monday: Jos Bank (JOSB)
Thursday: Goldman Sachs (GS), Bear Stearns (BSC)

::: In Case You Missed It – SelfInvestors Blog Entries of the Past Week :::

1. Unintended Consequences of the Ethanol Boom
https://selfinvestors.com/tradingstocks/news/unintended-consequences-of-the-ethanol-boom/

2. Selling Intensifies But Critical Support Near
https://selfinvestors.com/tradingstocks/weeklyafter-stock-market-review-archives/selling-intensifies-but-critical-support-near/

3. Precarious Economy; Stock of Day – Intercontinental Exchange (ICE)
https://selfinvestors.com/tradingstocks/weeklyafter-stock-market-review-archives/precarious-economy-stock-of-day-intercontinental-exchange-ice/

4. More Distribution, But Relatively Healthy Selling
https://selfinvestors.com/tradingstocks/weeklyafter-stock-market-review-archives/more-distribution-but-relatively-healthy-selling/

5. IPO Lockup Dates (June 5 – 8)
https://selfinvestors.com/tradingstocks/ipos/ipo-lockup-dates/ipo-lockup-dates-june-5-8/

6. Stock Spam in Major Financial Publications!
https://selfinvestors.com/tradingstocks/news/stock-spam-promotion-in-major-financial-publications-guangzhou-global-gzgt/

Selling Intensifies, But Critical Support Near

I mentioned that the selling of the past two days was relatively orderly and healthy action.   That was not even close to the case today.  But you have been ready (if you’ve been reading these reports 🙂 right!?  After all, with price and volume movements indicating that the big fellas were selling into rallies over the past few weeks, it was just a matter of time before the dip buyers cried uncle and the bottom fell out..  That’s where we’re at.  Now we  turn our attention to critical support areas nearby.

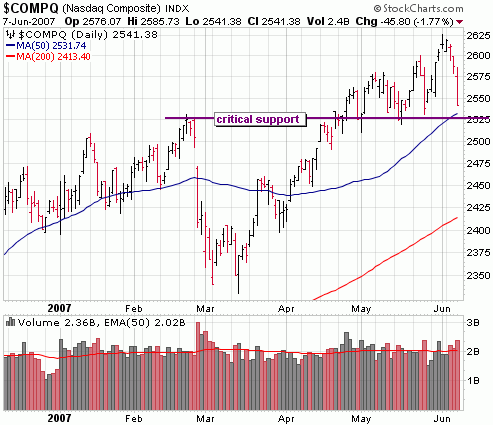
In a chart of the Nasdaq below, you can see that after 3 days of selling we are now quite close to the critical support area right around those February highs.  I actually expected the sell volume to be a bit heavier today, but it’s probably still enough to test that critical level of support tomorrow at some point.

nasdaq chart support lines

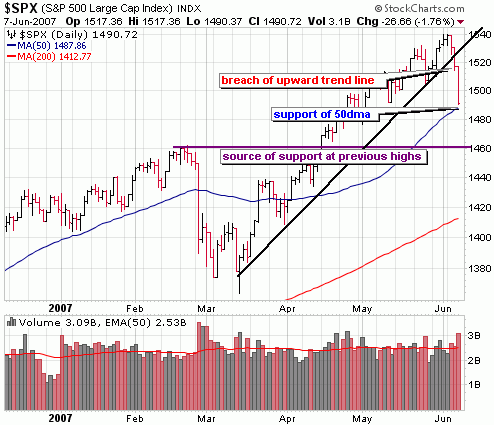
The S&P nearly hit that 50 day moving average today.  Looks to me like a runaway train and will ultimately take out that level of support at some point tomorrow (doesn’t mean it can’t finish above though).    Keep in mind, that we could see another 30 point drop in the S&P500 and still be in great shape technically!  That’s how overbought this market waswhy I’ve been preaching caution.  It’s a long ways down!

s&p500 chart support

::: Major Indices Performance – The Numbers :::

(Note: volume averages are based on the average over the past 50 days)
Data as of 4:00EST – End of Day June 7th 2007

Heavy distribution across all indices.

Nasdaq: DOWN 1.77% today with volume 20% ABOVE  average
Nasdaq ETF (QQQQ) DOWN 1.55%, volume 155% ABOVE average
Dow: DOWN 1.48%, with volume 24% ABOVE the average
Dow ETF (DIA): DOWN 1.46%, volume 147% ABOVE the average
S&P ETF (SPY): DOWN 1.80%, volume 119% ABOVE the average
Russell Small Cap ETF (IWM): DOWN 2.0%, volume 83% ABOVE the average

::: SelflInvestors Leading Stocks :::

The Self Investors Leading Stocks Index is comprised of stocks in the Breakout Tracker, which is a database of the fastest growing companies near a breakout or having already broken out of a base.  No suprise that leading stocks got whacked today, down more than 2% with considerable volume.  Decliners over advancers nearly 10:1! 

Summary:

* Decliners led Advancers 376 to 38
* Advancers were up an average of .83% today, with volume 56% ABOVE average
* Decliners were down an average of 2.46% with volume 17% ABOVE average
* The total SI Leading Stocks Index was DOWN 2.16% today with volume 21% ABOVE the average

::: Where’s the Money Flowing :::

Many investing websites provide leading industries based on price performance alone. However, without accompanying volume levels, this can sometimes be misleading.  The only way that I know of to gauge industry/sector strength WITH volume levels is through the analysis of ETF’s.  A couple years ago this was not possible, but as more traders/investors use ETF’s they become a much better tool for gauging the health of the market and seeing where the money is flowing (or not flowing).  Using the proprietary SelfInvestors Demand Indicator score which measures price and volume movements, I’m able to quickly see which sectors/industries are seeing the greatest inflows of cash.  For a detailed look at how I go about gauging sector/industry strength please see the following post: http://selfinvestors.com/si/industry_tracking/

* Current Leading Sectors/Industries (over last 30 trading days): 
Networking, Agriculture, Aerospace/Defense, Water/Resources, Technology, Broker/Dealers
                                              
* Current Lagging Sectors/Industries (over last 30 trading days): 
Realty, Gold Miners, REIT’s, Global Dividend, Broadband, Biotech

* Today’s Market Moving Industries/Sectors (UP):
Agriculture – that’s impressive!

* Today’s Market Moving Industries/Sectors (DOWN):
Home Construction, Utilities, Gold Miners, Realty

::: Stocks :::

The stocks section will be an area where I highlight one stock selected from a group of stocks moving up with volume well above average and most likely breaking out of a base or consolidation. 

No stock of the day today – just one stock in my entire database of over 400 leading companies moved up signficantly with volume today: Green Mountain Coffe (GMCR). 

Precarious Economy; Stock of Day – Intercontinental Exchange (ICE)

My how quickly hopes and predictions have changed.  Wasn’t it just several days ago the market was rocking and rolling higher to new highs on predictions of rate cuts?  With bond yields rising, prospects for a Fed rate cut all but gone, inflation still a major concern, still no signs of an improving housing sector and GDP growth expectations revised lower, all of a sudden traders may be questioning the run we’ve had.  The bottom line is that the economy is in a precarious position and we don’t really know how bad inflation will be or how long housing will slump.   With big profits in hand, the big fellas will most likely continue taking some chips off the table and hold steady for a more defined picture of inflation, of housing, of our economy. 

On a technical note, the selling today wasn’t severe panic selling.  It was actually quite orderly considering the run up we’ve had. The S&P did take out support of its upward trend line again, but the Dow is holding at that level .. for now.  Considering there was distribution in the Dow today (none in the Nasdaq and S&P), it appears there is enough momentum to take out that level of support soon.  All in all, it was another healthy, constructive day of selling. 

::: Major Indices Performance – The Numbers :::

(Note: volume averages are based on the average over the past 50 days)
Data as of 4:00EST – End of Day June 6th 2007

Ony distribution in the Dow today, however significant distribution across all of the major index tracking ETF’s – QQQQ, SPY and DIA

Nasdaq: DOWN .92% today with volume 5% ABOVE  average
Nasdaq ETF (QQQQ) DOWN 1.07%, volume 71% ABOVE average
Dow: DOWN .95%, with volume 4% ABOVE the average
Dow ETF (DIA): DOWN 1.1%, volume 45% ABOVE the average
S&P ETF (SPY): DOWN 1.07%, volume 56% ABOVE the average
Russell Small Cap ETF (IWM): DOWN 1.11%, volume 55% ABOVE the average

::: SelflInvestors Leading Stocks :::

The Self Investors Leading Stocks Index is comprised of stocks in the Breakout Tracker, which is a database of the fastest growing companies near a breakout or having already broken out of a base.  Leading stocks were hit a bit harder than the major indices today, but sellling volume wasn’t severe.

Summary:

* Decliners led Advancers 348 to 66
* Advancers were up an average of 1.04% today, with volume 17% ABOVE average
* Decliners were down an average of 1.71% with volume 1% ABOVE average
* The total SI Leading Stocks Index was DOWN  1.27% today with volume 3% ABOVE the average

::: Where’s the Money Flowing :::

Many investing websites provide leading industries based on price performance alone. However, without accompanying volume levels, this can sometimes be misleading.  The only way that I know of to gauge industry/sector strength WITH volume levels is through the analysis of ETF’s.  A couple years ago this was not possible, but as more traders/investors use ETF’s they become a much better tool for gauging the health of the market and seeing where the money is flowing (or not flowing).  Using the proprietary SelfInvestors Demand Indicator score which measures price and volume movements, I’m able to quickly see which sectors/industries are seeing the greatest inflows of cash.  For a detailed look at how I go about gauging sector/industry strength please see the following post: http://selfinvestors.com/si/industry_tracking/

* Current Leading Sectors/Industries (over last 30 trading days): 
Semiconductors, Transports, Agriculture, Networking, Aerospace/Defense
                                              
* Current Lagging Sectors/Industries (over last 30 trading days): 
Realty, Broadband, Biotech

* Today’s Market Moving Industries/Sectors (UP):
None

* Today’s Market Moving Industries/Sectors (DOWN):
Global Dividend, Oil & Gas Services, Real Estate, Transports, Utilities

::: Stocks :::

The stocks section will be an area where I highlight one stock selected from a group of stocks moving up with volume well above average and most likely breaking out of a base or consolidation.  Today’s stock is Intercontinental Exchange (ICE), which is threatening a breakout from a nice looking second stage base.

ABOUT:  IntercontinentalExchange, Inc. (IntercontinentalExchange) operates as an electronic global futures and over-the-counter (OTC) marketplace for trading an array of energy products. The Company also operates as a soft commodities exchange. IntercontinentalExchange offer an integrated electronic platform for side-by-side trading of energy products in both futures and OTC markets. Through its electronic trading platform, the CompanyGÇÖs marketplace brings together buyers and sellers of derivative and physical commodities contracts. Intercontinental Exchange also offers open-outcry trading in Board of Trade of the City of New York, Inc.GÇÖs (NYBOT) regulated futures and options markets. The Company conducts its OTC business directly and its regulated energy futures business through its wholly owned subsidiary, ICE Futures. It operates in three segments: energy futures, OTC and market data. On January 12, 2007, IntercontinentalExchange acquired NYBOT.

FUNDAMENTALS: ICE is a company with a tremendous acceleration in earnings growth over the last 3 years with year over year growth  67%, 140% and 150%.  The ramp up in  growth isn’t expected to continue, but ’07 and ’08 earnings growth still call for a very impressive growth rate of 40 – 50%.  Net margins are a whopping 45% and ROE, while below industry averages is excellent at around 24%.  With many new positions added over the past year, institutions like what they see in the company.  It’s clear why ICE has been one of the highest rated stocks in the SelfInvestors.com database for a long time.

TECHNICAL:  ICE broke out of its first base since going public back in October of 2006 and quickly doubled in price.  Since February, it’s been digesting those gains constructively with a tight, healthy looking base.  Today, the stock briefly broke out of a nice handle formation near the end of the day before pulling back a bit.  It still looks poised to bust through that level (153.36) and tackle all time highs of 167 very soon.

SELFINVESTORS RATING: With a total score of 52/60 (27/30 for fundamentals, 25/30 for technical), ICE is currently the second highest rated stock in the SelfInvestors.com Breakout Tracker.

Full Disclosure/Disclaimer: The stock of the day is by no means a buy recommendation.  Please do your own research and make a personal decision based on your own tolerance for risk.  I currently do own a small position in Intercontinental Exchange (ICE)

More Distribution, But Relatively Healthy Selling

Continuing the trend of the past few weeks, the market looked tired again today as concerns about rising bond yields and the diminishing possibility of a rate cut left traders with an itch to take some profits off the table.  While technically it was another day of distribution, it wasn’t as bad as it could have been.  Selling volume wasn’t all that severe in the S&P and Dow and the Nasdasq finished well off the lows.  I’d call this relatively healthy selling today and wouldn’t mind seeing a few more of these in the coming days to wring out the excess a bit.  Enjoy the rest of your night.

::: Major Indices Performance – The Numbers :::

(Note: volume averages are based on the average over the past 50 days)
Data as of 4:00EST – End of Day June 5th 2007

Distribution across all indices but not at all severe – actually quite healthy considering the run we’ve had.

Nasdaq: DOWN .27% today with volume 10% ABOVE average
Nasdaq ETF (QQQQ) DOWN .13%, volume 44% ABOVE average
Dow: DOWN .59%, volume was 2% BELOW the average
Dow ETF (DIA): DOWN .42%, volume 31% ABOVE the average
S&P ETF (SPY): DOWN .4%, volume 22% ABOVE the average
Russell Small Cap ETF (IWM): DOWN .40%, volume 40% ABOVE the average

::: SelflInvestors Leading Stocks :::

The Self Investors Leading Stocks Index is comprised of stocks in the Breakout Tracker, which is a database of the fastest growing companies near a breakout or having already broken out of a base.  Leading stocks held up quite well today and were about in line with the Nasdaq. 

Summary:

* Decliners led Advancers 266 to 148
* Advancers were up an average of 1.22% today, with volume 24% ABOVE average
* Decliners were down an average of 1.15% with volume 6% BELOW average
* The total SI Leading Stocks Index was DOWN just .3% today with volume 4% ABOVE the average

::: Where’s the Money Flowing :::

Many investing websites provide leading industries based on price performance alone. However, without accompanying volume levels, this can sometimes be misleading.  The only way that I know of to gauge industry/sector strength WITH volume levels is through the analysis of ETF’s.  A couple years ago this was not possible, but as more traders/investors use ETF’s they become a much better tool for gauging the health of the market and seeing where the money is flowing (or not flowing).  Using the proprietary SelfInvestors Demand Indicator score which measures price and volume movements, I’m able to quickly see which sectors/industries are seeing the greatest inflows of cash.  For a detailed look at how I go about gauging sector/industry strength please see the following post: http://selfinvestors.com/si/industry_tracking/

* Current Leading Sectors/Industries (over last 30 trading days): 
Semiconductors, Transports, Agriculture, Networking, Nanotech, Aerospace/Defense
                                              
* Current Lagging Sectors/Industries (over last 30 trading days): 
Bonds

* Today’s Market Moving Industries/Sectors (UP):
None today

* Today’s Market Moving Industries/Sectors (DOWN):
Real Estate, Home Construction, Utilities

::: Stocks :::

The stocks section will be an area where I highlight one stock selected from a group of stocks moving up with volume well above average and most likely breaking out of a base or consolidation. 

Sorry, short on time tonight so no stock of the day, but take a look at these top rated stocks that moved with volume today – Sunpower (SPWR), Health Grades (HGRD) and Internet Gold (IGLD)
* Internet Gold was a recent Stock of the Day pick.

S&P500 Recaptures Trendlines, Market Remains Fatigued; China Solar IPO – Yingli Green Energy (YGE)

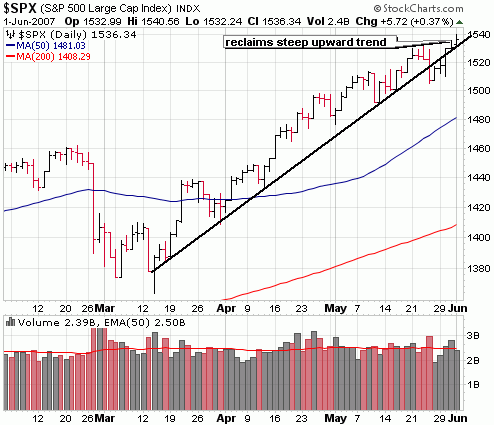
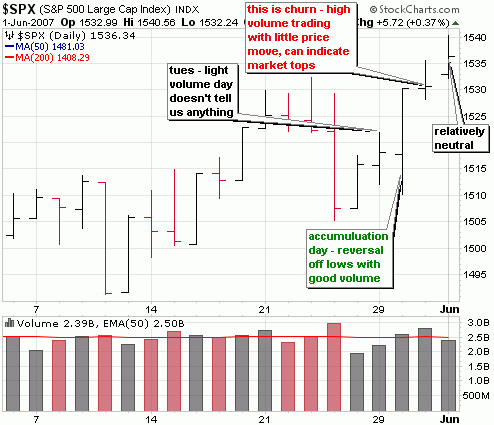
I think I’ve mentioned before that this is beginning to feel like a game of musical chairs, trying to squeeze out a few more profits on the long side before the music stops.  On Wednesday morning, the jukebox received a jolt after China’s attempt to curb the speculative, trading mania which sent a quick shiver to world markets.  However, just as has been the case over the past few months, the music continued to play and bulls were dancing.  How long can buyers aggressively buy these dips?  Nobody can say for sure, but as I mentioned in a report several days ago, the market was indicating significant fatigue.  (see  https://selfinvestors.com/tradingstocks/weeklyafter-stock-market-review-archives/the-selling-was-coming-you-were-ready/) I mentioned in that report that the S&P had taken out its upward trend line with volume but that I wouldn’t be suprised if the market shrugged off this technical damage once again.  It did and the S&P reclaimed that trendline this week.  Go figure.  However, the fatigue is still in place.  One thing that stood out to me last week was the high volume price churn on Thursday which can be a good indicator of a market top.  Here’s a look at the S&P:

You see on the daily that the S&P did reclaim that upward trend line.

S&P500

Looking at the price/volume action in the S&P over the course of the week, I’d call it net neutral.  A bullish reversal on Wednesday, followed by that churn day on Thursday.. Tuesday and Friday were fairly meaningless.

My motto remains the same – be careful out there right now. While there remains short  term trading opportunities on the long side, it’s not a bad idea to sit in cash.  Avoid the feelings of potentially "missing out".  Patience.

::: Model Portfolio Update :::

The portfolio remains a bit out of synch with this market and continues to have trouble gaining any traction as  I continue not making large bets on the long side and holding steady with some short positions.  While my approach has been unsuccessful over the past several weeks, there will be better times ahead.  Such is trading.  The important thing for me is to trust my analsyis and realize I won’t be right all the time.  Trying to make up for a lack of performance with aggressive buying at this stage could be a recipe for disaster.  During the week, there were a few minor transactions in the portfolio.  I closed one position when I  covered my GTI short for a 4% loss.  On the long side, I added to my long term Google position which now represents about 15% of the portfolio.  I will be looking to up that to 20% if it can break out and hold above its all time high of 513.  I also added a short term long trade, looking for a quick 10 – 15% profit.  Current allocation of the portfolio stands at 51% long, 29% short and 20% cash.

::: Best/Worst Performers :::

– Top 10 Performing Industries For the Week –

1. REIT – Residential: 10.90%
2. Technical Services: 9.20%
3. Copper: 8.90%
4. Nonmetallic Mineral Mining: 8.65%
5. Steel & Iron: 8.05%
6. Silver: 7.65%
7. REIT – Hotel/Motel:  7.60%
8. Processing Systems & Products: 7.50%
9. Electronic Stores: 7.20%
10. Industrial Metals & Minerals: 6.70%

– Top 10 Worst Performing Industries For the Week –

1. Residential Construction: -2.80%
2. Long Distance Carriers: -1.10%
3. Toy & Hobby Stores: -.30%
4. Broadcasting Radio: -.30%
5. Jewelry Stores: -.25%
6. Drug Manufacturers Major: -.25%
7. Music & Video Stores: -.20%
8. Education & Training Services: .05%
9. Toys & Games: .10%
10. Mortgage Investment: .15%

– Top 5 Best Performing ETFs For the Week –
 
1. Korea Fund (KF)  9.00%
2. Ishares Brazil (EWZ) 9.00%
3. Ishares Latin America (ILF) 8.40%
4. HLDRS Internet Infrastructure (IIH) 8.10%
5. Latin America Discovery (LDF) 8.05%

– Worst 5 Performing ETF’s –

1. US Home Construction (ITB)  -2.25%
2. SPDR Homebuilders (XHB) -1.45%
3. Chile Fund (CH) -.95%
4. HLDRS Pharma (PPH) -.40%
5. Ishares Italy (EWI) -.20%

:::  IPO’s Worth Watching for This Week :::

Surprise, surprise, yet another chinese solar IPO!!

1. Yingli Green Energy (YGE): Yingli Green Energy is green from top to bottom. The vertically integrated photovoltaic (PV) manufacturer makes polysilicon wafers and ingots that it uses to create PV cells and modules, which it incorporates into solar energy systems that turn sunlight into clean energy. The company, with an annual production capacity of 95 megawatts of polysilicon ingots and wafers, 90 megawatts of PV cells, and 100 megawatts of PV modules, is one of the few companies in China involved in all stages of PV manufacturing, sales, and installation. Its customers are mainly in Germany, Spain, China, and the US.  Trading set to begin on Friday.

2. Starent Networks (STAR): Starent Networks makes infrastructure equipment used by wireless carriers to offer enhanced voice and data services like video, multimedia messaging, and Internet service. Its ST16 Intelligent Mobile Gateway helps cellular companies as they transition from second- to third-generation networks. Carriers that have deployed Starent’s equipment include Verizon Wireless, Virgin Mobile, and China Unicom. Founded in 2000, the company has received funding from Matrix Partners, North Bridge Venture Partners, and Highland Capital Partners, among others. It has operations in Brazil, Canada, China, India, Japan, South Korea, Spain, the UK, and the US. Starent filed to go public in 2007.  Trading set to begin on Wednesday.

3. Infinera (INFN): The buzz on this company is that it designs photonic integrated circuits (PICs) intended to replace much larger components within optical networks. It also offers networking equipment built around these chips. Infinera’s chips are made from indium phosphide, a specialized compound semiconductor material that offers light-years faster performance than standard silicon. Customers include cable system operators, Internet service providers, and telecommunications carriers, such as freenet, Global Crossing, Level 3 Communications (60% of sales), Qwest Communications, and XO Communications.   Trading set to begin on Friday

4. Limelight Networks (LLNW): Limelight Networks wants to be the center of attention for digital content providers. Founded in 2001, the company offer services for delivering media content via the Internet for more than 700 customers such as DreamWorks, Akimbo, and Belo Interactive. As the demand for digital content grows, media providers need to find more ways to cater to larger audiences. Limelight Networks’ clients provide content through a variety of devices, including PCs, mobile phones, and digital video recorders.  Trading set to begin on Friday.

5.  FBR Capital Markets (FBR): an indirect taxable REIT subsidiary of FBR Group. The company was formed to be the holding company for FBR Group’s capital markets business, including investment banking and institutional sales, trading and research, and asset management business.  Trading set to begin on Wednesday

::: Upcoming Economic Reports (6/4/07 – 6/8/07) :::

Monday:        Factory Orders
Tuesday:       ISM Services
Wednesday:  Productivity (rev), Crude Inventories
Thursday:      Initial Claims, Wholesale Inventories, Consumer Credit
Friday:           Trade Balance

::: Notable Upcoming Earnings Reports I’ll Be Watching This Week :::

Tuesday: Guess (GES)
Wednesday: DSW Inc (DSW)
Thursday: Bio Reference Labs (BRLI)

::: In Case You Missed It – Blog Entries of the Past Week :::

1. Google (GOOG) Gaining Strength; Breakout Imminent
https://selfinvestors.com/tradingstocks/stocks/google-goog-gaining-strength-breakout-imminent/

2. Bulls Running on Fumes; Stock of Day – Heico (HEI)
https://selfinvestors.com/tradingstocks/weeklyafter-stock-market-review-archives/bulls-running-on-fumes-stock-of-day-heico-hei/

Bulls Running on Fumes; Stock of Day – Heico (HEI)

It’s days like today that really reveal the weakness or in this case strength of a market.  China’s continued attempt to slow its market brought the bears out from hiding, but as we’ve seen over the past few months they just couldn’t exert any control.  Traders continue to see these dips as buying opportunities rather than a signal to head for the exits.  It wasn’t long before the entire gap down was erased and hawkish Fed statements (no life in housing, concerns over inflation) added fuel to the fire on renewed hopes of a rate cut.  That sent shorts scrambling and the Dow to a new all time high.  While volume levels weren’t all that impressive (just a hair above average), today’s action does constitute a day of accumulation.  So, was last Thursday’s big distribution just an aberration?  Considering selling volume on that day and the trend towards distribution over the past couple weeks, the answer is no in my opinion.  I still believe this market is running out of gas, but how long it will run on fumes is anyone’s guess.  With an avalanche of economic data coming in the next two days, we’ll have a much better idea.

::: Major Indices Performance – The Numbers :::

(Note: volume averages are based on the average over the past 50 days)
Data as of 4:00EST – End of Day May 30th 2007

Accumulation in all indices.

Nasdaq: UP .80% today with volume just a hair ABOVE  average
Nasdaq ETF (QQQQ) UP .81%, volume 25% ABOVE average
Dow: UP .83%, volume also just a hair ABOVE the average
Dow ETF (DIA): UP .78%, volume 44% ABOVE the average
S&P ETF (SPY): UP .81%, volume 23% ABOVE the average
Russell Small Cap ETF (IWM): UP  .56%, volume 8% ABOVE the average

::: SelflInvestors Leading Stocks :::

The Self Investors Leading Stocks Index is comprised of stocks in the Breakout Tracker, which is a database of the fastest growing companies near a breakout or having already broken out of a base.  Leading stocks fared well today and beat the performance of the major indices.  However, there wasn’t a ton of conviction behind the move in leading stocks today.

Summary:

* Advancers led Decliners 320 to 100
* Advancers were up an average of 1.67% today, with volume 2% ABOVE average
* Decliners were down an average of 1.32% with volume 12% ABOVE average
* The total SI Leading Stocks Index was UP  .95% today with volume 4% ABOVE the average

::: Where’s the Money Flowing :::

Many investing websites provide leading industries based on price performance alone. However, without accompanying volume levels, this can sometimes be misleading.  The only way that I know of to gauge industry/sector strength WITH volume levels is through the analysis of ETF’s.  A couple years ago this was not possible, but as more traders/investors use ETF’s they become a much better tool for gauging the health of the market and seeing where the money is flowing (or not flowing).  Using the proprietary SelfInvestors Demand Indicator score which measures price and volume movements, I’m able to quickly see which sectors/industries are seeing the greatest inflows of cash.  For a detailed look at how I go about gauging sector/industry strength please see the following post: http://selfinvestors.com/si/industry_tracking/

* Current Leading Sectors/Industries (over last 30 trading days): 
Semiconductors, Transports, Agriculture, Networking, Nanotech, Aerospace/Defense
                                              
* Current Lagging Sectors/Industries (over last 30 trading days): 
Gold Miners, Biotech

* Today’s Market Moving Industries/Sectors (UP):
Real Estate, Telecom, Materials, Utilities

* Today’s Market Moving Industries/Sectors (DOWN):
Gold, Semis

::: Stocks :::

The stocks section will be an area where I highlight one stock selected from a group of stocks moving up with volume well above average and most likely breaking out of a base or consolidation.  Today’s stock is Heico (HEI), which broke out to a new all time high following an impressive earnings report.

ABOUT:  HEICO Corporation (HEICO), through its subsidiaries, is a manufacturer of Federal Aviation Administration (FAA)-approved jet engine and aircraft component replacement parts, other than the original equipment manufacturers and their subcontractors. HEICO is also a manufacturer of various types of electronic equipment for the aviation, defense, space, medical, telecommunications and electronics industries. It operates in two business segments: The Flight Support Group and The Electronic Technologies Group. HEICO’s Flight Support Group consists of HEICO Aerospace Holdings Corp. (HEICO Aerospace) and its subsidiaries, which accounted for 71% of its net sales during the fiscal year ended October 31, 2006 (fiscal 2006). Its Electronic Technologies Group consists of HEICO Electronic Technologies Corp. and its subsidiaries, which accounted for 29% of its net sales in fiscal 2006. In May 2006, HEICO, through its HEICO Aerospace Holdings Corp. subsidiary, acquired Arger Enterprises, Inc.

FUNDAMENTALS: Heico (HEI) has not only posted outstanding growth over the past three years (about 30% year over year), but it’s done so with consistency from quarter to quarter.  While growth is expected to slow just a bit, the company is expected to continue to post very good growth over the next 2 years of about 20%.   Add to that solid net margins and ROE of about 11% and strong management ownership of 30% and Heico is a company that should keep flying high.

TECHNICAL:  After reporting earnings that beat the whisper of .34 cents a share (they reported .35) and boosting its full year outlook, the stock broke out of a 6 month base to a new all time high.  With today’s volume coming in at nearly 4x the daily average, this is a strong breakout.  This kind of action typically signals further upside action in the coming weeks.  It should be noted that the stock is a thin one (trades just 61K shares a day on average), so it can be volatile at times. 

SELFINVESTORS RATING: With a total score of 50/60 (26/30 for fundamentals, 24/30 for technical), Heico (HEI) is a very good breakout stock.

Full Disclosure/Disclaimer: The stock of the day is by no means a buy recommendation.  Please do your own research and make a personal decision based on your own tolerance for risk.  I currently do not own a position in Heico (HEI).