::: Today’s Market Action :::
As subtle as it may be, the market always shows its hand. It rarely plays out the way you think it will or when you think it will (I was a few weeks early), but it plays out… when many traders least expect it. There have been all kinds of reasons given on CNBC and other investing sites as to why this market will rise higher – everything from more dollars chasing fewer companies (through M&A, which is ridiculous), to everyone expecting the market to correct, to… oh it doesn’t matter. Why? Because you are a savvy trader and knew better. You don’t need to cloud your judgement with the opinions of others. You relied on what the charts were telling you. You noticed that this market ran straight up after a severe drop back in February and was getting into considerably overbought territory. You noticed that 7 out of the past 10 days the S&P500 showed bearish action (which is a good measure of the broad market). You noticed that the S&P was flirting with previous record closing highs, a significant source of resistance. Suffice it to say. You knew better. You were ready. You knew the selling was coming.
It’s hard to say just how far we fall from here. Heck, I suppose this is just the beginning of another quick shakeout like we saw in February but I highly doubt it. I don’t think the market falls off a cliff, but it’s not going anywhere for awhile. The important thing is to get out of the way and let it ride out.
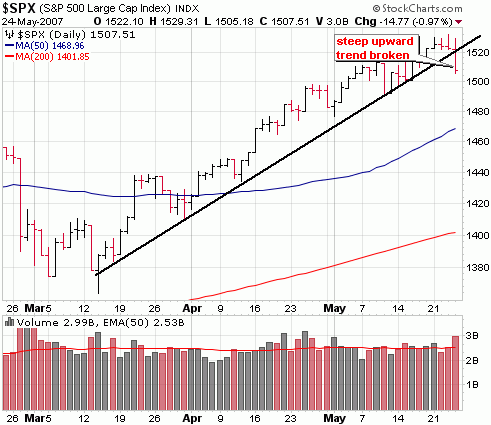
The S&P has broken through its steep upward channel but the Dow has a ways to go before even testing that level (which indicates how overbought it was). The Nasdaq was never as overextended and it is actually quite close to a critical support area of the February highs and the 50 day moving average (2500 – 2525). We could hit these levels tomorrow.
Here’s a look at the S&P:
The daily chart shows the break down below the steep upward channel with heavy volume today.
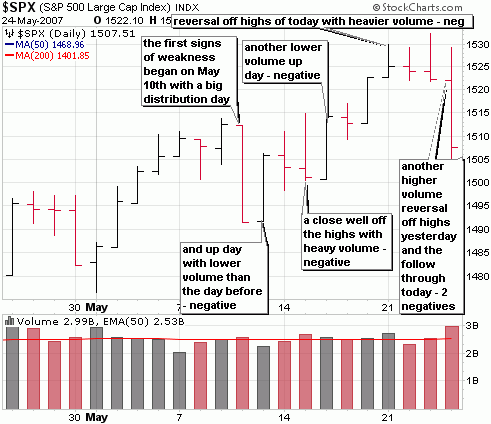
Here’s a detailed look at the trading action of the past couple weeks, which has shown deteriorating action for the most part. It began on May 10th with a big day of distribution and continued from there. Most of the up days occurred with lower volume buying along with a few higher volume reversal days. All in all, characteristics of a toppy market. Is it coincidence that we were seeing this kind of action around the previous record closing highs of the S&P. Not a chance.
I’ll have a look at all the major indices in a report this weekend..
::: Major Indices Performance – The Numbers :::
(Note: volume averages are based on the average over the past 50 days)
Data as of 4:00EST – End of Day May 24th 2007
Distribution across all indices today.
Nasdaq: DOWN 1.52% today with volume 18% ABOVE average
Nasdaq ETF (QQQQ) DOWN 1.43%, volume 79% ABOVE average
Dow: DOWN .62%, volume 6% ABOVE the average
Dow ETF (DIA): DOWN .60%, volume 187% ABOVE the average
S&P ETF (SPY): DOWN .91%, volume 75% ABOVE the average
Russell Small Cap ETF (IWM): DOWN 1.20%, volume 45% ABOVE the average
::: SelflInvestors Leading Stocks :::
The Self Investors Leading Stocks Index is comprised of stocks in the Breakout Tracker, which is a database of the fastest growing companies near a breakout or having already broken out of a base. As expected, leading stocks got hit a bit harder then the overall market.
Summary:
* Decliners led Advancers 365to 55
* Advancers were up an average of 1.22% today, with volume 34% ABOVE average
* Decliners were down an average of 2.32% with volume 19% ABOVE average
* The total SI Leading Stocks Index was DOWN 1.85% today with volume 21% ABOVE the average
::: Where’s the Money Flowing :::
Many investing websites provide leading industries based on price performance alone. However, without accompanying volume levels, this can sometimes be misleading. The only way that I know of to gauge industry/sector strength WITH volume levels is through the analysis of ETF’s. A couple years ago this was not possible, but as more traders/investors use ETF’s they become a much better tool for gauging the health of the market and seeing where the money is flowing (or not flowing). Using the proprietary SelfInvestors Demand Indicator score which measures price and volume movements, I’m able to quickly see which sectors/industries are seeing the greatest inflows of cash. For a detailed look at how I go about gauging sector/industry strength please see the following post: http://selfinvestors.com/si/industry_tracking/
* Current Leading Sectors/Industries (over last 30 trading days):
Agriculture, Internet, Transports, Networking, Semis, Biotech
* Current Lagging Sectors/Industries (over last 30 trading days):
Realty, REIT, Gold Miners, US Oil
* Today’s Market Moving Industries/Sectors (UP):
None
* Today’s Market Moving Industries/Sectors (DOWN):
Gold Miners, Oil & Gas Services, Utilitities, Gold
::: Stocks :::
I’m short on time tonight so no stock of the day, but I will say the RIMM is showing very bullish action. I’m a big fan of stocks that go up on days like today. RIMM was just a handful of those. Keep an eye on it. It recently broke out from a lengthy consolidation.