I mentioned that the selling of the past two days was relatively orderly and healthy action. That was not even close to the case today. But you have been ready (if you’ve been reading these reports 🙂 right!? After all, with price and volume movements indicating that the big fellas were selling into rallies over the past few weeks, it was just a matter of time before the dip buyers cried uncle and the bottom fell out.. That’s where we’re at. Now we turn our attention to critical support areas nearby.
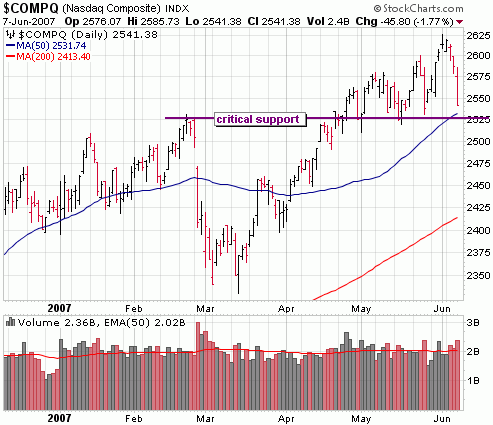
In a chart of the Nasdaq below, you can see that after 3 days of selling we are now quite close to the critical support area right around those February highs. I actually expected the sell volume to be a bit heavier today, but it’s probably still enough to test that critical level of support tomorrow at some point.
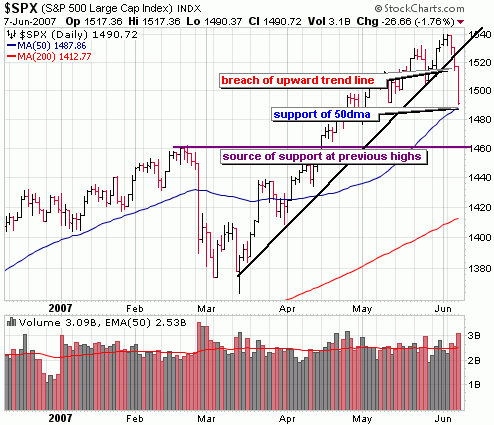
The S&P nearly hit that 50 day moving average today. Looks to me like a runaway train and will ultimately take out that level of support at some point tomorrow (doesn’t mean it can’t finish above though). Keep in mind, that we could see another 30 point drop in the S&P500 and still be in great shape technically! That’s how overbought this market waswhy I’ve been preaching caution. It’s a long ways down!
::: Major Indices Performance – The Numbers :::
(Note: volume averages are based on the average over the past 50 days)
Data as of 4:00EST – End of Day June 7th 2007
Heavy distribution across all indices.
Nasdaq: DOWN 1.77% today with volume 20% ABOVE average
Nasdaq ETF (QQQQ) DOWN 1.55%, volume 155% ABOVE average
Dow: DOWN 1.48%, with volume 24% ABOVE the average
Dow ETF (DIA): DOWN 1.46%, volume 147% ABOVE the average
S&P ETF (SPY): DOWN 1.80%, volume 119% ABOVE the average
Russell Small Cap ETF (IWM): DOWN 2.0%, volume 83% ABOVE the average
::: SelflInvestors Leading Stocks :::
The Self Investors Leading Stocks Index is comprised of stocks in the Breakout Tracker, which is a database of the fastest growing companies near a breakout or having already broken out of a base. No suprise that leading stocks got whacked today, down more than 2% with considerable volume. Decliners over advancers nearly 10:1!
Summary:
* Decliners led Advancers 376 to 38
* Advancers were up an average of .83% today, with volume 56% ABOVE average
* Decliners were down an average of 2.46% with volume 17% ABOVE average
* The total SI Leading Stocks Index was DOWN 2.16% today with volume 21% ABOVE the average
::: Where’s the Money Flowing :::
Many investing websites provide leading industries based on price performance alone. However, without accompanying volume levels, this can sometimes be misleading. The only way that I know of to gauge industry/sector strength WITH volume levels is through the analysis of ETF’s. A couple years ago this was not possible, but as more traders/investors use ETF’s they become a much better tool for gauging the health of the market and seeing where the money is flowing (or not flowing). Using the proprietary SelfInvestors Demand Indicator score which measures price and volume movements, I’m able to quickly see which sectors/industries are seeing the greatest inflows of cash. For a detailed look at how I go about gauging sector/industry strength please see the following post: http://selfinvestors.com/si/industry_tracking/
* Current Leading Sectors/Industries (over last 30 trading days):
Networking, Agriculture, Aerospace/Defense, Water/Resources, Technology, Broker/Dealers
* Current Lagging Sectors/Industries (over last 30 trading days):
Realty, Gold Miners, REIT’s, Global Dividend, Broadband, Biotech
* Today’s Market Moving Industries/Sectors (UP):
Agriculture – that’s impressive!
* Today’s Market Moving Industries/Sectors (DOWN):
Home Construction, Utilities, Gold Miners, Realty
::: Stocks :::
The stocks section will be an area where I highlight one stock selected from a group of stocks moving up with volume well above average and most likely breaking out of a base or consolidation.
No stock of the day today – just one stock in my entire database of over 400 leading companies moved up signficantly with volume today: Green Mountain Coffe (GMCR).