Category Archives: Weekly/After Stock Market Review Archives

Every Sunday evening a full market review is sent to members of SelfInvestors.com which provides commentary on the technical and economic picture, a review of the SelfInvestors Model Portfolio, the best/worst performing industries and ETF’s for the week, IPOs to watch, upcoming economic reports as well as notable earnings reports. In addition, on days when the market makes a significant move I’ll highlight the technical action discussing price/volume movements and support/resistance levels, industries/sectors leading and lagging the market as well as a Stock of the Day. In the past these were sent in the middle of the trading day but I’ve since begun publishing them and sending them to members after the market closes. These reports will be archived here as well.

Accumulation Day, But No Indication of Bottom Yet; Stock of Day – Danaher (DHR)

At this point I think it’s safe to say that the market is looking for just about any glimmer of positive news in order to rally from very oversold conditions and will probably begin brushing aside some of the bad news that has become typical such as horrible existing home sales.  News out of Citigroup that it’s getting a 7.5 billion cash infusion provided some early optimism but is this really a positive?  To think a company like Citigroup would need to raise cash in a hurry from a foreign company at 11% is in my mind a harbinger of things to come.  It’s going to get worse. 

At any rate, the market pulled itself up by its boot straps from oversold conditions today and managed to stage a significant rally with enough volume to signal accumulation.  Yes, there was good volume behind today’s rally, but this is not the kind of action that marks a bottom.  Throughout the day, I was surprised at how few opportunities there were in breakouts of leading stocks.  When the market turns, there will be a wave of high quality breakouts to choose from, but we need to see a big day of capitulation or some big time institutional buying before that can happen.  Neither occurred today, so it pays to continue to tread lightly here.  We’re close, but not quite there yet.  There will be plenty of time to profit, so the important thing is to not jump in aggressively too early.  The early bird may get the worm, but he also may find himself in the belly of a bear.

::: Major Indices Performance – The Numbers :::

(Note: volume averages are based on the average over the past 50 days)
Data as of 4:00EST – End of Day November 27th 2007

Nasdaq: UP 1.57% today with volume 1% BELOW average
Nasdaq ETF (QQQQ) UP 2.00%, volume 29% ABOVE average
Dow: UP 1.69%, with volume 25% ABOVE the average
Dow ETF (DIA): UP 1.46%, with volume 55% ABOVE the average
S&P ETF (SPY): UP 1.15%,  with volume 49% ABOVE the average
Russell Small Cap ETF (IWM): UP 1.27%, with volume 11% BELOW the average

::: SelflInvestors Leading Stocks :::

The Self Investors Leading Stocks Index is comprised of stocks in the Breakout Tracker, which is a database of the fastest growing companies near a breakout or having already broken out of a base.  Leading stocks were about in line with what the major indices did today, but notice the volume behind rising stocks versus declining stocks.  Not exactly bullish action from the leaders today.

Summary:

* Advancers led Decliners 227 to 76
* Advancers were up an average of 2.17% today, with volume 4% BELOW average
* Decliners were down an average of 2.45% with volume 57% ABOVE average
* The total SI Leading Stocks Index was UP 1.01% today with volume 11% ABOVE average

::: Where’s the Money Flowing :::

Many investing websites provide leading industries based on price performance alone. However, without accompanying volume levels, this can sometimes be misleading.  The only way that I know of to gauge industry/sector strength WITH volume levels is through the analysis of ETF’s.  A couple years ago this was not possible, but as more traders/investors use ETF’s they become a much better tool for gauging the health of the market and seeing where the money is flowing (or not flowing).  Using the proprietary SelfInvestors Demand Indicator score which measures price and volume movements, I’m able to quickly see which sectors/industries are seeing the greatest inflows of cash.  For a detailed look at how I go about gauging sector/industry strength please see the following post: http://selfinvestors.com/si/industry_tracking/

* Current Leading Sectors/Industries (over last 30 trading days):  
Bonds, Agriculture
                                          
* Current Lagging Sectors/Industries (over last 30 trading days): 
Semis, Retail, Internet, Materials

* Today’s Market Moving Industries/Sectors (UP):
Internet, Real Estate, Biotech, Regional Banks, REIT

* Today’s Market Moving Industries/Sectors (DOWN):
Oil, Gold, Commodities, Oil Services, Natural Resources

::: Stocks :::

The stocks section will be an area where I highlight one stock selected from a group of stocks moving up with volume well above average and most likely breaking out of a base or consolidation.  Today’s stock isn’t going to grab headlines and be bantered about in discussion boards.  Danaher (DHR) is a blue collar, large cap conglomerate that straps the hard hat on every day and delivers consistent profits quarter after quarter, year after year. 

ABOUT: 

Danaher Corporation derives its sales from the design, manufacture and marketing of professional, medical, industrial and consumer products. It operates in four segments: Professional Instrumentation, Medical Technologies, Industrial Technologies, and Tools & Components. During the year ended December 31, 2006, it acquired Sybron Dental Specialties and Vision Systems Limited, in addition to other nine companies, which are manufacturers and assemblers of environmental instrumentation, medical equipment or industrial products, in the market segments of electronic test, critical-care diagnostics, water quality, product identification, and sensors and controls. In July 2007, the Company acquired ChemTreat, Inc. In July 2007, the Company completed the sale of its power quality business to Thomas & Betts Corporation. As of November 21, 2007, the Company, through its indirect wholly owned subsidiary, Raven Acquisition Corp., had acquired over 90% interest in Tektronix, Inc.

FUNDAMENTALS: 

Danaher is far from the small cap high flyers I often highlight here, but in difficult markets it’s the big, lumbering, profit machines that will weather the storms the best and Danaher is certainly one of those.  According to Morningstar, the company has posted EPS growth in 9 out of the past 10 years and isn’t yet showing any signs of slow down.  EPS growth since 1997 has come in at 20.7%, 2.7%, 35.6%, 24.6%, (9.9%), 38.8%, 20.8%, 36.5%, 20% and 26.1% last year in 2006.  Growth for 2007 is expected to remain in line with historical growth with about a 20% rise in EPS.  Revenue growth has been equally as solid over the years but it should be noted that revenue growth has been decelerating a bit in recent quarters, dropping from 22%, to 18%, 19%, 14% and 13% in the latest quarter.  Still excellent growth for a company of this size.  Combined with a very good Return on Equity of 17%, Net Margins that continue to rise as they have over the past 5 years and strong management ownership of over 20%, Danaher is top Self Investors large cap stock.

TECHNICAL:  

The chart of DHR over the past 2 years provides a great example of how you might play a leading breakout stock, adding shares on each subsequent breakout.  The first entry point was provided on a break from a long one year base at the beginning of 2006.  It provided a 2nd entry point on a break from a new base in early October 2007 and a 3rd entry on a breakout this summer to yet another all time high.  Despite a correcting market, DHR continues its bullish ways and has come away relatively unscathed over the past month and is looking poised to breakout from a flat base it’s been working on since late September.  The stock may provide a good entry on a breakout from this flat base above 86.  Remember: the stocks that hold up the best during a correction will likely lead the market with big gains once the market gets going again.

SELFINVESTORS RATING: With a total score of 50/60 (26/30 for fundamentals, 24/30 for technical), Danaher (DHR) is a highly rated Self Investors leading stock.

Full Disclosure/Disclaimer: The stock of the day is by no means a buy recommendation.  Please do your own research and make a personal decision based on your own tolerance for risk.  I currently do not own a position in Danaher (DHR)

Contrarian Indicators Show Tradeable Rally Imminent

As an indication that we are far from bull market trading where bad news is brushed aside and any glimmer of good news is a catalyst for a rally, the early positive tone from strong Thanksgiving weekend retail numbers gave way to more financial doom and gloom and a rush to the equity exit door.  Citigroup layoff rumors, UBS downgrades of Freddie Mac and Fannie Mae and finally Senator Charles Schumer urging regulators to look into the risks associated with the goverment lending to Countrywide Financial which Schumer called "their personal ATM machine" provided the gloom du jour.

From a price standpoint today’s action was obviously ugly, but volume levels didn’t show tremendous conviction behind the move and leading stocks held up remarkably well (see below).   However, it was the first day of trading after a long holiday weekend, so taking that into consideration today’s action was no fluke and sets us up for further deterioration and a test of the August lows in the Dow at 12517.  The S&P and Nasdaq still have strong support levels in place before setting up a test of their August lows with the S&P500 level of 1400 and the Nasdaq level around 2500 becoming important psychological levels of support to keep an eye on.

I’ve been mentioning in recent reports that we are close to a tradeable bottom and as Doug Kass points out over at the Street.com, several contrarian indicators support this theory.

– Net long hedge fund exposure has plummeted
– Invidual investors are now as bearish as they were in summer of ’06 and March of ’03
– Consumer confidence at levels not seen since 1992
– Market oscillators indicating dramatically oversold

DailyWealth has also pointed out recently that we’re due for a bounce based on indicators from Jason Goepfert who says "current indicators are as lopsided as they’ve been in the past few years".  In a run down of over 100 indicators, 26 are showing bullish, while only 2 bearish.

Another contrarian play comes in the form of a member in my live chat room, who mentioned to me that his mom just called wondering when she should sell.  He received the same call in August.  What are you hearing from your family and friends?  Pay attention to the discussions at all the holiday parties and get a sense of how the "average" investor is feeling towards the stock market. 

I do believe we’re close to a bottom, but when I say bottom I’m just referring to a tradeable rally.  Just how big this rally will be is anyone’s guess, but there will be some significant opportunities on the long side very soon.  What I’m looking for is some kind of big capitulation day characterized by some panic selling followed by some institutional buying and short covering.  Until that happens, I remain in a large cash position.

When this market gets going again, you might like to take a look at these potential leaders.

::: Major Indices Performance – The Numbers :::

(Note: volume averages are based on the average over the past 50 days)
Data as of 4:00EST – End of Day November 26th 2007

Nasdaq: DOWN 2.14% today with volume 10% BELOW average
Nasdaq ETF (QQQQ) DOWN 1.73%, volume 8% BELOW average
Dow: DOWN 1.83%, with volume 6% ABOVE the average
Dow ETF (DIA): DOWN 1.51%, with volume 23% BELOW the average
S&P ETF (SPY): DOWN 2.21%,  with volume 9% ABOVE the average
Russell Small Cap ETF (IWM): DOWN 2.72%, with volume 8% ABOVE the average

::: SelflInvestors Leading Stocks :::

The Self Investors Leading Stocks Index is comprised of stocks in the Breakout Tracker, which is a database of the fastest growing companies near a breakout or having already broken out of a base.  Leading stocks actually fared relatively well today, dropping less then all of the major indices with little conviction behind the selling.

Summary:

* Decliners led Advancers 225 to 78
* Advancers were up an average of 2.08% today, with volume 28% ABOVE average
* Decliners were down an average of 2.62% with volume 9% BELOW average
* The total SI Leading Stocks Index was DOWN 1.41% today with volume 0% ABOVE average

::: Where’s the Money Flowing :::

Many investing websites provide leading industries based on price performance alone. However, without accompanying volume levels, this can sometimes be misleading.  The only way that I know of to gauge industry/sector strength WITH volume levels is through the analysis of ETF’s.  A couple years ago this was not possible, but as more traders/investors use ETF’s they become a much better tool for gauging the health of the market and seeing where the money is flowing (or not flowing).  Using the proprietary SelfInvestors Demand Indicator score which measures price and volume movements, I’m able to quickly see which sectors/industries are seeing the greatest inflows of cash.  For a detailed look at how I go about gauging sector/industry strength please see the following post: http://selfinvestors.com/si/industry_tracking/

* Current Leading Sectors/Industries (over last 30 trading days): 
Bonds, Commodities, Agriculture
                                          
* Current Lagging Sectors/Industries (over last 30 trading days): 
Semis, Retail, Internet, Tech, Utilities

* Today’s Market Moving Industries/Sectors (UP):
Bonds across the board

* Today’s Market Moving Industries/Sectors (DOWN):
REITs, Real Estate, Energy, Financials, International Real Estate

::: Stocks :::

The stocks section will be an area where I highlight one stock selected from a group of stocks moving up with volume well above average and most likely breaking out of a base or consolidation.  Sorry, no stock of the day today but you might like to have a look at the following Self Investors Leading Stocks that moved up with volume today and are above the 50 and 200 day moving averages.  These could be your next leaders once the market turns. 

Listed in order of total rank (fundamentals + technicals) with the best at the top.

Arena Resources (ARD)
Fossil (FOSL)
Vimpel Communications (VIP)
Astronics (ATRO)
Dolby Laboratories (DLB)
Dynamic Materials (BOOM)
Stanley (SXE)


Goldman Sachs Citigroup Downgrade Spooks, But Nasdaq and S&P Hold for Now

So much for stabilization!  I had mentioned in the weekend report that the market was showing some signs of improvement and was beginning to stabilize around key support levels but Goldman Sachs took the legs out with a downgrade of Citigroup.  The downgrade in and of itself wasn’t enough to derail the market.  These kinds of downgrades are routine nowadays and news of banks coming out with statements about a couple billion in write downs is commonplace.  That much has been priced into the market for the most part.  What isn’t priced in is a prolonging of the credit crunch with a magnitude of double digit billions.  Clearly the Goldman Sachs estimate of 15 billion in write-offs in Citigroup over the next two quarters was a bit too much to stomach and spooked traders into heading for the exits today.  It certainly didn’t help that the National Association of Homebuilders confidence levels didn’t improve over October readings with a score of 19.  It’s the lowest level since this reading began in 1985, but on the bright side it didin’t drop over last month.  With 22 year record low levels and no drop over last month, perhaps this is a sign that the homebuilders are near a bottom. 


Get all the sentiment data here.

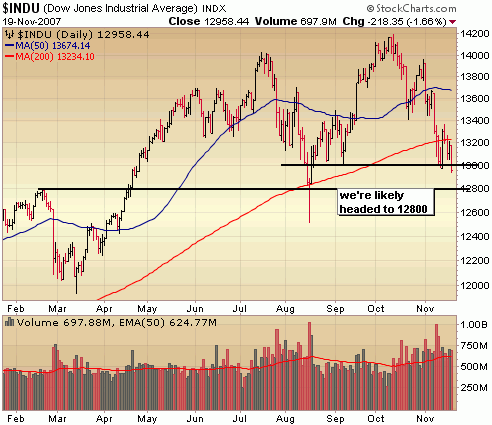
So now what?  Today’s move certainly puts a kink in the plans for a pre Thanksgiving rally but I still feel like we’re going to get a decent sized relief rally sustained over at least a few weeks very, very soon.  We just may need to see some more capitulation before that happens.  I discussed the key support levels in the S&P and Nasdaq in the weekend report which are are the last lines of defense before testing those August lows.  Both indices barely held at those levels today, but they did hold and volume levels didn’t indicate a tremendous amount of conviction behind today’s move.  That is encouraging but there is still significant downside risk tomomorrow.  The Dow took out and closed below 13,000 today and in all likilihood needs to retest the next level of support.  I failed to include this level of support at 12800, so wanted to highlight it here tonight.  It’s support at the February 07 highs and the close of that big August capitulation day and the last line of defense before testing the August lows.  I would imagine there is a very good chance of testing this level tomorrow but it probably depends on the housing numbers (starts, permits) as well as the FOMC minutes later in the day.  The HP quarter should help keep the market afloat at the open and the Fed will probably do everything it can to keep from roiling the market in its Fed minutes tomorrow, but it remains a dangerous market and one that can eat into capital in a hurry if you’re not careful!  I’ve been dabbling in a few of the strongest positions on the long side and profiting here and there but I will not get aggressive until we get a big day of accumulation or some kind of capitulation day.

::: Major Indices Performance – The Numbers :::

(Note: volume averages are based on the average over the past 50 days)
Data as of 4:00EST – End of Day November 19th 2007

Nasdaq: DOWN 1.66% today with volume 8% BELOW average
Nasdaq ETF (QQQQ) DOWN 1.15 %, volume 27% ABOVE average
Dow: DOWN 1.66%, with volume 10% ABOVE the average
Dow ETF (DIA): DOWN 1.4%, with volume 50% ABOVE the average
S&P ETF (SPY): DOWN 1.39%,  with volume 42% ABOVE the average
Russell Small Cap ETF (IWM): DOWN 1.98%, with volume 31% ABOVE the average

::: SelflInvestors Leading Stocks :::

The Self Investors Leading Stocks Index is comprised of stocks in the Breakout Tracker, which is a database of the fastest growing companies near a breakout or having already broken out of a base.  Leading stocks were hit much harder than the general market today but there wasn’t much conviction behind the selling.

Summary:

* Decliners led Advancers 264 to 38
* Advancers were up an average of 1.51% today, with volume 30% ABOVE average
* Decliners were down an average of 3.22% with volume 4% ABOVE average
* The total SI Leading Stocks Index was DOWN 2.62% today with volume 7% ABOVE average

::: Where’s the Money Flowing :::

Many investing websites provide leading industries based on price performance alone. However, without accompanying volume levels, this can sometimes be misleading.  The only way that I know of to gauge industry/sector strength WITH volume levels is through the analysis of ETF’s.  A couple years ago this was not possible, but as more traders/investors use ETF’s they become a much better tool for gauging the health of the market and seeing where the money is flowing (or not flowing).  Using the proprietary SelfInvestors Demand Indicator score which measures price and volume movements, I’m able to quickly see which sectors/industries are seeing the greatest inflows of cash.  For a detailed look at how I go about gauging sector/industry strength please see the following post: http://selfinvestors.com/si/industry_tracking/

* Current Leading Sectors/Industries (over last 30 trading days):  
Internet Infrastructure, Bonds, Agriculture
                                          
* Current Lagging Sectors/Industries (over last 30 trading days): 
Semis, Retail, Internet, Networking, Utilities

* Today’s Market Moving Industries/Sectors (UP):
Commodities, Bonds

* Today’s Market Moving Industries/Sectors (DOWN):
Home Construction, Basic Materials, Gold Miners, Retail, Financials

::: Stocks :::

The stocks section will be an area where I highlight one stock selected from a group of stocks moving up with volume well above average and most likely breaking out of a base or consolidation.  Sorry, short on time tonight so no stock of the day today.  However, you may like to take a look at these SelfInvestors Leading stocks the moved up with volume today and are above both the 50 day and 200 day moving averages.

Stocks are listed in order of total rank (fundamentals + technicals), with best at the top.

IntercontinentalExchange (ICE)
TransDigm Group (TDG)
Astronics (ATRO)
HMS Holdings (HMSY)
Interactive Intelligence (ININ)
Darling International (DAR)

Market Stabilizes, Holiday Rally In Sight; Hot IPO – CreditCards.com (CCRD)

Heading into the holiday Thanksgiving week, the market finds itself somewhat stabilized and consolidating around some key support levels (see below).  Expect to see trading around these levels at least until normal trading volumes resume the following week.  What I’ve found is that the trading in the first few days after a holiday break  are very revealing into what we can expect for the following few weeks. 

Overall, last week was a positive for bulls which kicked it off with a big price surge on Tuesday, but one that lacked significant conviction.  Essentially it was just a big dead cat bounce.  It didn’t follow through as expected but the following action should be viewed as bullish considering selling volume subsided in the face of doomsday comments and negative news out of Goldman Sachs, Wells Fargo and Barclays.  Remember at market bottoms, traders begin to shrug off news and focus on the positives.  I don’t think we’re 100% there just yet and we still need a confirmation day before I’m going to get a bit more aggressive on the long side, but given the technical action has improved and that we are heading into a historically bullish period for the stock market, the odds are good for a tradeable rally here for the next few weeks up to key resistance levels of the 50 day moving averages.

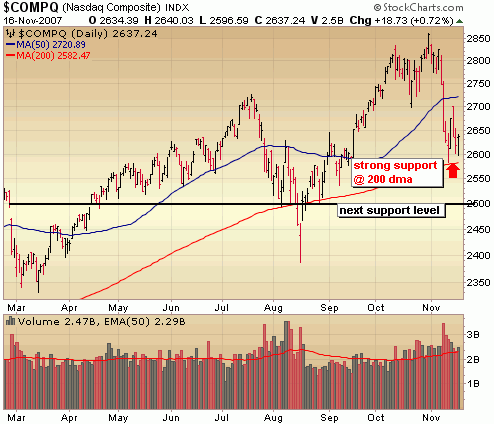
The Nasdaq is holding right at key support of its 200 day moving average and looking ready to rally up to resistance around the 50 day moving average.  If the Nasdaq does bust through the 200 dma, it’s likely headed down to test the next level of support around 2500.  I think we retrace some of these of November losses before that becomes a possibility.

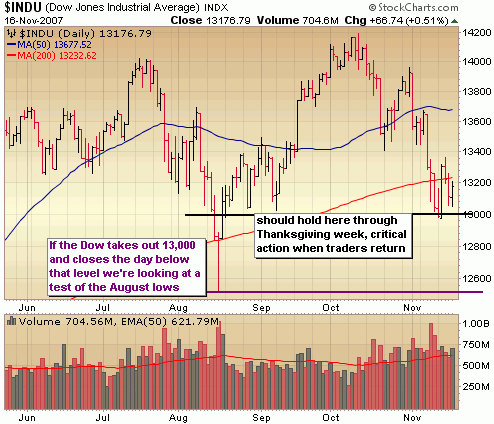
The Dow is consolidating around support of 13000.  It really needs to get back above resistance of the 200 day moving average and hold there very soon.  The long it bounces around here, the greater the chance it ultimately fails and tests the August lows.

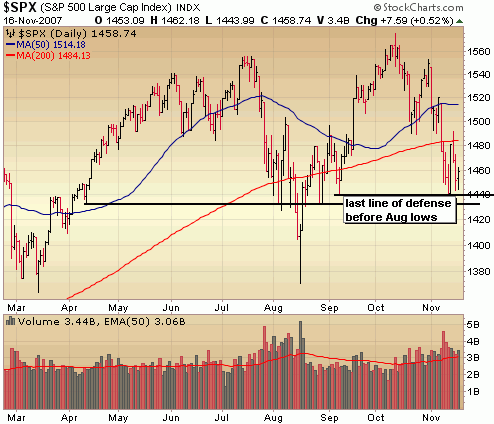
The S&P is stabilizing around key support of 1430 – 1440 but has much farther to go before even getting to that 200 day moving average and will have a much more difficult time of staging a big rally to get to the 50 day moving average.  Notice on Wednesday it busted through the 200 day but turned tail at the end of the day and closed below this resistance level.  The area around 1490 – 1500 would be an area where the S&P would most likely fail following any holiday rally.

NOTE: There will be not Weekly Market report next Sunday. 

::: Model Portfolio Update :::


Following the first weekly loss in many last week, the portfolio bounced back a bit this week with a small gain of .7%, bringing the year to date return to 24.6%.  I continue to tread very carefully in this volatile, unpredictable market and continue to sit on pile of cash (55%).  However, the market is showing signs of improving at least on a short term basis and we are heading into a period that is  typically strong so I’m going to begin adding just a bit more exposure to the long side down here.  I added to a long term core position last week and did the same this week, in addition to initiating a new Quick Strike Profit play which is up nearly 9% in just a few days.   I am looking to add two more positions next week, another core holding (long term play) most likely in tech as well as another QSP play (PGI might be a good candidate, a stock recently highlighted as Stock Trade of the Day).  There are currently no short positions in the portfolio.

Would you like to follow along with the SelfInvestors Model Portfolio each day with buy and sell alerts within minutes of the transaction?  It’s part of my Gold service which also includes all of the tracking tools (breakout stocks, IPO’s and ETF’s and unlimited personal support). 

::: Best/Worst Performers :::

– Top 10 Performing Industries For the Week –

1. Long Distance Carriers: 10.80%
2. Major Airlines: 9.35%
3. Recreational Goods: 9.30%
4. Internet Service Providers: 5.85%
5. Grocery Stores: 5.75%
6. Computer Based Systems: 5.05%
7. Regional Airlines:  4.75%
8. Dairy Products: 4.25%
9. Home Improvement Stores: 3.90%
10. Home Furnishings & Fixtures: 3.80%

– Top 10 Worst Performing Industries For the Week –

1. Mortgage Investment: -9.90%
2. Gold: -8.70%
3. Rental & Leasing Services: -7.00%
4. Silver: -6.55%
5. Heavy Construction: -6.30%
6. Industrial Equipment Wholesale: -6.25%
7. Industrial Metals & Minerals: -5.55%
8. Semiconductor – Memory Chips: -5.55%
9. Trucks & Other Vehicles: -5.30%
10. Trucking: -5.25%

– Top 5 Best Performing ETFs For the Week –
 
1. India Fund (IFN)  8.70%
2. Morgan Stanley India (IIF) 8.55%
3. MSCI India (INP) 6.00%
4. HLDRS Broadband (BDH) 4.55%
5. Chile Fund (CH) 3.90%

– Worst 5 Performing ETF’s –

1. Thai Fund (TTF) -6.85%
2. Asa Limited (ASA)  -6.80%
3. Market Vectors Gold Miners (GDX)  -6.70%
4. Ishares Silver (SLV) -6.20%
5. Power Shares Global Clean Energy (PBD)  -6.05%

:::  IPO’s Worth Watching for This Week :::

One very interesting IPO this week.  Are we entering another Internet bubble phase?  In some regards I believe so and you’ll begin to see many of the so called Web 2.0 properties go under within the next year or two, but also keep in mind that the internet has matured greatly since the late 90’s and many of these companies are making money and lots of it.  CreditCards.com is a company that has been doubling revenues and profits, so the days of internet properties with no profit going public are over.  I’m very interested to see how this stock does in the marketplace. 

1.  CreditCards.com (CCRD)  runs a Web site where visitors can sift through about 150 card offerings from more than 20 issuers. Users can sort by interest rate, rewards, cash back, airline credit, and other card criteria; by credit quality (excellent, good, fair); or by issuer. Card issuers pay CreditCards.com a fee based on either card applications or approvals. Trading set to begin on Tuesday.

::: Upcoming Economic Reports (11/19/07 – 11/23/07) :::

Monday:         Leading Indicators
Tuesday:       Building Permits, Housing Starts, FOMC Minutes
Wednesday: Initial Claims, Crude Inventories
Thursday:      None
Friday:            None

::: Upcoming Notable Earnings Reports :::

Monday:  TransDigm (TDG)

Tuesday:  Blue Coat Systems (BCSI), GameStop (GME), Home Inns & Hotels Management (HMIN), China Medical (CMED), Focus Media Holdings (FMCN), Mobile Telesystems (MBT)

Wednesday: Abercrombie & Fitch (ANF), Trina Solar (TSL)

::: In Case You Missed It – SelfInvestors Blog Entries of the Past Week :::

1. Do You Have a Millionaire Mind?

2. Trade of Day – Bullish Triangle Emerges in Premier Global Services (PGI)

3. SalesForce.com (CRM) Surges, China Stocks Still Getting Hit On Earnings

4. Breakout Stocks Review: Capital Preservation Key In Down Market

5.  Solar Still Shines – Suntech Power (STP) Surges After Earnings

6.  Three S Bio (SSRX) Still Looking Bullish After Earnings

7. This Dead Cat Made of Rubber From China; Stock of Day – Cellcom Israel (CEL)

8.  Cramer Has a Credibility Problem

9.  Quick Strike Profit Plays Video Review – Entries & Exits
Sorry, but this post is available to Platinum & Gold Members only.

This Dead Cat Made of Rubber From China; Stock of Day – Cellcom Israel (CEL)

Meow! Screech!! The cat bounced today with jet propulsion force from well oversold conditions.  That’s not much of a surprise.  Bull markets die hard and this one will too.  We got a short term capitulation day last Thursday followed by some light volume selling the following two days and a touch of key support levels, so the dead cat was approaching the launch pad.  Throw in positive comments from Walmart (hey, the biggest discount retailer is doing well it’s great! or is it?), some reassuring comments regarding the subprime mess over at the Merrill Lynch Conference and you have a recipe for a short covering fueled rally.  The price action was mighty impressive I must admit.  I was a bit surprised at the magnitude of today’s rise but volume levels were not a surprise.  There wasn’t much conviction behind the move today so a classic dead cat bounce it was.  That’s not to say there isn’t room to run.  Both the Dow and Nasdaq probably have enough juice to run up and kiss their 50 day moving averages and the S&P might just have the gusto to get above the 200 day moving average.  All in all though, you should be using this rise as an opportunity to limit your exposure on the long side if you haven’t already done so.  For you day and swing traders there will continue to be trading opportunities on both sides but for most this is just an opportunity to reduce exposure on the long side and maybe initiate a short or two.
::: Major Indices Performance – The Numbers :::

(Note: volume averages are based on the average over the past 50 days)
Data as of 4:00EST – End of Day November 13th 2007

Nasdaq: UP 3.46% today with volume 19% ABOVE average
Nasdaq ETF (QQQQ) UP 4.12%, volume 76% ABOVE average
Dow: UP 2.46%, with volume 17% ABOVE the average
Dow ETF (DIA): UP 2.6%, with volume 9% ABOVE the average
S&P ETF (SPY): UP 3.05%,  with volume 5% ABOVE the average
Russell Small Cap ETF (IWM): UP 3.09%, with volume 22% ABOVE the average

::: SelflInvestors Leading Stocks :::

The Self Investors Leading Stocks Index is comprised of stocks in the Breakout Tracker, which is a database of the fastest growing companies near a breakout or having already broken out of a base. 

Summary:

* Advancers led Decliners 325 to 48
* Advancers were up an average of 4.41% today, with volume 28% ABOVE average
* Decliners were down an average of 1.82% with volume 57% ABOVE average
* The total SI Leading Stocks Index was UP 3.61% today with volume 32% ABOVE average

::: Where’s the Money Flowing :::

Many investing websites provide leading industries based on price performance alone. However, without accompanying volume levels, this can sometimes be misleading.  The only way that I know of to gauge industry/sector strength WITH volume levels is through the analysis of ETF’s.  A couple years ago this was not possible, but as more traders/investors use ETF’s they become a much better tool for gauging the health of the market and seeing where the money is flowing (or not flowing).  Using the proprietary SelfInvestors Demand Indicator score which measures price and volume movements, I’m able to quickly see which sectors/industries are seeing the greatest inflows of cash.  For a detailed look at how I go about gauging sector/industry strength please see the following post: http://selfinvestors.com/si/industry_tracking/

* Current Leading Sectors/Industries (over last 30 trading days):  
Internet Infrastructure, US Oil, Commodities, Agriculture, Pharma
                                          
* Current Lagging Sectors/Industries (over last 30 trading days): 
Semis, Retail, Internet

* Today’s Market Moving Industries/Sectors (UP):
Broker/Dealers, Retail, Clean Energy, Networking, Banks, Financial

* Today’s Market Moving Industries/Sectors (DOWN):
US Oil, Commodities

::: Stocks :::

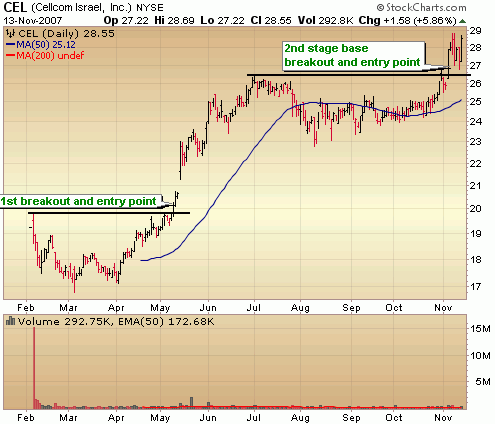
The stocks section will be an area where I highlight one stock selected from a group of stocks moving up with volume well above average and most likely breaking out of a base or consolidation.  Today’s stock is Cellcom Israel (CEL), a recent IPO that broke out of a 2nd stage base a few days ago.

ABOUT: 

Cellcom Israel Ltd. (Cellcom) is a provider of cellular communications services in Israel. The Company offers a range of cellular services through its cellular networks. These services include basic and advanced cellular telephone services, text and multimedia messaging services, and advanced cellular content and data services. As of December 31, 2006, Cellcom also offered international roaming services in 171 countries. It offers its subscribers a selection of handsets from various global manufacturers, as well as extended warranty and repair and replacement services. It also offers landline transmission and data services to business customers and telecommunications operators. Since July 2006, Cellcom began offering landline telephony services to selected businesses. As of December 31, 2006, the Company provided cellular communications services to approximately 2.884 million subscribers, including basic cellular telephony services and value-added services, as well as handset sales.

FUNDAMENTALS: 

Cellcom Israel is a company that posts a profit every year but struggles with consistency from year to year.  That may be changing with 4 straight quarters of excellent quarter over quarter earnings growth of 107%, 59%, 55% and 61%.  Sales growth could be a bit stronger but is solid with quarter over quarter growth of 23%, 21%, 10% and 15% over the past year.  Following year over year earnings growth of 18% in ’06, the company is expected to post growth of 54% here in 2007 with estimates of 12%  growth in ’08.  Those kinds of growth numbers aren’t world beating like some of the other companies I’ve posted here in the Stock of the Day section but they are good and represent greater consistency in growth than in years past.  Where the company really shines is in Return on Equity which has spiked to 150% recently and indicates a strong management team.  Net margins are good at 14% and have also spiked in the past year.  Overall, this is a company with strong fundamentals.

TECHNICAL:  

CEL is a stock that IPO’d back in February of this year and didn’t take much time to break out from its first base just a couple months later.  It ran up roughly 30% before falling into another shallow base with tight price action.  Both characteristics of bullish action.  I’d have to say that this is one of the best looking base formations and resulting breakouts out there right now.  Following today’s move it’s a bit extended from a proper buy point, but any kind of minor pullback from here might offer a great spot to play it.

SELFINVESTORS RATING: With a total score of 51/60 (24/30 for fundamentals, 27/30 for technical), Cellcom Israel (CEL) is a top 15 Self Investors breakout stock.

Full Disclosure/Disclaimer: The stock of the day is by no means a buy recommendation.  Please do your own research and make a personal decision based on your own tolerance for risk.  I currently do not own a position in Cellcom (CEL).

Bull Market At the Brink But Not Dead; Hot IPO – Internet Brands (INET)

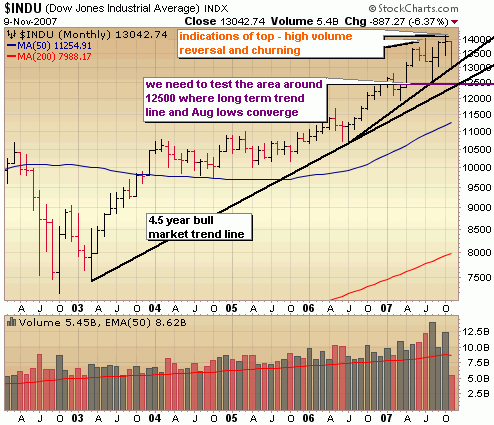
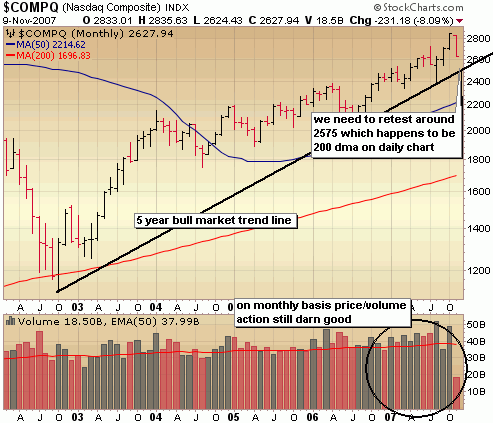
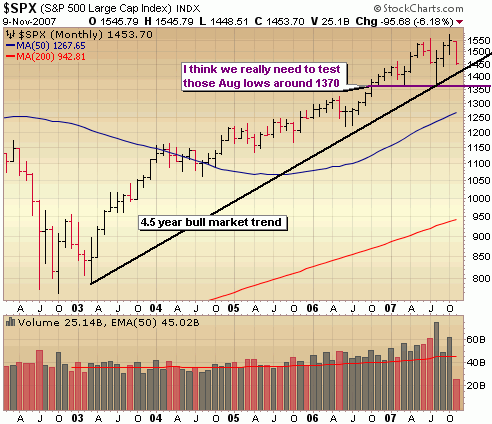
There’s quite a bit of doom and gloom out there right now and to a certain degree it’s warranted but tonight I wanted to just throw up the long term monthly charts of the major indices which reveal that this bull market is still intact with a bit of room left to the down side before these long term critical support levels come into play.  It’s conceivable that we test these trend lines and continue the bull run but given the length of the run (about 5 years) we have to continue to play defensively up here and remain in capital preservation mode until the market can show that the selling intensity has subsided and buyers are stepping in with some aggression.  Perhaps the market is washing out a bit here to prepare for yet another holiday rally but let’s not make big bets on that just yet.

Inthe Nasdaq chart below I’ve drawn out the long term upward trend beginning off the 2003 lows and the start of a new bull market.  After a 5 year running of the bulls, the market is no doubt tired but it’s important to note the trend line is still intact.  We have about another 50 points to go before the Nasdaq tests this support area around 2575.  Despite the pain of the past couple weeks, the bull run is still alive and well but on shaky legs.

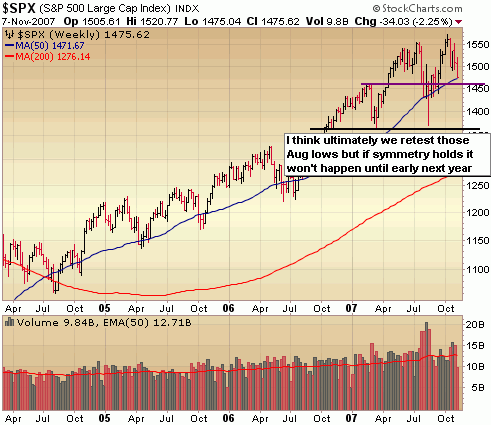
Given that the S&P is littered with financial stocks, I think ultimately it could break through that upward trend line which defines the bull market run as more CEO’s are forced to reveal the true nature of the hit they have taken.  Those August lows are the next critical area of support.  If we break through that level, we could be in for a long bear market.

The Dow is testing a steeper upward trend that began last year but has room to run before testing the 4.5 year bull market trend line around 12500.  Considering this area also happens to coincide with the August lows, it’s a very strong area of support.  If we take out this level I think it’s safe to say the bull market is dead.  Note the indications of topping in the Dow in July (high volume reversal) and last month (churning, which is a higher volume move with little to no price appreciation)

::: Model Portfolio Update :::

For the first time in several weeks, the Self Investors Model Portfolio finished the week with a loss (down 3.7%) which was  in line with what the S&P did at 3.7% but year to date is now nearly 10x the performance of the S&P with a gain of 23.9%.  Closing out my QID position after the Fed cut rally was probably one of the biggest mistakes I’ve made this year.  Knowing that the first Fed cut move is very often a false move, I’m not sure why I didn’t trust that and hold the QID position a few more days.  Mistakes happen but hopefully not very often!  I continue to tread fairly lightly not making big bets either way although of course I wish I can put on a few more short trades.  The decline over the week was so sharp, there just weren’t any good shortable bounces.  I did close out one short trade in BTH for a 7% gain but that was tempered by sizable losses in China Digital (STV) and Cynosure (CYNO).  I did initiate 3 new small long positions in high quality companies.. I just couldn’t resist dabbling after some of these were thrown out with the rest of the market.   The portfolio is currently split equally with 50% long and 50% cash.   

::: Best/Worst Performers :::

– Top 10 Performing Industries For the Week –

1. Internet Service Providers: 14.15%
2. Surety & Title Insurance: 8.20%
3. Hospitals: 4.10%
4. Home Furnishing Stores: 3.15%
5. Farm Products: 2.90%
6. Industrial Equipment & Components: 2.70%
7. Oil & Gas Drilling & Exploration:  2.65%
8. Cleaning Product: 2.30%
9. REIT – Healthcare Facilities: 2.15%
10. Dairy Products: 2.00%

– Top 10 Worst Performing Industries For the Week –

1. Toy & Hobby Stores: -14.55%
2. Major Airlines: -12.95%
3. Data Storage Devices: -12.45%
4. Networking & Comm Devices: -11.95%
5. Recreational Goods: -11.15%
6. Security Software & Services: -10.45%
7. Regional Airlines: -10.40%
8. Personal Computers: -10.35%
9. Wholesale Other: -10.25%
10. Internet Info Providers: -9.95%

– Top 5 Best Performing ETFs For the Week –
 
1. Ishares Silver (SLV)  5.25%
2. Ishares Gold (IAU) 3.10%
3. Central Fund of Canada (CEF) 3.10%
4. SPDR Gold (GLD) 2.95%
5. KBW Banking (KRE) 2.00%

– Worst 5 Performing ETF’s –

1. Morgan Stanley China (CAF) -14.85%
2. India Fund (IFN)  -13.45%
3. PowerShares Global Dragon (PGJ)  -12.60%
4. Ishares China (FXI)  -12.50%
5. Morgan Stanley India (IIF)  -11.40%

:::  IPO’s Worth Watching for This Week :::

The first week in many with no China IPO’s!!  I particularly like Internet Brands and the MCSI this week.

1.  Internet Brands (INET):  helps customers research and purchase, online or at an actual location, big ticket items, such as cars, real estate, mortgages, and travel. Its 40-plus Web sites include those for automobiles (Autos.com, CarsDirect.com), homes and mortgages (LoanApp.com), and vacation rental properties (BBOnline.com, VacationHomes.com). The company offers financing and mortgages through various banks. More than 3,000 local car dealers have joined its nationwide network and it has alliances with Penske Automotive Group (formerly United Auto Group) Trading set to begin on Thursday.

2. MSCI (MXB) formerly Morgan Stanley Capital International, creates equity, fixed income, and hedge fund indices as well as risk management and portfolio analysis tools used by 24 of the 25 largest asset management firms. Its most well known products are MSCI World and EAFE indices to watch global funds and BarraOne for Web-based risk analysis. The latest entry is MSCI Global Islamic Indices, which incorporate allowances for Sharia or Islamic law. MSCI operates from about 20 offices worldwide serving nearly 3,000 customers in more than 60 nations. Financial services powerhouse Morgan Stanley owns the company.   Trading set to begin on Thursday.

3.  Stewart & Stevenson (SSC):  company is a leading supplier of equipment used in oilfield services. Stewart & Stevenson operates three divisions: Equipment (oil well stimulation, coil tubing, engines, and material handling equipment), Aftermarket Parts and Service (parts and service for customers in oil and gas, marine, power generation, mining, and construction industries), and Rental (rental of generators, material handling equipment, and air compressors). Customers in the oil and gas services industry such as Schlumberger, Weatherford International, and BJ Services account for about 60% of sales.    Trading set to begin Friday.

4. Navios Maritime Partners (NMM) international owner and operator of dry bulk carriers (merchant ships used to transport unpackaged bulk commodities) — formed in 2007 by leading seaborne shipping company Navios Maritime Holdings (NMH) — plans to leverage NMH’s more than 50 years of experience to pursue growth opportunities and expand its fleet. NMP’s initial active fleet consists of six Panamax vessels and one Capesize vessel; it also has two vessels under contract for delivery.  Trading set to begin on Monday.

5. Och-Ziff Capital (OZM):  provides a variety of alternative asset management services for more than 700 fund investors through five locations in the US, Europe, and Asia. Och-Ziff Capital Management Group’s investment strategies include private equity, real estate, and equity restructuring, among others. With nearly $27 billion in assets under management, the company invests more than 50% of its assets in foreign markets. The hedge fund firm, which has some 130 investment professionals including some 20 partners, commenced operations in 1994.  Trading set to begin on Wednesday.

6.  EnergySolutions (ES): provides nuclear waste management services, primarily to the US Department of Energy, including nuclear facility decommissioning and decontamination, spent fuel handling, and waste disposal. Three nuclear waste services companies — Envirocare of Utah, Scientech D&D, and BNG America — combined to form EnergySolutions.   Trading set to begin on Thursday.

::: Upcoming Economic Reports (11/12/07 – 11/16/07) :::

Monday:         None
Tuesday:       Pending Home Sales, Treasury Budget
Wednesday: Retail Sales, PPI, Business Inventories, Crude Inventories
Thursday:      CPI, Initial Claims, Philly Fed
Friday:            Industrial Production, Cap. Utilization

::: Upcoming Notable Earnings Reports :::

Monday:  Companhia Paranaense de Energia (ELP), 51job (JOBS)

Tuesday:  ExlService (EXLS), Fossil (FOSL), 3SBio (SSRX)

Wednesday: Sina (SINA), Meridian Bioscience (VIVO), GigaMedia (GIGM), KHD Humboldt (KHD), Diana Shipping (DSX)

Thursday: Suntech Power (STP), Green Mountain Coffee Roasters (GMCR), Autodesk (ADSK), Global Sources (GSOL), FCStone (FCSX), Mobile Telesystems (MBT)

::: In Case You Missed It – SelfInvestors Blog Entries of the Past Week :::

1. Dolby Labs (DLB) To the Moon On Earnings

2. Role Reversal: Dow and S&P Capitulate, Tech Wrecked; Stock of Day – ExlService (EXLS)

3. Brazilian Homebuilder Gafisa (GFA) & Top Solar Play First Solar (FSLR) Spike On Earnings

4. Expert Insight Into the Oil/Gas Engineering Industry

5.  October Highs Most Likely A Long Term Top

6.  Foster Wheeler (FWLT) The Lone Bright Spot

7. TheStreet.com (TSCM), Quintana Maritime (QMAR) & WMS Industries (WMS) Poised to Hit All Time Highs

7.  Flowserve (FLS), HMS (HMSY), Stanley (SXE), eHealth (EHTH), Open Text (OTEX) & GFI Group (GFIG) All Soar to New Heights

Role Reversal: Dow and S&P Capitulate, Tech Wrecked; Stock of Day – ExlService (EXLS)

It certainly didn’t take long for the market to test critical support levels that I discussed in my weekend report.  Surprisingly, the indices held up quite well at the open despite yesterday’s downward momentum and a Cisco selloff but it didn’t take long for the market to resume the red.  Poor same store sales results got it started and less than positive remarks out of Bernanke sent the market into a tailspin.  The selling intensity was fierce  .. watching a stock like TSL drop 10 bucks in 2 hours was unbelievable.  When you see high quality stocks selling off like that you know that the selling is a bit irrational at least on an intraday basis.  I jumped in to a few positions personally at this point to take advantage of great stocks being thrown out with the bathwater.  This kind of volatility is a day trading dream but it wasn’t without the Tums close by! 

The selling intensity ultimately gave way to what was probably a healthy round of short covering as shorts locked in profits in many of the financial names.  It was a remarkable recovery in both the Dow and S&P which resulted in a short term capitulation day and potentially marks a bottom in the short term which just may be the floor for another holiday market run.  However, the Nasdaq didn’t fare so well.  It did finish well off the lows, but not enough to signal that a bottom is in place over the short term.  Key support of the July highs and the 50 day moving average were both taken out today with all time record volume levels so obviously the dichotomy that existed between the Dow/S&P and Nasdaq is closing a bit. 

This market looks tradeable here on the long side but still on a shorter term basis.  For most, it will probably best to continue to sit on the sidelines until some of the volatility subsides and the market steadies a bit.

::: Major Indices Performance – The Numbers :::

(Note: volume averages are based on the average over the past 50 days)
Data as of 4:00EST – End of Day November 8th 2007

Nasdaq: DOWN 1.92% today with volume 58% ABOVE average
Nasdaq ETF (QQQQ) DOWN 3.04%, volume 188% ABOVE average
Dow: DOWN .25%, with volume 66% ABOVE the average
Dow ETF (DIA): DOWN .67%, with volume 196% ABOVE the average
S&P ETF (SPY): DOWN .51%,  with volume 113% ABOVE the average
Russell Small Cap ETF (IWM): UP .30%, with volume 45% ABOVE the average

::: SelflInvestors Leading Stocks :::

The Self Investors Leading Stocks Index is comprised of stocks in the Breakout Tracker, which is a database of the fastest growing companies near a breakout or having already broken out of a base. 

Summary:

* Decliners led Advancers 209 to 164
* Advancers were up an average of 2.57% today, with volume 53% ABOVE average
* Decliners were down an average of 3.13% with volume 66% ABOVE average
* The total SI Leading Stocks Index was DOWN .62% today with volume 60% ABOVE average

::: Where’s the Money Flowing :::

Many investing websites provide leading industries based on price performance alone. However, without accompanying volume levels, this can sometimes be misleading.  The only way that I know of to gauge industry/sector strength WITH volume levels is through the analysis of ETF’s.  A couple years ago this was not possible, but as more traders/investors use ETF’s they become a much better tool for gauging the health of the market and seeing where the money is flowing (or not flowing).  Using the proprietary SelfInvestors Demand Indicator score which measures price and volume movements, I’m able to quickly see which sectors/industries are seeing the greatest inflows of cash.  For a detailed look at how I go about gauging sector/industry strength please see the following post: http://selfinvestors.com/si/industry_tracking/

* Current Leading Sectors/Industries (over last 30 trading days):  
Internet Infrastructure, Gold, Gold Miners, Clean Energy, Commodities
                                          
* Current Lagging Sectors/Industries (over last 30 trading days): 
Semis, Internet, Retail, Utilities, Retail, Financial

* Today’s Market Moving Industries/Sectors (UP):
Clean Energy, Utilities, Energy, Banks

* Today’s Market Moving Industries/Sectors (DOWN):
Networking, Technology, Internet (been a very long time since I’ve seen this industries in the big down movers list!)

::: Stocks :::

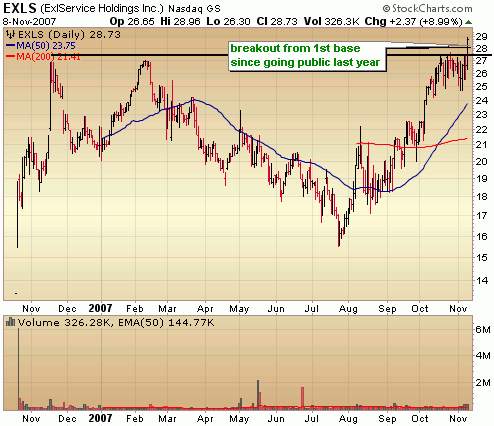
The stocks section will be an area where I highlight one stock selected from a group of stocks moving up with volume well above average and most likely breaking out of a base or consolidation.  Today’s stock is ExlService (EXLS), an IPO that debuted last year and broke out of its first base today.

ABOUT: 

ExlService Holdings, Inc. (ExlService Holdings) is a provider of offshore solutions, including business process outsourcing (BPO), research and analytics and advisory services, primarily serving the needs of companies in the banking, financial services and insurance (BFSI) sector, as well as other industry sectors, such as utilities. The Company provides integrated front-, middle- and back-office process outsourcing services and manages processes for its United States-based and United Kingdom-based clients. The BPO services it provides involve the transfer to the Company of select business operations of a client, such as claims processing, finance and accounting and customer service, after which it administers and manages the operations for its client. Its advisory services include risk assessment, documentation and internal controls testing, business process re-engineering and process quality monitoring. On July 1, 2006, the Company acquired Inductis LLC.

FUNDAMENTALS: 

EXLS is a company that has been posting outstanding growth over the past few years and posted its first profitable year in ’04 after posting a loss of 1.75/share in ’02 and a loss of .03/share in ’03.  Since 2004 the company has posted year over year earnings growth of 30% and 104% with another 40 – 50% growth expected here in ’07.  Net margins (14%) and ROE (22%) are very good and have been rising with no debt on the balance sheet.  Clearly a fundamentally sound company.

TECHNICAL:  

The stock broke out from a long cup with handle base today for the first time since going public.  Volume was levels showed good conviction in the move with trading volume coming in at more than 2.5 times the daily average.  With a good up volume to down volume ration over the last few months, tight price action and all time highs within striking distance, this is a stock chart exhibiting very bullish characteristics.

!Important:  EXLS has not yet reported earnings and will do so on November 13th before the market opens.  Just as I do with nearly all companies, I don’t recommend holding EXLS through its earnings report.  It’s just too much of a risk.  While Veraz Networks (VRAZ) is not the same caliber of company that EXLS is just look at what happened to it after reporting earnings on Wednesday.  Wait for EXLS to report and if its not too extended consider a position.

SELFINVESTORS RATING: With a total score of 52/60 (25/30 for fundamentals, 27/30 for technical), ExlService Holdings (EXLS) is a top 10 Self Investors breakout stock.

Full Disclosure/Disclaimer: The stock of the day is by no means a buy recommendation.  Please do your own research and make a personal decision based on your own tolerance for risk.  I currently do not own a position in ExlService (EXLS)

October Highs Most Likely A Long Term Top

Most trading days don’t help us much to predict future price direction due to lack of price and volume movement.  Today was not one of those days.  Bears gritted their teeth today as institutions flushed positions en masse taking the S&P and Dow beyond key support levels.  In my weekend report I had mentioned that price action alone was somewhat bullish but that volume levels revealed a different story.  The best course of action was to wait it out and let the winner of the tug-o-war be revealed.

"The problem is that volume levels indicate these patterns are in danger of failing so the best course of action is to just wait with a significant portion of cash on the sidelines.  I’m going to let the patterns develop and give the market time to reveal just where it’s going.  With key support levels near by and some breakout resistance areas in place above, we need confirmation of a move one way or the other before getting more aggressive on either side.  The lines in the sand have been drawn.  Let the tug-o-war begin."

Today, the winner emerged with the bears victorious.  With the Fed about out of magic bullets to save the market, I believe at this point you have to have the mindset that the October highs are a long term top and that it will be several months AT LEAST before we see those levels again.  There will certainly be many highly profitable shorter term trades along the way, but to remain 100% invested with a "hold" strategy at this point in my opinion is a very big mistake.

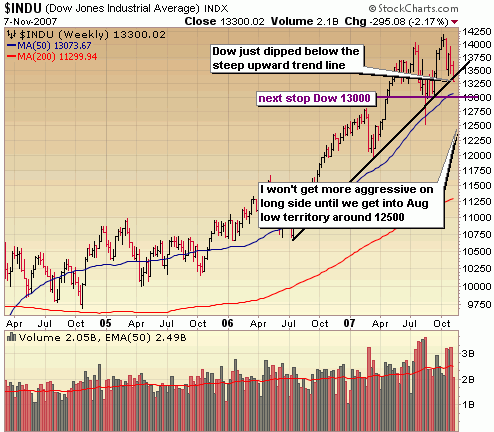
Let’s turn to the charts.  Whenever the market makes a big move either way with key support or resistance levels being tested I like to take a step back and look at the bigger picture to help remove some of the emotion that can occur on a day like today.  So tonight, I take a look at the longer term weekly charts of the major indices.

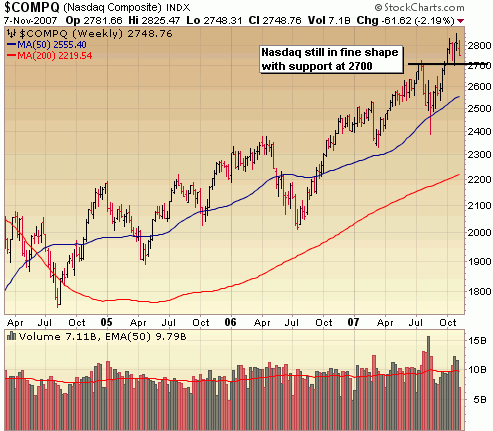
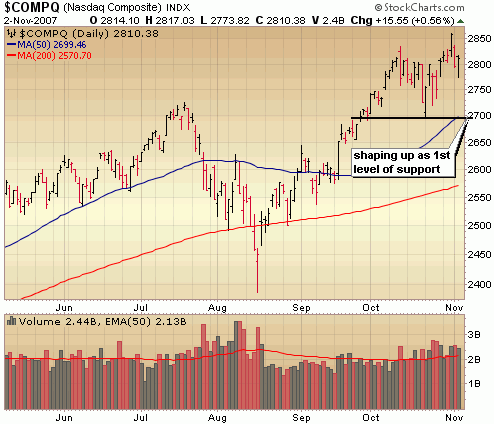
Ok no problems in the Nasdaq yet with some decent support at 2700.  However, led by a Cisco plunge it could take a bit of a beating tomorrow.

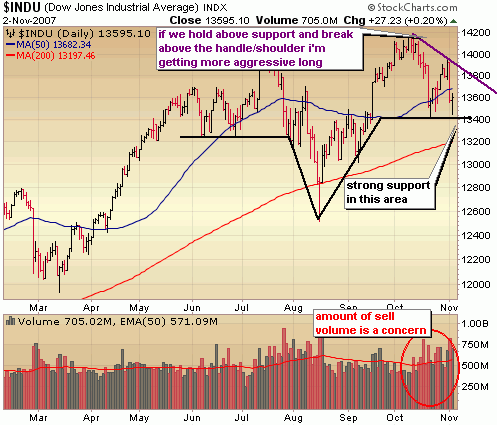
Notice the Dow just barely taking out that steep upward trend.  Given today’s selling intensity with a close at near the absolute low, it’s safe to say that Dow 13000 is all but assured.  Maybe not tomorrow but very soon.  We may get a temporary bounce from that level but I think that ultimately we’re going to need to test those August levels.  It’s at this level where I may get more aggressive on the long side than I have been.

The S&P is right on that 50 day moving average of the weekly chart which has been a strong area of support in the past.  However, given the fact that the S&P took out the 200 day moving average on the daily chart with the intensity it did, I think we need to test the area around 1450-1460 very soon.  Again, I want to see those August lows tested before I get more aggressive on the long side.

::: Major Indices Performance – The Numbers :::

(Note: volume averages are based on the average over the past 50 days)
Data as of 4:00EST – End of Day November 7th 2007

Nasdaq: DOWN 2.7% today with volume 16% ABOVE average
Nasdaq ETF (QQQQ) DOWN 2.45%, volume 52% ABOVE average
Dow: DOWN 2.64%, with volume 23% ABOVE the average
Dow ETF (DIA): DOWN 2.31%, volume 41% ABOVE the average
S&P ETF (SPY): DOWN 2.74%, volume 76% ABOVE the average
Russell Small Cap ETF (IWM): DOWN 3.1%, volume 36% ABOVE the average

::: SelflInvestors Leading Stocks :::

The Self Investors Leading Stocks Index is comprised of stocks in the Breakout Tracker, which is a database of the fastest growing companies near a breakout or having already broken out of a base.  I think the fact that there were just 2 leading stocks that moved up today with significant volume says it all.

Summary:

* Decliners led Advancers 344 to 29 (wow!)
* Advancers were up an average of 1.24% today, with volume 45% ABOVE average
* Decliners were down an average of 3.33% with volume 19% ABOVE average
* The total SI Leading Stocks Index was DOWN 2.97% today with volume 21% ABOVE average

::: Where’s the Money Flowing :::

Many investing websites provide leading industries based on price performance alone. However, without accompanying volume levels, this can sometimes be misleading.  The only way that I know of to gauge industry/sector strength WITH volume levels is through the analysis of ETF’s.  A couple years ago this was not possible, but as more traders/investors use ETF’s they become a much better tool for gauging the health of the market and seeing where the money is flowing (or not flowing).  Using the proprietary SelfInvestors Demand Indicator score which measures price and volume movements, I’m able to quickly see which sectors/industries are seeing the greatest inflows of cash.  For a detailed look at how I go about gauging sector/industry strength please see the following post: http://selfinvestors.com/si/industry_tracking/

* Current Leading Sectors/Industries (over last 30 trading days):  
Internet Infrastructure, Clean Energy, Gold Miners, Gold, Commodities
                                          
* Current Lagging Sectors/Industries (over last 30 trading days): 
Semis, Retail, Utilities, Financials

* Today’s Market Moving Industries/Sectors (UP):
Gold

* Today’s Market Moving Industries/Sectors (DOWN):
Financials, Regional Banks, Energy, Broker/Dealers, Real Estate, Nuclear Energy

::: Stocks :::

The stocks section will be an area where I highlight one stock selected from a group of stocks moving up with volume well above average and most likely breaking out of a base or consolidation. 

Sorry, no stock of the day today.  Just two leading stocks moved up with volume today – Foster Wheeler (FWLT) and Guess (GES)

Price Action Still Bullish, Volume Not; China Nepstar Drugstore (NPD) IPO

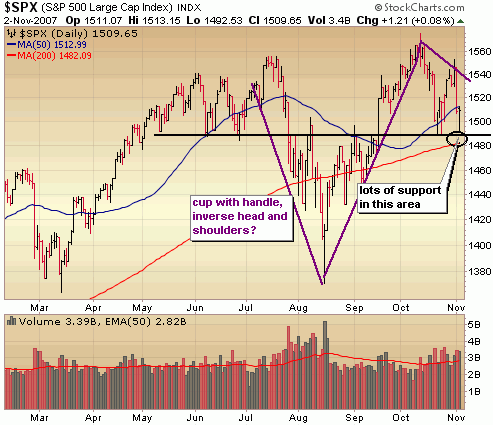
With the Fed announcement as the center piece, the market gyrated this way and that once again while the market attempted to price in the Fed cut and an array of economic data which to the surprise of many was quite bullish – strong GDP, tame inflation and a robust jobs number but tempered by weakening manufacturing.  OK well not too surprising I suppose.  It seems that the government is going to continue to push out bullish economic data regardless, but time will be the ultimate bearer of truth.  I can’t imagine where this market would be if that Friday jobs number came in much weaker than expected.  The word precipitous comes to mind.  At any rate, as I always do I turn to the leading indicators of where this market is headed and that’s right in the technicals.  What emerges?  What emerges is a divergence between price and volume in that the overall price action in the indices is leaning bullish with what could be considered a cup with handle or even inverse head and shoulders pattern in the Dow and S&P.  The problem is that volume levels indicate these patterns are in danger of failing so the best course of action is to just wait with a significant portion of cash on the sidelines.  I’m going to let the patterns develop and give the market time to reveal just where it’s going.  With key support levels near by and some breakout resistance areas in place above, we need confirmation of a move one way or the other before getting more aggressive on either side.  The lines in the sand have been drawn.  Let the tug-o-war begin.

The tech heavy Nasdaq continues to lead the way and well above the first level of support around 2700.

Notice the inverse head and shoulders and even what could be construed as a cup with high handle formation.  Either way, the price action alone is considered bullish.  What isn’t bullish is the amount of sell volume we’ve been seeing which sets us up for potential failure up here.  The area between 13200 – 13400 is key support for the Dow.  I won’t be getting bullish unless buy volume begins to overshadow sell volume AND the Dow breaks through the downward trend off that October high.

The S&P has carved out a similar pattern so I’m looking for similar action.  It needs to hold up at support around 1480 – 1490 and ultimately breakout with volume above the short downward trend from the October high.  The lines in the sand ou

::: Model Portfolio Update :::

The overall market dipped a bit last week but the Self Investors Model Portfolio continues to surge higher tacking on another 3.2% for the week, bringing the year to date performance to  27.6% (exactly where it closed 2006).  I’m continuing to tread lightly in this volatile, unpredictable trading environment.  As I’ve mentioned before, it really is one of the most difficult markets to read I’ve seen in quite awhile so I’m not willing to make large bets on either side (currently sitting on 55% in cash).  During the week I did close out my long trade in RICK for a 54% gain, but still holding the other "adult club" stock PTT for more.  On the losing side, the Fed rally forced me out of my QID position for a small 5% loss.  Honestly, I’m not sure what I was thinking with this particular trade.  Why I didn’t initiate a trade in the Dow Ultrashort (DXD) or S&P UltraShort (SDS) I don’t know.  I liked the resistance that the Q’s were bumping up against and felt that tech was ready for some profit taking, but the S&P and Dow are far weaker indices right now.  I’ll be the first to admit it wasn’t the my best  trade of the year.  I also dumped my NGA position later in the week.  It still looks quite bullish but I wanted to move more to cash following the market meltdown on Thursday.  I’ll continue to trade with extreme caution over at least the next couple weeks.

::: Best/Worst Performers :::

– Top 10 Performing Industries For the Week –

1. Nonmetallic Mineral & Mining: 5.65%
2. Internet Service Providers: 5.30%
3. Silver: 4.90%
4. Semiconductor – Memory Chips: 4.30%
5. Gaming Activities: 3.80%
6. Application Software: 3.55%
7. Drugs Wholesale:  3.50%
8. Data Storage Devices: 3.10%
9. Independent Oil & Gas: 2.85%
10. Medical Equipment Wholesale: 2.85%

– Top 10 Worst Performing Industries For the Week –

1. Surety & Title Insurance: -21.45%
2. Long Distance Carriers: -13.00%
3. Medical Practitioners: -11.75%
4. Mortgage Investment: -10.60%
5. Residential Construction: -9.75%
6. Savings & Loans: -9.70%
7. Apparel Footwear: -8.10%
8. Regional Banks – SE: -7.90%
9. Manufactured Housing: -7.70%
10. Sporting Activities: -7.15%

– Top 5 Best Performing ETFs For the Week –
 
1. India Fund (IFN)  9.60%
2. US Natural Gas (UNG) 7.40%
3. Ishares Commodies (GSG) 5.00%
4. Market Vectors Gold MIners (GDX) 4.75%
5. US Oil (USO) 4.50%

– Worst 5 Performing ETF’s –

1. Herzfeld Cuba (CUBA)  -17.15%
2. KBW Banking (KRE)  -9.05%
3. Ishares Home Construction (ITB)  -8.40%
4. SPDR Homebuilders (XHB) -7.35%
5. HLDRS Regional Banks (RKH)  -6.10%

:::  IPO’s Worth Watching for This Week :::

There are few great looking IPO’s coming this week with China IPO’s leading the way once again along with a few energy IPO’s

1.  China Nepstar Drugstore (NPD):  The rapidly expanding company operates China’s largest retail drugstore chain, with some 1,800 stores in more than 60 coastal cities and adjoining provinces. Besides pharmacy services, China Nepstar stores carry up to 2,600 items, including over-the-counter drugs; nutritional supplements; and herbal, personal care, and family care products. They also offer consumable, seasonal, and promotional items, as well as about 1,100 private label products. The company distributes to stores through a national distribution center in Shenzhen and 11 regional distribution centers throughout China.  Trading set to begin on Friday.

2. Agria Corp (GRO):  Agria supplies corn seeds, sheep breeding products, and seedlings to a variety of customers throughout China. Corn seed products include four proprietary strains of corn seed (sold under the Primalights III brand) offering characteristics that allow them to thrive in various climate zones. The company also produces, sells, and distributes generic corn seed strains. Sheep breeding products consist of frozen sheep semen, sheep embryos, and breeder sheep. Agria also sells blackberry, raspberry, date, and white bark pine seedlings to end users such as plantation nurseries.    Trading set to begin on Thursday.

3.  AirMedia Group (AMCN):  specializes in advertising to air travelers in China. It operates more than 2,000 digital TV screens in airports and places ads on more than 16,000 TVs on airplanes. To help attract an audience to its ads, AirMedia Group also runs news, weather, sports, travel, comedy, and documentary clips provided by China Central Television (CCTV). Selling time slots to both domestic and international advertisers accounts for half of AirMedia Group’s revenues. Some of its top customers include Lexus, Hitachi, and Nokia.    Trading set to begin Wednesday.

4. OSG America (OSP):  transports crude oil and refined petroleum products for oil companies and independent refiners, including key clients Chevron, Sunoco, and Marathon Oil. Its fleet consists of 10 product carriers, seven articulated tug barges (ATBs), and one conventional tug barge (CTB) which transport from refineries on the Gulf Coast to Florida; from refineries on the East Coast to New England; and from refineries on the West Coast to California and Oregon. The boats’ aggregate carrying capacity is about 5 million barrels. OSG America also owns nearly 40% of Alaska Tanker which carries crude oil from Alaska to the continental US.  Trading set to begin on Friday

5. The Ensign Group (ENSG):  offers both short-term rehabilitative and long-term assisted living services. Its owned and leased facilities have a collective capacity of 7,300 beds and are primarily located in California, Arizona, and Texas. Each property is operated by a separate subsidiary with independent management; Ensign Group’s Service Center provides centralized administration, finance, and clinical consulting services. The company derives three-fourths of its revenues from Medicaid and Medicare programs.  Trading set to begin on Friday.

6.  SandRidge Energy (SD):  explores for and produces oil and natural gas, mainly in West Texas. The company also owns and operates drilling rigs and a related oilfield services business. In addition it operates gas gathering, marketing, and processing subsidiaries. Its 87%-owned PetroSource subsidiary operates CO2-treating and transportation facilities and has tertiary oil recovery operations. SandRidge Energy also has oil and gas acreage in Oklahoma’s Anadarko and Arkoma Basins, and in Colorado’s Piceance Basin.  Trading set to begin on Tuesday.

7.  Approach Resources (AREX):  Specializing in finding and exploiting unconventional reservoirs, the company operates primarily in West Texas’ Ozona Northeast field, while developing its operations in Western Kentucky, and Northern New Mexico. The company’s unconventional designation results from a focus on developing natural gas reserves in tight gas sands and shale areas, necessitating a reliance on advanced completion, fracturing and drilling techniques.  Trading set to begin on Thursday.

::: Upcoming Economic Reports (11/5/07 – 11/9/07) :::

Monday:         ISM Services
Tuesday:       None
Wednesday: Productivity, Wholesale Inventories, Crude Inventories
Thursday:      Initial Claims
Friday:            Export/Import Prices, Trade Balance, Mich. Sentiment

::: Upcoming Notable Earnings Reports :::

Monday:  Sun Hydraulics (SNHY), T-3 Energy Services (TTES), Simcere Pharmaceutical Group (SCR), LSB Industries (LXU), American Oriental Biosciences (AOB), Quintana Maritime (QMAR), Balchem (BCPC)

Tuesday:  Jacobs Engineering (JEC), Herbal Life (HLF), Banco Bredesco (BBD), Hologic (HOLX)

Wednesday: Cisco Systems (CSCO), ICF International (ICFI), J2 Global Communications (JCOM), US Global Investors (GROW), Ctrip.com (CTRP), InnerWorkings (INWK)

Thursday: Nvidia (NVDA), Dolby Labs (DLB), Gulfport Energy (GPOR), Credicorp (BAP), KHD Humboldt (KHD), Comtech (COGO), Hansen Natural (HANS), Perficient (PRFT), Gmarket.com (GMKT)

Friday: JA Solar (JASO)

::: In Case You Missed It – SelfInvestors Blog Entries of the Past Week :::

1. Barry on Trading Options: All About Delta

2. Atheros Communications (ATHR) & BE Aerospace (BEAV) Breakout On Earnings

3. Pericom (PSEM), Mastercard (MA) & Partner Communications (PTNR) Breakout on Earnings

4. Will Market Wobble With Fed Wheels Off?; Stock of Day – Mastercard (MA)

5.  Crocs (CROX) Crushed, Bankrate (RATE) On Verge of Breakout After Earnings

6.  Watch Bulls/Bears Battle From Sidelines; Stock of Day – Cynosure (CYNO)

7.  Flowserve (FLS), HMS (HMSY), Stanley (SXE), eHealth (EHTH), Open Text (OTEX) & GFI Group (GFIG) All Soar to New Heights