Most trading days don’t help us much to predict future price direction due to lack of price and volume movement. Today was not one of those days. Bears gritted their teeth today as institutions flushed positions en masse taking the S&P and Dow beyond key support levels. In my weekend report I had mentioned that price action alone was somewhat bullish but that volume levels revealed a different story. The best course of action was to wait it out and let the winner of the tug-o-war be revealed.
"The problem is that volume levels indicate these patterns are in danger of failing so the best course of action is to just wait with a significant portion of cash on the sidelines. I’m going to let the patterns develop and give the market time to reveal just where it’s going. With key support levels near by and some breakout resistance areas in place above, we need confirmation of a move one way or the other before getting more aggressive on either side. The lines in the sand have been drawn. Let the tug-o-war begin."
Today, the winner emerged with the bears victorious. With the Fed about out of magic bullets to save the market, I believe at this point you have to have the mindset that the October highs are a long term top and that it will be several months AT LEAST before we see those levels again. There will certainly be many highly profitable shorter term trades along the way, but to remain 100% invested with a "hold" strategy at this point in my opinion is a very big mistake.
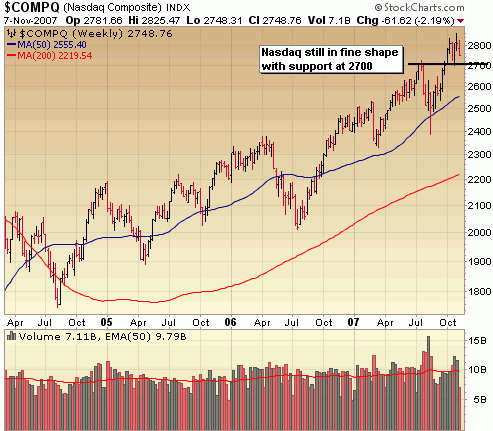
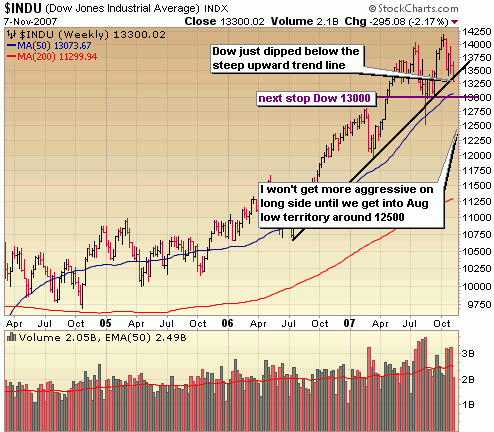
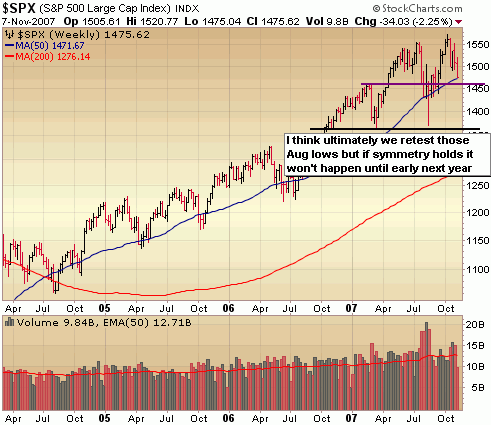
Let’s turn to the charts. Whenever the market makes a big move either way with key support or resistance levels being tested I like to take a step back and look at the bigger picture to help remove some of the emotion that can occur on a day like today. So tonight, I take a look at the longer term weekly charts of the major indices.
Ok no problems in the Nasdaq yet with some decent support at 2700. However, led by a Cisco plunge it could take a bit of a beating tomorrow.
Notice the Dow just barely taking out that steep upward trend. Given today’s selling intensity with a close at near the absolute low, it’s safe to say that Dow 13000 is all but assured. Maybe not tomorrow but very soon. We may get a temporary bounce from that level but I think that ultimately we’re going to need to test those August levels. It’s at this level where I may get more aggressive on the long side than I have been.
The S&P is right on that 50 day moving average of the weekly chart which has been a strong area of support in the past. However, given the fact that the S&P took out the 200 day moving average on the daily chart with the intensity it did, I think we need to test the area around 1450-1460 very soon. Again, I want to see those August lows tested before I get more aggressive on the long side.
::: Major Indices Performance – The Numbers :::
(Note: volume averages are based on the average over the past 50 days)
Data as of 4:00EST – End of Day November 7th 2007
Nasdaq: DOWN 2.7% today with volume 16% ABOVE average
Nasdaq ETF (QQQQ) DOWN 2.45%, volume 52% ABOVE average
Dow: DOWN 2.64%, with volume 23% ABOVE the average
Dow ETF (DIA): DOWN 2.31%, volume 41% ABOVE the average
S&P ETF (SPY): DOWN 2.74%, volume 76% ABOVE the average
Russell Small Cap ETF (IWM): DOWN 3.1%, volume 36% ABOVE the average
::: SelflInvestors Leading Stocks :::
The Self Investors Leading Stocks Index is comprised of stocks in the Breakout Tracker, which is a database of the fastest growing companies near a breakout or having already broken out of a base. I think the fact that there were just 2 leading stocks that moved up today with significant volume says it all.
Summary:
* Decliners led Advancers 344 to 29 (wow!)
* Advancers were up an average of 1.24% today, with volume 45% ABOVE average
* Decliners were down an average of 3.33% with volume 19% ABOVE average
* The total SI Leading Stocks Index was DOWN 2.97% today with volume 21% ABOVE average
::: Where’s the Money Flowing :::
Many investing websites provide leading industries based on price performance alone. However, without accompanying volume levels, this can sometimes be misleading. The only way that I know of to gauge industry/sector strength WITH volume levels is through the analysis of ETF’s. A couple years ago this was not possible, but as more traders/investors use ETF’s they become a much better tool for gauging the health of the market and seeing where the money is flowing (or not flowing). Using the proprietary SelfInvestors Demand Indicator score which measures price and volume movements, I’m able to quickly see which sectors/industries are seeing the greatest inflows of cash. For a detailed look at how I go about gauging sector/industry strength please see the following post: http://selfinvestors.com/si/industry_tracking/
* Current Leading Sectors/Industries (over last 30 trading days):
Internet Infrastructure, Clean Energy, Gold Miners, Gold, Commodities
* Current Lagging Sectors/Industries (over last 30 trading days):
Semis, Retail, Utilities, Financials
* Today’s Market Moving Industries/Sectors (UP):
Gold
* Today’s Market Moving Industries/Sectors (DOWN):
Financials, Regional Banks, Energy, Broker/Dealers, Real Estate, Nuclear Energy
::: Stocks :::
The stocks section will be an area where I highlight one stock selected from a group of stocks moving up with volume well above average and most likely breaking out of a base or consolidation.
Sorry, no stock of the day today. Just two leading stocks moved up with volume today – Foster Wheeler (FWLT) and Guess (GES)