Well, the much anticipated relief rally finally arrived last week with the S&P vaulting more than 13% off oversold conditions. The rally was a bit deceptive with no real spike in fear or capitulation accompanying the move, but remember that capitulation doesn’t necessarily need to occur to mark a bottom… and that’s not to say this is “THE” bottom. There’s certainly a tremendous amount of overhead resistance to work through and this is nothing more than a short covering, bargain hunting rally until bulls can prove themselves by breaching key downtrend lines. I’ll keep the commentary light this week and jump right into the charts..
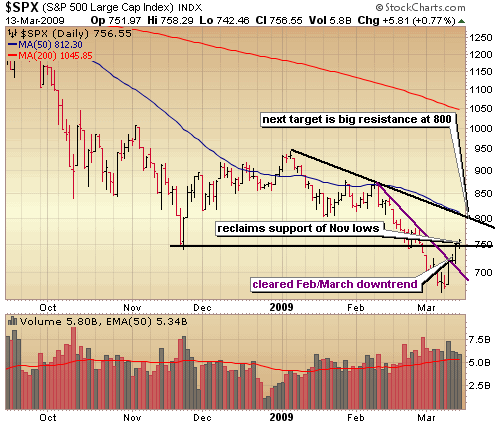
Everyone wants to know.. is this the bottom? How long will the rally last? I think the charts can provide some clues to that. Taking a look at the magnitude of the initial rallies off the October and November lows reveals that the average gain was right around 20% with the rally in October rising 19% over 6 days and the November rally producing a quick 21.5% gain in just 5 days. If we assume that this rally will be in the neighborhood of those moves and falter after popping 20%, that runs the S&P500 right into big resistance at 800. So, it’s quite possible we see another quick 5 – 7% in the first half of next week. Yeah, these bear market rallies are sharp and deceptive leaving many behind. If you missed it, don’t sweat it! Whatever you do, don’t chase these rallies. Be patient and wait for a digestion of this sharp move up because it will come.
Taking a look at the technicals of the S&P shows the break of the Feb/March downtrend on Wednesday, followed by another big surge on Thursday that sent the S&P back above the November lows….
The fact it was able to hold that level on Friday indicates there is considerable strength to this rally. BUT. … please keep in mind the volume is diminishing with each up day so tiring a bit. Yes, as I mentioned above there is a decent shot at a quick test of 800 before a significant pull back but the odds are just as good of retracing this move before that happens. Do not get aggressive on the long side up here.
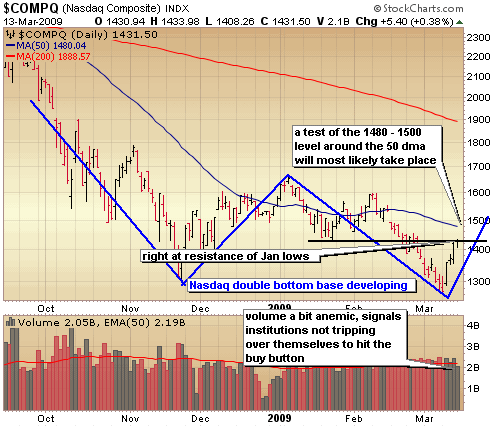
A big double bottom base is potentially forming in the Nasdaq which wouldn’t be confirmed until it breaks the middle peak it formed right at the beginning of the year around 1665. There is much work to do before that can take place. The Nasdaq also broke the Feb/March downtrend on Wednesday but is now hitting significant resistance of the Jan lows. If it doesn’t have any trouble there in the coming days, look for a test of the next big level of resistance around the 50 day moving average (roughly the 1500 level). Volume levels are a bit anemic indicating the big fellas are not putting big money to work yet. This rally was undoubtedly fueled by short covering and bargain hunting. I’ll say it again, don’t fear missing this rally. Get the watch lists together and wait for a better entry if you missed this move.
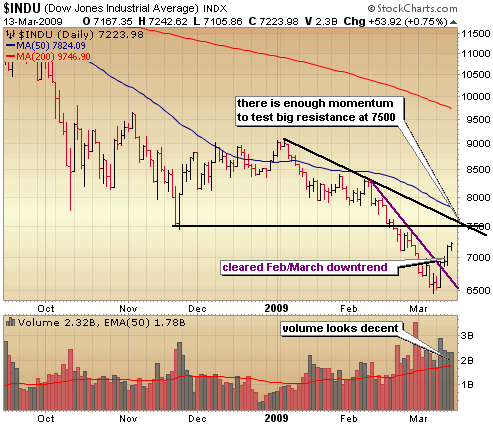
I know the Dow isn’t the best representative of the market, but it’s still the index that the average person as well as the main stream media pays attention to, so it’s still worth taking a look at. There is a tremendous amount of overhead resistance to work through in the Dow with another 250 point surge just getting back to big resistance of the November lows. Volume was much better in the Dow but we can throw that out considering there are only 30 stocks traded. A test of 7500 is a near certainty with the possibility of a test of the 50 day moving average around the 7750 level a decent possibility in the coming weeks.
To sum up this week, this rally has enough legs to run us right into major resistance levels at Nasdaq 1480 – 1500, S&P 800 and Dow 7500 – 7750. If/when we hit those levels, you better be looking to take your profits and move back to get cash and/or put shorts back on.
:::::::::::::::::::::::::::::::::::::::::::
Isn’t Time You Took Control of Your Financial Future?
The Self Investors Model Portfolio wrapped up 2006 with a gain of 27.6%, 2007 with a gain of 30.2%, finished nearly 35% ahead of the S&P in a very difficult 2008 and is off to a great start here in 2009, ahead of the S&P YTD performance by 16%. This is a REAL portfolio with position sizing and not based on extrapolated hypothetical gains for each trade. On average it beats the S&P by 20% per year. The result?
* Putting $100K into an S&P tracking index at the beginning of 2004 and you’re down more than $35K.
* The Self Investors Model in the same time period would have more than doubled your money. That’s the power of not buying and holding!
Would you like to receive buy and sell alerts in the Model Portfolio within minutes (NEW! now get them via instant messaging in near real time) of each transaction? You can receive these along with ALL of the tracking tools and video reports with the very popular Gold membership. Don’t delay, get started today and join me for many more highly profitable months here at SelfInvestors.com.
::: Best/Worst Performers :::
– Top 10 Performing Industries For the Week –
1. Resorts & Casinos: 35.15%
2. Semis – Memory Chips: 27.45%
3. Banks – Midwest: 25.70%
4. CATV Systems: 24.40%
5. Recreational Vehicles: 24.15%
6. Auto Dealerships: 22.70%
7. Life Insurance: 22.30%
8. Major Airlines: 22.10%
9. Toy & Hobby Stores: 21.35%
10. Money Center Banks: 21.00%
– Top 10 Worst Performing Industries For the Week –
1. Beverages – Wineries & Distill: -1.25%
2. Gold: 1.10%
3. Drugs Wholesale: 1.25%
4. Diversified Utilities: 1.80%
5. Advertising Agencies: 2.10%
6. Gas Utilities: 2.95%
7. Multimedia & Graphics Software: 3.05%
8. Aerospace/Defense: 3.10%
9. Electric Utilities: 3.55%
10. Medical Laboratories & Research: 3.65%
– Top 5 Best Performing ETFs For the Week –
(excluding leveraged ETFs)
1. HLDRS Regional Banks (RKH) 44.75%
2. SPDR Series Trust (KBE) 37.38%
3. SPDR Financials (XLF) 32.50%
4. PowerShares Private Equity (PSP) 22.90%
5. iShares Broker Dealer (IAI) 22.65%
– Worst 5 Performing ETF’s –
1. iShares Malaysia (EWM) -2.95%
2. iShares 20 Yr Treasuries (TLT) -1.45%
3. US Oil Fund (USO) -1.30%
4. iShares Gold (IAU) -1.25%
5. SPDR Gold (GLD) -1.05%
::: Upcoming Economic Reports (3/16/2009- 3/20/2009) :::
Monday: Empire Manufacturing, Capacity Utilization, Industrial Production
Tuesday: PPI, Building Permits, Housing Starts
Wednesday: FOMC Rate Decision, CPI, Crude Inventories
Thursday: Leading Indicators, Initial Claims
Friday: None
::: Earnings I’m Watching This Week :::
Monday: Sina Corp (SINA)
Tuesday: Canadian Solar (CSIQ), Factet Research (FDS)
Wednesday: Nike (NKE), Oracle (ORCL)
Thursday: China Sunergy (CSUN), FedEx (FDX)


