All posts by Tate Dwinnell

When to Sell Before Earnings

Question:

You said you don’t like to hold a stock through it’s earnings date.  I own DRIV with its earning date of 10-26.  How close to the earnings date would you recommend selling?  The stock just hugs its 20 day MA and I thought for sure it was ready to break below that today.  Instead it opened on the upside and as of now is still rising.  I think it has pretty much run its course and that I should get out.  It has doubled its average number of days from base to peak and exceeded its average gain for that same period. 
 
From the chart I can’t figure if the institutions are letting the price go up then dumping some shares or if they wait for the price to drop to the 20 day then buy shares.  Since the trend seems to be up I’m guessing its the latter.  Key word there is "guess".  At some point the trend is over and past trends in that stock show that it could be a sudden drop without warning.  I would rather take a small profit than none at all.

My Response:

I can’t give buy and sell recommendations on an individual basis due to SEC regulations (not to mention we all have different risk levels), but I can tell you what I’ve done.  The stock looked great until yesterday when sell volume picked up signficantly. It did briefly dip below that 20 dma this morning but bounced back and has flatlined over the past few hours.  Over the long term it is a great company and should report very good earnings, but I like to lock in profits on any weakness in any stock especially before earnings.  Might be worth holding for a few more days if it can stay above that 20dma today. In a nutshell, I almost always sell before earnings and whether that’s one day before or several days before depends on the health of that particular stocks.

A little hint about the actions of institutions – if a stock is showing big volume without price progress then they are selling into the rising stock.  If the stock hits the 20 dma and bounces with volume, then they are adding shares at that short term moving average.   Based on the current volume and price activity in this one it looks like they aren’t doing much of anything right now. 


Catching Hot IPO’s Out of the Chute

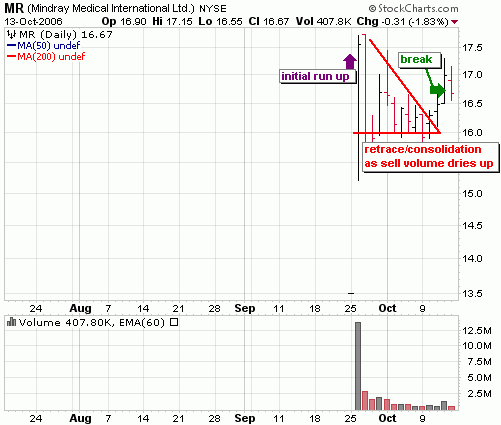
The hottest IPOs often run up significantly before ever forming a real base, trending higher and higher right out of the gates in a stair step pattern.  This likelihood only increases in a bull market when their is great enthusiasm for the next hot stock.   So what kind of pattern am I looking for in these situations?  Basically, what I’m looking for is a run up, a retrace/consolidation, then a break.  It may look a lot like a bullish pennant or flag formation as we’ll see in the chart of recent IPO Mindray Medical International (MR) below.

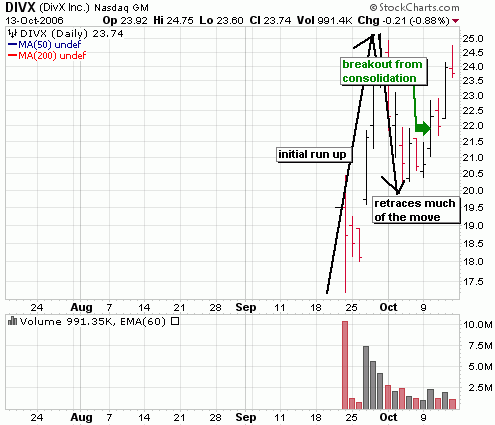
DIVX, a recent purchase in the SelfInvestors Model Portfolio provides a good example of this kind of move.  The stock spent a few days running up with good volume, retraced much of that move as sell volume dries up, then breaks out of that consolidation with a pick up in buy volume.  One thing to keep in mind with this pattern: make sure the volume is there during buying and dries up during the selling (the volume bars should look like the right side of a bell curve).

Mindray Medical (MR) is another recent hot IPO that has formed what looks more like a bullish pennant pattern which is outlined in red.  You see the retracement happens much sooner (immediately following the IPO) and slides into its first consolidation.  On October 11th, the stock broke out of this consolidation but I would have held off on a purchase at this point because the volume wasn’t there.  Volume did pick up the very next day and it could have been purchased here, but being patient has provided a much better opportunity right here right now.

After Market Update – The Consumer is Alive and Well; Stock of Day – American Oriental Bioengineering (AOB)

::: Today’s Market Action :::

With robust earnings out of Costco, Pepsi and McDonalds its clear the consumer remains alive and well, with an ever expanding waistline.  That was enough to kick start the market in the morning and the Dow added fuel to the fire in the afternoon with its "goldilocks" beige book report, further indicating a soft landing.  Inflation is in check, manufacturing remains strong and the consumer continues to spend spend spend all despite continuing cooling in the housing sector.  It all seems a little too perfect doesn’t it?  No question this market is currently priced for perfection and is fragile up at these levels, but as of today there is still no indication of topping action.  The only negative in today’s action is that volume could have been a bit better. 

(Note: volume averages are based on the average over the past 50 days)
Data as of end of day

Nasdaq: up 1.64% today with volume 14% ABOVE  average
Nasdaq ETF (QQQQ): up 1.66%, volume 11% BELOW the average
Dow: up .81%, volume 36% ABOVE average
Dow ETF (DIA): up .74%, volume 16% BELOW the average
S&P ETF (SPY): up .87%, volume 11% BELOW the average
Russell Small Cap ETF (IWM): up 2.02%, volume 10% BELOW the average

::: SelflInvestors Leading Stocks :::

SelfInvestors Leading Stocks did fantastic today, further validating today’s move.

Summary:

* Advancers Leading Decliners 282 to 38.
* Advancers are up an average of 2.12% today, with volume 9% ABOVE the average
* Decliners are down 1.02 % with volume 45% ABOVE average
* The total SI Leading Stocks Index is up 1.75% today with volume 13% ABOVE the average

* Where’s the Money Flowing *

Many investing websites just provide leading industries based on price performance alone.. without the volume, this can be misleading.  The only way that I know of to guage industry/sector strength WITH volume levels is through the analysis of ETF’s.  A couple years ago this was not possible, but as more traders/investors use ETF’s they become a much better tool for guaging the health of the market and seeing where the money is flowing (or not flowing).  Using the proprietary SelfInvestors Demand Indicator score which measures price and volume movements, I’m able to quickly see which sectors/industries are seeing the greatest inflows of cash. 

* Leading Sectors/Industries:  HomeBuilders, Software, Retail, Technology and Consumer Services (no changes here for the past several weeks)

* Lagging Sectors/Industries – Energy, Energy, Energy.. and Energy AND Gold (also no changes here for the past several weeks)

* Today’s Market Movers (UP) – Homebuilders led the way again today (that’s a bit of a scary thought).  Retail was also a big mover as was Energy and Software.

* Today’s Market Movers (DOWN) – No significant down movers today.

** Stocks **

The stocks section will be an area where I highlight one stock selected from a group of stocks moving up with volume well above average.  Today’s stock is American Oriental Bioeng (AOB), a Chinese ADR.

ABOUT:  American Oriental Bioengineering, Inc. is engaged in the development and production of plant-based pharmaceutical (PBP) products and plant-based nutraceutical (PBN) products. PBNs, also referred to as dietary supplements or nutritional supplements, are essentially prophylactic or preventive, in contrast with the PBP products. PBPs, composed of leaves and roots of one or more plants, have certain medicinal function and treat one or more illnesses or symptoms of illnesses. Twenty-eight regional representative offices throughout China are primarily responsible for servicing the Company’s distribution platforms and monitoring the markets. Products include UrinStopper Patch and UrinStopper Capsule introduced, during the year ended December 31, 2005. In April 2006, the Company completed the acquisition of Guangxi Lingfeng Pharmaceutical Company Limited, a pharmaceutical company specializing in the manufacture and distribution of plant-based medicines in China.

FUNDAMENTAL: While the company can be fairly inconsistent in its earnings growth from quarter to quarer, it has grown from 30 – 50% in each of the last few years

TECHNICAL: Cleared a 5 month base on Oct. 9th which is part of a much larger nearly one year base.  The stock looks poised to take out all time highs of 7.68 within the next couple weeks.

SELFINVESTORS RATING: With a total score of 51/60, AOB is considered a top breakout stock.

Weekly Market Report – Ready for a Pre-Earnings Rest

Two things are now very clear in this market.  The rally is for real and it’s due for a rest.  The volume accompanying the move up and the lack of a sharp reversal after the Dow touched all time highs are good indications that this market has some legs.. but those legs need a rest.  With the major indices hovering around "psychological" resistance areas (Dow 12000, S&P 1350 and Nasdaq 2300) there’s a good chance that will happen sooner rather than later. 

::: Model Portfolio Update :::

It was not a good week for the Model Portfolio.  The market went one way and the portfolio went the other after taking sizable hits with my 2 semiconductor plays (which I’m still holding) and smaller losses on a couple short positions.  It was a busy week in terms of the number of transactions.  In the beginning of the week, 5 new long positions were initiated following a breakout of the Dow to all time highs.  On the other hand, 2 shorts were initiated in commodity plays. 

A few positions were closed out during the week – 3 long positions in Cognizant Tech Solutions (CTSH), PrivateBancorp (PVTB) and NutriSystems (NTRI); one short in Kinetic Concepts (KCI).   I locked in a small 4% profit in CTSH following several days of weakening technicals.  With the market in near term overbought territory I’m locking in profits in stocks not showing strength well above average.  I also locked in a small profit in PVTB following a high volume drop below the 50 day moving average.  NTRI was sold quickly for a small loss after the stock failed to stage a big follow through after breaking out.  Buy volume was meager and sell volume picked up on Oct. 3rd when the position was sold.  The KCI short was covered for a small loss on Oct. 5th for  a small loss after it appeared the stock was gaining momentum and would clear resistance of the 50 day moving average.  The stock vaulted 5% the very next day.

The game plan at this point is to avoid making large bets on the long side and wait for the pull back, which would offer the opportunity to get much more aggressive on the long side and begin leveraging with margin.  Despite a 1.1% loss in the portfolio last week, it still sits with a 16.5% YTD return.. more than double the S&P500.

::: PinPoint the Highest Ranked Breakout Stocks in Just Minutes Each Day! :::

Want to take your membership to the next level?  Premium members who have been following along with buy and sell alerts in the Model Portfolio are smashing average returns with a 15% YTD performance.  In addition to alerting you to the best opportunities on the long side, short opportunities are used to make money during a downturn.  That’s just one of many premium features….

There are literally dozens of breakout stocks to watch every day.  How about a database of stocks all ranked according to fundamentals and technicals, complete with pivot points, earnings date, % change from breakout and moving averages, future earnings estimates and relative strength rating?  How about Stock Watch reports highlighting long and short opportunities for the coming week?  It will save you hours of research every week and drastically improve your results.

Try it out for yourself for 30 days!  Sign in to your account here: http://www.selfinvestors.com/amember/member.php and take advantage of the no risk trial.

::: Best/Worst Performers :::

– Top 10 Performing Industries For the Week –

1. Restaurants                                    10.78%
2. Specialty Eateries                             9.75%
3. Resorts & Casinos                            6.85%
4. Appliances                                        6.45%
5. Sporting Activities                             6.20%
6. Gaming Activities                              6.05%
7. Major Airlines                                    5.80%
8. Trucking                                            5.10%
9. Networking & Comm Devices            4.85%
10. Aerospace/Defense                        4.85%

– Top 10 Worst Performing Industries For the Week –

1. Copper                                              -15.80%
2. Silver                                                   -5.70%
3. Medical Practitioners                           -5.20%
4. Semiconductors – Memory Chips        -4.30%
5. Drug Stores                                         -4.20%
6. Oil & Gas Drilling & Exploration            -4.20%
7. Oil & Gas Equipment & Services          -3.55%
8. Gold                                                      -3.00%
9. Independent Oil & Gas                          -2.45%
10. Semiconductor – Integrated Circuit     -2.10%

– Top 5 Best Performing ETFs For the Week –
 
1.Powershares Dynamic Biotech (PBE)   4.10%
2. Ishares Broker Dealer (IAI)                   3.90%
3. Ishares Singapore (EWS)                     3.45%
4. Ishares Brazil (EWZ)                             3.30%
5. Latin Discovery Fd (LDF)                       3.25%

– Worst 5 Performing ETF’s –

1. Ishares Gold  (IAU)                              -4.50%
2. StreetTracks Gold (GLD)                     -4.20%
3. Central Fund of Canada (CEF)             -3.80%
4. HLDRS Oil Services (OIH)                    -3.75%
5. Turkish Invest Fd (TKF)                        -3.75%

**  IPO’s Worth Watching for This Week **

The number of IPO’s coming to market will increase dramatically over the next few weeks, so keep an eye on this space!

1. Acme Packet (APKT): Provider of session border controllers that allow service providers to deliver secure, high-quality interactive communication, such as voice, video, VOIP, and other real time multimedia sessions across IP network borders.  The company’s products enhance security and encryption for telecom providers, corporations and law enforcement agencies.  Acme Packet is a raidly growing company that is now profitable.  Trading set to start on Thursday.

2. eHealth (EHTH): California based online provider of health insurance for individuals, families, and small businesses in 50 states.  It’s another rapidly growing company that has turned the corner to profitability.  Trading set to start on Friday.

3. SAIC (SAI): Defense contractor suplying scientifc, engineering, systems integration, and technical services to all branches  of the US government.  SAIC is a large and growing company with 43,000 employees.  Trading set to start on Friday.

** Upcoming Economic Reports (10/9/06- 10/13/06) **

Monday:        None
Tuesday:       Wholesale Trade, Retail Sales, Economic Optimism
Wednesday:  FOMC Minutes, Job Vacancies, Petroleum Status, Mortgage Apps
Thursday:      Money Supply, Treasury Budget, Trade Balance, Jobless Claims, Biege Book
Friday:           Import Price Index, Business Inventories, Consumer Sentiment (prelim), Retail Sales

** Latest Blog Entries – In Case You Missed Them!**

– SelfInvestors Blog –

Dow to Record High, Now What? (Oct. 3rd)
http://investing.typepad.com/tradingstocks/2006/10/dow_to_record_h.html

MidDay Market Report – Market Charges Ahead With Greater Momentum, Resistance Looms; Stock of Day – Iconix Brands (ICON)

::: Today’s Market Action :::

Today, the market doesn’t need a plunge in oil to get it surging higher and that is a good sign.  It’s fueled on the hopes of a possible rate cut and volume is extremely robust as institutions put money to work with more aggression.  This is the kind of action big bull runs are made of.  While I myself have added a significant portion of cash to the long side earlier today, I still remain somewhat cautious up at these levels and will maintain a couple short positions as a hedge.  Next potential resistance areas loom – Nasdaq 2300, S&P 1350 and Dow 12000.  All may be hit in the next day or two so keep an eye on them.  If you’ve been on the sidelines for the past couple days and feel like you’ve been left out, don’t chase this market.  Make it come to you… it will.

(Note: volume averages are based on the average over the past 50 days)
Data as of 2:45PMEST

Nasdaq: up 1.69% today with volume currently tracking 11% ABOVE  average
Nasdaq ETF (QQQQ): up 1.79%, volume 23% ABOVE the average
Dow: up .85%, volume 20% ABOVE average
Dow ETF (DIA): up .88%, volume 44% ABOVE the average
S&P ETF (SPY): up .89%, volume 1% BELOW the average
Russell Small Cap ETF (IWM): up 1.87%, volume 7% BELOW the average

::: SelflInvestors Leading Stocks :::

SelfInvestors Leading Stocks are faring much better today than they have in recent days but still aren’t seeing a ton of momentum just yet.  Volume is just a hair above average for advancers today.

Summary:

* Advancers Leading Decliners 261 to 58.
* Advancers are up 1.91% today, with volume right at the average
* Decliners are down 1.72% with volume 75% ABOVE average
* The total SI Leading Stocks Index is up 1.25% today with volume 14% ABOVE the average

* Where’s the Money Flowing *

Many investing websites just provide leading industries based on price performance alone.. without the volume, this can be misleading.  The only way that I know of to guage industry/sector strength WITH volume levels is through the analysis of ETF’s.  A couple years ago this was not possible, but as more traders/investors use ETF’s they become a much better tool for guaging the health of the market and seeing where the money is flowing (or not flowing).  Using the proprietary SelfInvestors Demand Indicator score which measures price and volume movements, I’m able to quickly see which sectors/industries are seeing the greatest inflows of cash. 

* Leading Sectors/Industries:  Software, HomeBuilders, Retail, Technology and Consumer Services

* Lagging Sectors/Industries – Energy, Energy, Energy.. and Energy AND Gold (still no change here)

* Today’s Market Movers (UP) – Surprisingly Energy is leading the way today.. is this the bottom in Energy?  We may be close.. I’ll have a report on this sometime next week.  Homebuilders and Biotech also seeing some big buying today.

* Today’s Market Movers (DOWN) – Gold stocks getting whacked again today.

** Stocks **

The stocks section will be an area where I highlight one stock selected from a group of stocks moving up with volume well above average.  Today’s stock is Iconix Brands (ICON), which was highlighted in the premium Stock Watch report this morning.  Just one of several Stock Watch stocks moving big today!

ABOUT:  Iconix Brand Group, Inc., formerly known as Candie’s, Inc., is a brand management company focused on licensing and marketing a diversified portfolio of its own consumer brands. The Company owns five brands, Candie’s, Bongo, Badgley Mischka, Joe Boxer and Rampage, which it licenses directly to retailers, wholesalers and suppliers for use across a range of product categories. The Company also continues to arrange, as agent, through its wholly owned subsidiary, Bright Star Footwear, Inc., for the manufacture of footwear products for mass market and discount retailers under their private label brands. In July 2005, the Company acquired the principal assets of Joe Boxer Company, LLC and three of its affiliated companies. In September 2005, Iconix Brand Group, Inc. acquired the principal assets of Rampage Licensing, LLC. In April 2006, the Company acquired the MUDD brand from Mudd (USA) LLC. In August 2006, it acquired the London Fog brand from London Fog Group Inc.

FUNDAMENTAL: Not a company with a great history of earnings and sales growth but is currently one of the fastest growing retailers around.  Sales have doubled and earnings have nearly doubled in just the last 9 months and the company isn’t expected to slow down anytime soon. 

TECHNICAL: Just minutes ago it broke out of a good looking base with volume well above the average.

SELFINVESTORS RATING: With a score of 51/60, one of the highest rated retailers in the database.

MidDay Market Report – Record High in Dow (Beware ‘O The Reversal)

::: Today’s Market Action :::

Today, the much anticipated record high the Dow was achieved at last with a catalyst from the precipitous drop in crude throughout the day.  No question the action is positive and may (if we can hold these gains) show another day of accumulation indicating institutions are continuing to put money to work.  Volume is solid but not outstanding for a record move.  Be on the lookout for an end of day reversal.  Over the past few hours sellers have been in charge so it will be interesting to see who wins this intraday tug of war which will provide a big clue to just how healthy the market is up at these levels.

The only other negative that I see up to this point in the day is the lack of big moves from leading stocks.  Not a whole lot of gusto in the small to mid cap high growth arena (which I’ll take a look at below).

(Note: volume averages are based on the average over the past 50 days)
Data as of 3:15PMEST

Nasdaq: up .48% today with volume currently tracking 1% ABOVE  average
Nasdaq ETF (QQQQ): up .60%, volume 1% ABOVE the average
Dow: up .65%, volume 4% BELOW average
Dow ETF (DIA): up .42%, volume 6% ABOVE the average
S&P ETF (SPY): up .42%, volume 4% ABOVE the average
Russell Small Cap ETF (IWM): up .27%, volume 10% BELOW the average

::: SelflInvestors Leading Stocks :::

It’s another ho hum day for leading stocks .. they are basically flat today.  Overall, leading stocks are actually down for the day with volume a bit below average.

Summary:

* Decliners Leading Advancers 169 to 150.
* Advancers are up 1.30% today, with volume 8% BELOW average
* Decliners are down 1.86% with volume 3% ABOVE average
* The total SI Leading Stocks Index is DOWN .37% today with volume a bit BELOW average at 2% below

* Where’s the Money Flowing *

Many investing websites just provide leading industries based on price performance alone.. without the volume, this can be misleading.  The only way that I know of to guage industry/sector strength WITH volume levels is through the analysis of ETF’s.  A couple years ago this was not possible, but as more traders/investors use ETF’s they become a much better tool for guaging the health of the market and seeing where the money is flowing (or not flowing).  Using the proprietary SelfInvestors Demand Indicator score which measures price and volume movements, I’m able to quickly see which sectors/industries are seeing the greatest inflows of cash. 

* Leading Sectors/Industries:  Software, Technology, Consumer Services, Software and Retail
* Lagging Sectors/Industries – Energy, Energy, Energy.. and Energy AND Gold (still no change here)

* Today’s Market Movers (UP) – Retail is the big winner today, followed by Internet Consumer Services and Health Care
* Today’s Market Movers (DOWN) – As has been the theme over the past several weeks, Oil and Gold getting hammered again today

** Stocks **

Due to time constraints (it’s been one of those days!) I won’t have a stocks of the day for you today.

Weekly Market Review – The Hype Machine Begins

As we inch ever so close to all time highs in the Dow, the CNBC hype machine has been in nauseating overdrive, almost attempting to will this market to a new all time high.  The Dow making a new all time high makes for a nice headline but for our purposes it provides another gauge for the health of this market.  No question that this market has been passing every test thrown its way (Dow and S&P clearing multi year highs; Nasdaq clearing resistance of 200 day moving average) up to this point.  I was skeptical about the validity of this rally throughout August, but the buy volume that accompanied the move up after normal trading volume resumed after the Labor Day weekend is enough to convince me that this rally is for real and should be played accordingly.  (Note: I don’t and won’t make predictions on just how much the market will rally – I’ll stick to predictions of tonight’s Seahawks/Bears game:: Seahawks 20, Bears 13).

I know, "played accordingly" is rather vague.  My strategy for the next few weeks remains the same.  I’ll continue to foregoe heftier profits in exchange for profit protection up at these lofty levels.  .  The continued rise without a significant pull back has just not allowed me the perfect entry to get aggressively long.  Even if this market continues to defy gravity and push higher above the Dow all time high, I’ll continue my conservative approach by maintaining a signficant cash position.  Only until we get a decent pull back of 2 – 3% will I get aggressive and begin using margin.  I’m just playing the probabilities.. and the probability of a pull back continues to outweigh the probabiliy of another leg higher.

::: Model Portfolio Update :::

In the last Weekly report 2 weeks ago I mentioned that it was one of the busiest weeks I’ve ever had in terms of transactions in the Model Portfolio.  I scrambled to cover shorts and get long in a matter of days.  Since  that time, I have chose to ride this market with what I have and not get overly aggressive on the long side.  I’ve mentioned on several ocassions over the past few weeks that the market needs to consolidate these gains and the more we trend up with no consolidation, the likelihood of a more severe pull back increases.  With that said, I closed three long positions in Perficient (PRFT), Akamai Technologies (AKAM) and Cenveo (CVO).  PRFT was purchased at the breakout and an add on position was added later to capitalize on continued strenght in the stock.  The entire $20K position was sold due to increase in insider selling and a higher volume intraday reversal on Sept 26th for small gains of 2 and 5%.  AKAM was sold on Friday to lock in an 18% gain because the stock is nearing the top line of its upward channel.  CVO, a quick strike profit play several weeks ago (quick strike profit plays are stocks that are technically superior and typically held for short periods – more of a swing type trade), was sold for a small loss of 6% after it began to further deteriorate below the 50 day moving average with heavier sell volume.

For the coming week I’ll continue my conservative strategy and sit on a sizable portion of cash.  Only until we get a sizable, orderly correction will I begin to get 100% long and consider using margin (I have not used any margin since very early in the year).  In the past 2 weeks, the Model Portfolio has gained 2.6% and is sitting on gains of 17.6% year to date, more than double the return of the S&P500.

::: PinPoint the Highest Ranked Breakout Stocks in Just Minutes Each Day! :::

Want to take your membership to the next level?  Premium members who have been following along with buy and sell alerts in the Model Portfolio are smashing average returns with a 15% YTD performance.  In addition to alerting you to the best opportunities on the long side, short opportunities are used to make money during a downturn.  That’s just one of many premium features….

There are literally dozens of breakout stocks to watch every day.  How about a database of stocks all ranked according to fundamentals and technicals, complete with pivot points, earnings date, % change from breakout and moving averages, future earnings estimates and relative strength rating?  How about Stock Watch reports highlighting long and short opportunities for the coming week?  It will save you hours of research every week and drastically improve your results.

Try it out for yourself for 30 days!  Sign in to your account here: http://www.selfinvestors.com/amember/member.php and take advantage of the no risk trial.

::: Best/Worst Performers :::

– Top 10 Performing Industries For the Week –

1. Silver                                                7.02%
2. Railroads                                          4.90%
3. Farm & Construction Machinery       4.85%
4. Heavy Construction                          4.75%
5. Personal Computers                          4.70%
6. Foreign Utilities                                  4.55%
7. Gold                                                   4.25%
8. Oil & Gas Equipment & Services        4.20%
9. Lumber/Wood Production                   4.05%
10. Cement                                             4.00%

– Top 10 Worst Performing Industries For the Week –

1. Medical Practitioners                         -4.85%
2. Farm Products                                   -4.30%
3. Semis – Memory Chips                       -4.20%
4. Information & Delivery Service          -3.30%
5. Cigarettes                                          -3.00%
6. Sporting Goods                                  -2.65%
7. Home Health Care                              -2.10%
8. Medical Instruments & Supplies         -2.00%
9. Lodging                                              -1.90%
10. Internet Service Providers               -1.85%

– Top 5 Best Performing ETFs For the Week –
 
1. Ishares Brazil (EWZ)                             6.00%
2. Central Fund of Canada (CEF)              5.20%
3. Templeton Russia & E. Europe (TRF)    4.90%
4. Market Vectors Gold Miners (GDX)      4.60%
5. Asa Gold (ASA)                                    4.45%

– Worst 5 Performing ETF’s –

1. Ishares Telecom (IYZ)                           -1.15%
2. Ishares Hong Kong (EWH)                     -1.10%
3. Turkish Invest Fd (TKF)                            -.80%
4. HLDRS Broadband (BDH)                         -.70%
5. Japan Small Cap (JOF)                              -.50%

**  IPO’s Worth Watching for This Week **

The number of IPO’s coming to market will increase dramatically over the next few weeks, so keep an eye on this space!

1. Breitburn Energy Partners (BBEP): independent oil and gas partnership focusing on the acquisition, exploitation and development of oil and gas properties.  The company has assets of producing and nonproducing crude oil reserves in the Los Angeles Basin of California and the Wind River and Big Horn Basins in Central Wyoming.  Set to start trading Wednesday.

2. Danaos (DAC): Greece based shipping company operating about 27 container ships through a number of subsidiaries incorporated in Liberia, Cyprus or Singapore.  The company charters its vessels to many of the world’s largest liner companies.  Trading set to start Friday.

3. Light Sciences Oncology (LSON): An early stage company developing a product called Light Infusion Therapy, used for the light activated treatment of solid tumors.  The company is not close to profitability.  Trading set to start Thursday.

4. Rosetta Genomics (ROSG): Israel based development stage company seeking to develop and commercialize new diagnostic and therapeutic products based on a recently discovered group of genes dknown as microRNAs.  It’s another biotech company with no profits currently.  Trading set to start sometime this week.

** Upcoming Economic Reports (10/2/06- 10/6/06) **

Monday:        ISM Manufacturing, Construction Spending
Tuesday:       New Motor Vehicle Sales, Retail Sales, Job Cut Announcements
Wednesday:  ISM Non Manufacturing, Factory Orders, Petroleum Status, Mortgage Apps
Thursday:      Money Supply, Monster Employment Index, Jobless Claims, Public Debt
Friday:           Consumer Credit, Employment Situation

** Latest Blog Entries – In Case You Missed Them!**

– SelfInvestors Blog –

Where’s the Big Money Flowing? A Look At My System for Tracking Sector/Industry Rotation and Strength (Sept. 25th)
http://investing.typepad.com/tradingstocks/2006/09/wheres_the_big_.html

** Look for a new Breakout Stock Highlights article to be posted in the next day or two- while the number of breakouts have slowed, there were several high quality breakouts in the last couple weeks I’ll be highlighting.  Don’t miss it!
MidDay Market Report – S&P500 Looking to Close at Multi Year High; Stock of Day – Charlotte Russe Holdings (CHIC)

::: Today’s Market Action :::

Unless the market stages a big reversal in the final hour of trading today, the S&P500 will close at a new multi year high with trading volume potentially high enough to qualify for another day of accumulation (indication of institutional buying).  It’s just too close to tell at this point.  Regardless, today is no doubt a significantly positive day up until this point.

(Note: volume averages are based on the average over the past 50 days)
Data as of 2:45PMEST

Nasdaq: up .46% today with volume currently tracking 6% ABOVE  average
Nasdaq ETF (QQQQ): up .39%, volume 1% BELOW the average
Dow: up .71%, volume 10% ABOVE average
Dow ETF (DIA): up .67%, volume 32% BELOW the average
S&P ETF (SPY): up .56%, volume 8% BELOW the average
Russell Small Cap ETF (IWM): up .35%, volume 27% ABOVE the average

::: SelflInvestors Leading Stocks :::

It’s another ho hum day for leading stocks – they are doing OK today but not outstanding.  There is little volume behind today’s move up.

Summary:

* Advancers Leading Decliners 228 to 125.
* Advancers are up 1.66% today, with below average volume… 6% ABOVE average
* Decliners are down 1.27% with volume 4% ABOVE average
* The total SI Leading Stocks Index is up .62% today with volume a bit BELOW average at 3% below

* Where’s the Money Flowing *

Many investing websites just provide leading industries based on price performance alone.. without the volume, this can be misleading.  The only way that I know of to guage industry/sector strength WITH volume levels is through the analysis of ETF’s.  A couple years ago this was not possible, but as more traders/investors use ETF’s they become a much better tool for guaging the health of the market and seeing where the money is flowing (or not flowing).  Using the proprietary SelfInvestors Demand Indicator score which measures price and volume movements, I’m able to quickly see which sectors/industries are seeing the greatest inflows of cash. 

* Leading Sectors/Industries:  Homebuilders appear on the list for the first time today (actually they showed up yesterday after I sent out the MidDay report),  Software, Technology, Consumer Services

* Lagging Sectors/Industries – Energy, Energy, Energy.. and Energy AND Gold (still no change here)

* Today’s Market Movers (UP) – Homebuilders are getting more big buying today; energy and industrials are seeing some bargain hunting buying
* Today’s Market Movers (DOWN) – Telecom and Networking stocks are seeing some profit taking with volume today

** Stocks **

The stocks section will be an area where I highlight one stock selected from a group of stocks moving up with volume well above average.  Today’s stock is Charlotte Russe Holdings (CHIC).

ABOUT:  Charlotte Russe Holdings, Inc. is a mall-based specialty retailer of apparel and accessories targeting young women in their teens and twenties

FUNDAMENTAL: Not a company with a history of great growth, but has posted tremendous growth in the past year and is on pace for a record year, smashing previous EPS yearly totals.

TECHNICAL: Has formed a series of sloppy bases but keeps chugging along.  The stock is bouncing off its 50 day moving average today with good volume behind it.

MidDay Market Update – Market Proves Its Strength

::: Today’s Market Action :::

Today’s action is telling in that the market is showing possible accumulation (institutional buying – we won’t know until final volume numbers come in) just days after a day of distribution (institutional selling)  The resiliency I’ve discussed in the past couple days and today’s bounce back with significant end of day buying proves the strength of this current market.

(Note: volume averages are based on the average over the past 50 days)
Data as of 2:15PMEST

Nasdaq: up 1.3% today with volume currently tracking 8% BELOW  average
Nasdaq ETF (QQQQ): up 1.43%, volume 8% ABOVE the average
Dow: up .89%, volume 2% BELOW average
Dow ETF (DIA): up .77%, volume 5% ABOVE the average
S&P ETF (SPY): up .87%, volume 12% ABOVE the average
Russell Small Cap ETF (IWM): up 1.22%, volume 11% ABOVE the average

::: SelflInvestors Leading Stocks :::

If there is one negative in today’s action, it’s that leading stocks that make up the SelfInvestors Breakout Tracker database are not showing good strength.  The Index is basically flatlining today and selling volume is significantly greater than up volume.

Summary:

* Advancers Leading Decliners 238 to 115.
* Advancers are up 1.39% today, with below average volume… 10% ABOVE average
* Decliners are down 1.83% with volume 18% ABOVE average
* The total SI Leading Stocks Index is up .34% today with volume a bit BELOW average at 1% below

* Where’s the Money Flowing *

Many investing websites just provide leading industries based on price performance alone.. without the volume, this can be misleading.  The only way that I know of to guage industry/sector strength WITH volume levels is through the analysis of ETF’s.  A couple years ago this was not possible, but as more traders/investors use ETF’s they become a much better tool for guaging the health of the market and seeing where the money is flowing (or not flowing).  Using the proprietary SelfInvestors Demand Indicator score which measures price and volume movements, I’m able to quickly see which sectors/industries are seeing the greatest inflows of cash. 

No Changes Today in Leading and Lagging Industries

* Leading Sectors/Industries – Software, Technology, Retail, Consumer Services

* Lagging Sectors/Industries – Energy, Energy, Energy.. and Energy AND Gold (still no change here)

* Today, Industries/Sectors that have been leading the market over the past month are leading the way today – Homebuilders, Semis, Retail, Software and Telecom are all seeing significant buying today
* The bargain buying in oil that we saw late last week didn’t last long – oil stocks are taking another hit today, particularly in the services sector

** Stocks **

This area still under development.