I’ve been playing this market aggressively of late trying to capture both opportunities on the short side in the weakest of industries as well as looking for profits on oversold bounce plays on the long side. I have been focused and prepared for this volatile market, but it wasn’t until I began a "half work, half relax" vacation towards the end of the week that I realized just how time intensive and grueling it is to squeeze out profits in an extremely volatile market like this. On Friday, I was lulled into feeling comfortable about holding several swing long positions. It was a long week, friends were arriving for a weekend lake vacation, it was close to noon and all I could think about were a few Coronas and the weekend ahead. Taking my eye off the ball for just 30 minutes cost me all of the days profits and then some. It wasn’t a complete disaster, but the Citigroup CFO comments were enough to bitter the beer a bit. Let’s give this guy the worst timing of the year award. As I’ve been mentioning, for most investors/traders it,s best to stay out of a market like this. With the volatility getting squeezed into shorter time frames, it’s been difficult for even the most savvy of daytraders to squeeze out profits.
The main theme of this market right now is uncertainty. Uncertainty over just how widespread and severe the credit issues are. With conflicting opinions over just how large the problem is and will be, it’s not at all surprising. We have witnessed the Fed time and time again indicating the subprime issues are for the most part contained at this point. Contrast that with comments from those on the front lines – the Countrywide CEO and the Citigroup CFO. If you believe what they have to say, then the worst is yet to come. I tend to believe those on the front line. After all, there are indications that the credit problem will spread globally with news of subprime problems from Australian bank Macquarie and German lender Deutsche Industriebank confirming this. Nevermind that Bear Sterns announced issues with another hedge fund. As I’ve said before, I think the Fed is avoiding being the bearer of bad news for fear of being responsible in roiling the market. It will be mighty interesting to see what they have to say on Tuesday.
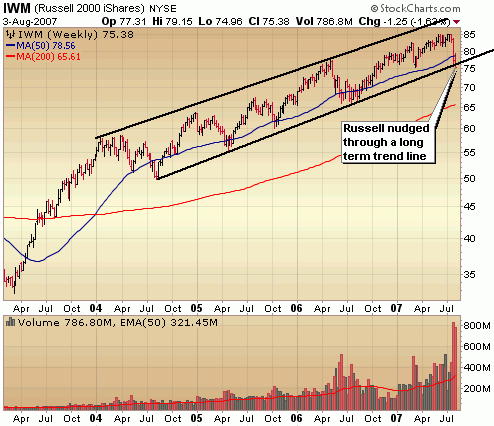
From a technical perspective, the indices are obviously broken in the short term but we are still overdue for some kind of significant oversold bounce. Given the magnitude of the selling on Friday and the fact the indices closed at the lows of the day, we could be in for some trouble on Monday morning but how we close on Monday will be critical. Over the longer term, this recent sell off is relatively minor with support areas still in place in the Dow, S&P and Nasdaq. What I’m concerned about is the small caps which have been getting hammered. The Russell 2000 nudged through a long term trend line on Friday. Let’s go to the charts:
As mentioned above, the Russell has nudged through a long term (3 year) upward trend line. Dropping to the next major level of support would require nearly a 15% move.
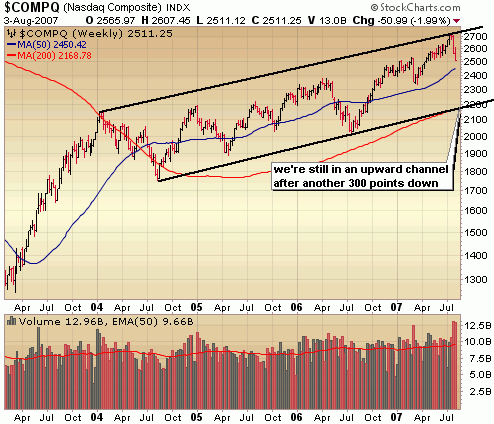
When you look at the Nasdaq weekly long term chart, you realize just how far we could drop and still be within a long term upward channel. It’s currently right at support of the April breakout point and fast approaching that 200 day moving average. However, what stands out to me is that record volume selling over the past couple weeks. It can’t be ignored.
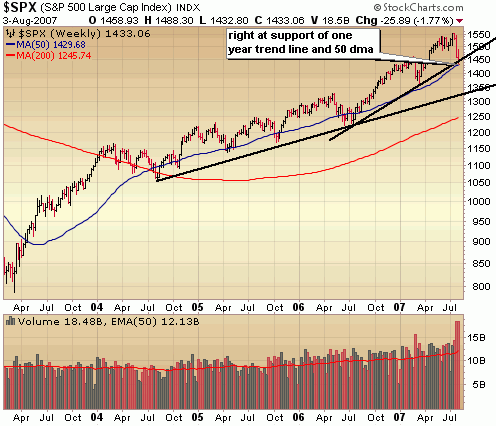
The S&P is right at critical support of where a steeper one year upward trend line and the 50 day moving average converge. Considering the amount of sell volume you have to believe that eventually it will take out this support level and test support of the longer term trend line around 1350.
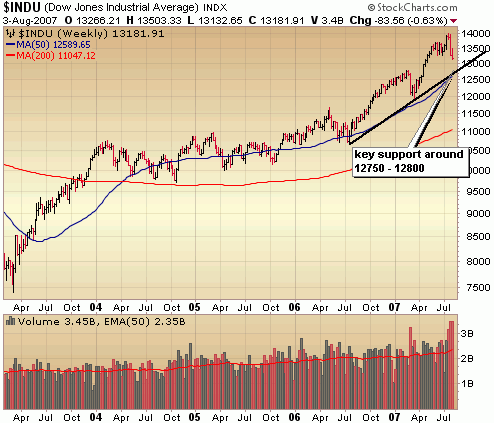
Whether we go on to form a head and shoulders top by getting some kind of sizable bounce here or just continue with the recent plunge, the area around 12750 will remain a critical support area. It’s where the point of the previous breakout, an upward trend line and the 50 day moving average all converge. The likelihood of at least another 400 points drop in the Dow is great.
::: Model Portfolio Update :::
With the exception of adding another short play and adding a few trades for quick profits on the long side, I didn’t do much with the Model Portfolio last week. That’s partly due to trying to get a few days of vacation as well as playing conservatively while I let this wild market play out a bit and stabilize. The strategy of maintaining a portfolio with a significant cash allocation along with a few shorts and long bounce plays has paid off. The portfolio edged up a bit by .1% in a week that saw the indices slide even lower. The Model Portfolio year to date performance of 6.3% is now well ahead of the S&P gain of just 1%. During the week, I initiated another short trade to replace a short trade that was closed in XL Capital (XL) for a quick 8% gain. On the long side, just one new position was initiated while two Quick Strike Profit plays were closed for a net wash – one in Omniture (OMTR) for a 10% gain and one in Labor Ready (LRW) for a 10% loss. Total allocation of the portfolio currently stands at 50% cash, 20% short and 30% long.
::: Best/Worst Performers :::
– Top 10 Performing Industries For the Week –
1. Technical Services: 4.45%
2. Nonmetallic Mineral & Mining: 4.30%
3. Scientific & Technical Instruments: 4.10%
4. Healthcare Information Service: 3.75%
5. Resorts & Casinos: 3.25%
6. Regional Airlines: 2.95%
7. Agricultural Chemicals: 2.70%
8. Farm Products: 2.70%
9. Small Tools & Accessories: 2.60%
10. Drug Stores: 2.50%
– Top 10 Worst Performing Industries For the Week –
1. Surety & Title Insurance: -17.90%
2. Medical Practitioners: -14.25%
3. Hospitals: -12.65%
4. Mortgage Investment: -11.90%
5. Toy & Hobby Stores: -9.90%
6. Investment Brokerage National: -7.65%
7. Marketing Services: -7.25%
8. Savings & Loans: -6.30%
9. Processing Systems & Products: -6.25%
10. Personal Computers: -6.15%
– Top 5 Best Performing ETFs For the Week –
1. Morgan Stanley China (CAF) 7.75%
2. Central Europe / Russia Fund (CEE) 4.35%
3. Powershares Nanotech (PXN) 3.45%
4. Mexico Fund (MXF) 3.30%
5. Latin American Discovery Fund (LDF) 3.20%
– Worst 5 Performing ETF’s –
1. HLDRS Internet Infrastructure (IIH) -6.10%
2. Morgan Stanley Asia Pac (APF) -5.45%
3. HLDRS Oil Services (OIH) -5.35%
4. Ishares Oil Equipment (IEZ) -4.15%
5. Indonesia Fund (IF) -4.00%
::: IPO’s Worth Watching for This Week :::
1. E-House China Holdings (EJ): Established in 2000, E-House specializes in helping customers (both international and domestic real estate developers) buy and sell residential properties through its subsidiaries. The largest real estate agency in China, the company provides a variety of real estate brokerage, consulting, and related services through a network of more than 1,800 sales professionals in about 30 cities across the country. E-House focuses on serving clients in the metropolitan areas of Shanghai, Wuhan, and Hangzhou in China. The company also offers brokerage services in Hong Kong and Macau.Trading set to begin on Wednesday.
2. Masimo Corp (MASI): The company’s Signal Extraction Technology (SET) noninvasively monitors arterial blood-oxygen saturation levels and pulse rates in patients. Masimo’s product range offers pulse oximeters in both hand-held and stand-alone (bedside) form. Recent developments include carbon monoxide (CO) monitoring features, as well. The company licenses SET-based products to more than 35 medical equipment companies, including Cardinal Health, Medtronic, Welch Allyn, and Zoll Medical. Product benefits include provision of real-time information and elimination of signal interference, such as patient movements. Trading set to begin on Wednesday.
3. Paragon Shipping (PRGN): The company owns three Handymax and three Panamax carriers that are available as time charters for one to two years. Its ships, which have a total capacity of 350,000 dwt (deadweight tons), carry bauxite, iron ore, coal, grain, fertilizers, and phosphate worldwide. Trading set to begin on Friday.
4. HireRight (HIRE): HireRight provides Web-based pre-employment screening services for human resources and security professionals. The company helps businesses perform background verification, drug screening, and skills and behavioral assessment for prospective new hires. Serving about 1,400 customers, HireRight’s main product offering includes its Extended Workforce Screening Solution suite of software applications.Trading set to begin on Wednesday.
5. WuXi PharmaTech (WX): The company provides laboratory and manufacturing services for customers in the pharmaceutical and biotechnology industries. Its core lab services business offers research and development, discovery chemistry, service biology, and pharmaceutical development services. WuXi’s ancillary manufacturing operations mainly produce advanced intermediate drugs and active drug ingredients; the company ships about 10 tons of pharmaceuticals and ingredients annually. Top customers include such leading global drug makers as Pfizer and Merck which each account for about 14% of sales. Trading set to begin on Thursday.
6. Tully’s Coffee (TULY): The firm operates and franchises a chain of nearly 130 coffeehouses offering a variety of specialty blend coffees along with baked goods, espresso, and related supplies, mostly in Washington, California, and a handful of other western states. About 90 locations are company-owned; the rest are franchised. Tully’s also sells branded coffee and related products to supermarkets and food service operators through its wholesale division, which distributes to some 4,000 grocery stores, including Kroger and Albertsons. Trading set to begin on Friday.
7. Quicksilver Gas Services (KGS): The firm operates and franchises a chain of nearly 130 coffeehouses offering a variety of specialty blend coffees along with baked goods, espresso, and related supplies, mostly in Washington, California, and a handful of other western states. About 90 locations are company-owned; the rest are franchised. Tully’s also sells branded coffee and related products to supermarkets and food service operators through its wholesale division, which distributes to some 4,000 grocery stores, including Kroger and Albertsons. Trading set to begin on Tuesday.
8. MercadoLibre (MELI): Its online trading service enables individuals and businesses to electronically arrange the sale and purchase of items in more than 2,000 categories. In addition to its auction and classified listing services, Mercadolibre offers an online payment service to further facilitate electronic transactions. The company serves more than 18 million registered users in 13 countries in Latin America; more than half of sales come from Argentina. Sales come from listing fees, fees based on the value of goods sold, and ancillary services. Online auction giant eBay owns nearly 20% of Mercadolibre. Trading set to begin on Friday.
::: Upcoming Economic Reports (8/6/07 – 8/10/07) :::
Monday: None
Tuesday: FOMC Rate Decision, Consumer Credit
Wednesday: Wholesale Inventories, Crude Inventories
Thursday: Initial Claims, Factory Orders
Friday: Export / Import Prices, Treasury Budget
::: Upcoming Notable Earnings Reports :::
Monday:
j2 Global Communications (JCOM), Mindray Medical (MR), Quality Systems (QSII), Metalico (MEA), Herbal Life (HLF), Banco Bradesco (BBD), Ctrip.com (CTRP), TransDigm Group (TDG)
Tuesday:
Perini (PCR), Integra LifeSciences (IART), Huron Cosulting (HURN), Credicorp (BAP), Banco Itau (ITU), Iconix Brands (ICON), Cisco (CSCO), Arena Resources (ARD), Harris Corp (HRS), Boston Beer (SAM)
Wednesday:
Allis-Chalmers (ALY), Hansen Natural (HANS), InnerWorkings (INWK), Holly (HOC), Divx (DIVX), Uniao de Bancos (UBB), Perficient (PRFT)
Thursday:
Nvidia (NVDA), Suntech Power (STP), Global Sources (GSOL)
::: In Case You Missed It – SelfInvestors Blog Entries of the Past Week :::
1. ETF Watch – Healthcare, Pharma & Retail Breaking Down
2. DXP Enterprises (DXPE) & Silicon Motion Tech (SIMO) Plunge After Earnings Misses
3. Trade of the Day – Transcend Services (TRCR) Meets Resistance, Offers Short Entry
4. Navteq (NVT), Trimble (TRMB) & Garmin (GRMN) Mapping Out New Highs Following Earnings
5. Short Term Capitulation, But Leaders Lag
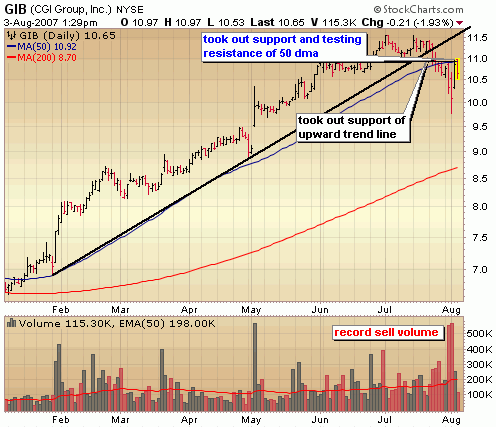
6. Trade of the Day – Broken Support Lines Create Short Opportunity in CGI Group (GIB)
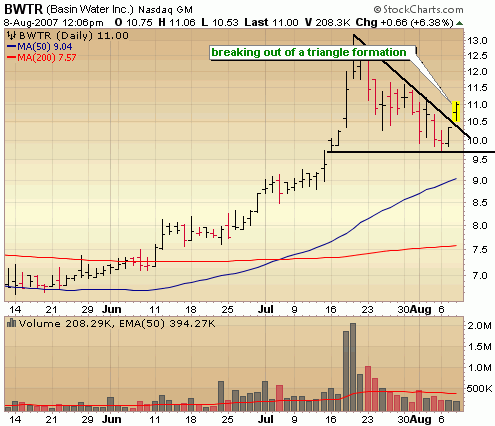
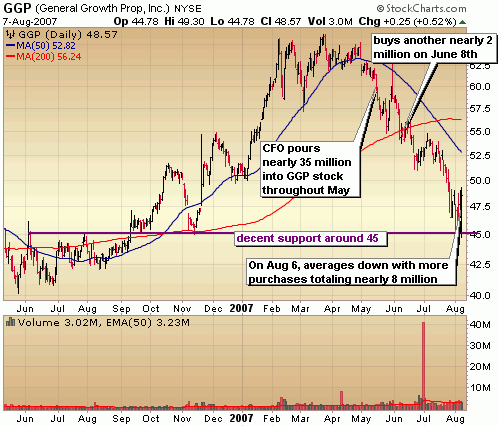
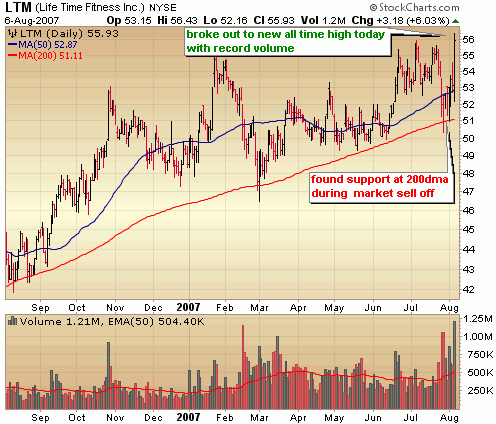

 Those are squirrels boxing but you get the idea.. today’s bout between bulls and bears went nearly 12 rounds, with the bulls delivering the knock out punch just before the final bell. There will no doubt be calls for a rematch. In what was one of the wildest days of trading action I can remember, the market at one point was on the absolute verge of collapsing below critical support levels before buyers rushed in to save the day in the last 40 minutes of trading in what was a ferocious level of buying. The fact that the Dow surged more than 250 points in the last 40 minutes of trading puts it in perspective. I think today’s action probably marks a bottom in the short term. What I mean by that is that it was probably the bottom marking the beginning of a what could be a significant bounce to new resistance areas. That being said, I’m going to remain cautious because the overall picture is one of deteriorating technicals with any short term rally providing opportunities to short and exit positions (as well as day/swing trading for you short term traders). I mention this below as well, but it should be noted here that leading stocks didn’t participate in any way today with the Self Investors Leading Stocks Index closing down a bit for the day. While today’s action was bullish, it was not the kind of move you see in healthy markets. This market is obviously still searching for some identity and some support. In these volatile times, it’s probably best for most people to sit it out on the sidelines.