Another wild day on Wall St. with the Dow erasing all of Friday’s losses with volume heavier than Friday. After the opening pop was sold off, it looked like the indices might swim in a sea of red all day. However, the severely oversold financial sector found excuses to rally on a Merril Lynch upgrade, news of a Wells Fargo buy back and an S&P analyst saying the market overreacted to the Bear Sterns outlook. The theme for the day was bargain hunting in the worst hit industries – mortgage, brokers, banks & utilities. Considering that leading stocks did not fare all that well and that this was not a broad based rally there is reason to remain skeptical, but the move was strong enough to potentially push the market up to new resistance levels over the next several days (S&P 1500, Dow 137000 and Nasdaq 2620). With the Fed rate decision tomorrow, volatility won’t subside anytime soon. There have been quite a few attacks on the credibility of the Fed of late for maintaining that the subprime issues are for the most part contained, so it should be interesting to see if their language changes this time around. No rate change is expected.
::: Major Indices Performance – The Numbers :::
(Note: volume averages are based on the average over the past 50 days)
Data as of 4:00EST – End of Day August 6th 2007
Nasdaq: UP 1.44% today with volume 22% ABOVE average
Nasdaq ETF (QQQQ) UP 1.16%, volume 39% ABOVE average
Dow: UP 2.18%, with volume 21% ABOVE the average
Dow ETF (DIA): UP 1.52%, volume 15% ABOVE the average
S&P ETF (SPY): UP 1.68%, volume 76% ABOVE the average
Russell Small Cap ETF (IWM): UP .86%, volume 116% ABOVE the average
::: SelflInvestors Leading Stocks :::
The Self Investors Leading Stocks Index is comprised of stocks in the Breakout Tracker, which is a database of the fastest growing companies near a breakout or having already broken out of a base. In what has become a bit of a trend in the past few weeks, leading stocks continue to lag the broader market, just as they did today.
Summary:
* Advancers led Decliners 220 to 127
* Advancers were up an average of 2.45% today, with volume 42% ABOVE average
* Decliners were down an average of 2.42% with volume 57% ABOVE average
* The total SI Leading Stocks Index was UP .67% today with volume 48% ABOVE average
::: Where’s the Money Flowing :::
Many investing websites provide leading industries based on price performance alone. However, without accompanying volume levels, this can sometimes be misleading. The only way that I know of to gauge industry/sector strength WITH volume levels is through the analysis of ETF’s. A couple years ago this was not possible, but as more traders/investors use ETF’s they become a much better tool for gauging the health of the market and seeing where the money is flowing (or not flowing). Using the proprietary SelfInvestors Demand Indicator score which measures price and volume movements, I’m able to quickly see which sectors/industries are seeing the greatest inflows of cash. For a detailed look at how I go about gauging sector/industry strength please see the following post: http://selfinvestors.com/si/industry_tracking/
* Current Leading Sectors/Industries (over last 30 trading days):
Consumer Staples (market clearly getting defensive)
* Current Lagging Sectors/Industries (over last 30 trading days):
Broker/Dealers, Utilities, Financials, Home Construction
* Today’s Market Moving Industries/Sectors (UP):
Regional Banks, Financial, Utilities, Broker/Dealers
* Today’s Market Moving Industries/Sectors (DOWN):
Oil, Commodities, Gold, Gold Miners, Oil & Gas Services
::: Stocks :::
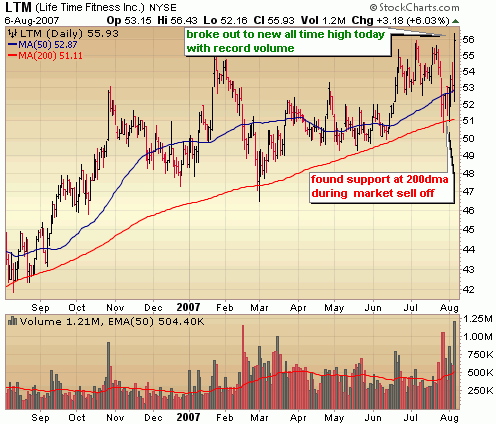
The stocks section will be an area where I highlight one stock selected from a group of stocks moving up with volume well above average and most likely breaking out of a base or consolidation. Today’s stock is a stock I first highlighted back in late January and it moved with such gusto today I decided to feature it again here. I won’t go through all the fundamental and technical details again – you can read that in the first post here.
You can see in the chart below the nice trend along the 200 day moving average and the big breakout today with record volume. An outstanding company with an even better looking chart.

Disclosure: I currently do not own a position in Life Time Fitness (LTM).