All posts by Tate Dwinnell

Visa IPO Coming

Update: The Visa IPO begins trading under the ticker symbol V tomorrow and is expected to price between 37 – 42 tonight.

Don’t forget to sign up for the all new IPO Community above and discuss how to trade it in the forum!

visa ipoThe Visa IPO took another step towards success today after the SEC gave its restructuring plan the go ahead.  Now the company will seek approval from member financial institutions which would pave the way for an IPO early next year.  The restructuring  involves Visa International, Visa USA and Visa Canada becoming subsidiaries of a single company.  Visa Europe will remain a membership association and will become a licensee of, and own a minority interest in, Visa Inc.  

If the success of the Mastercard (MA) IPO is any indication, the IPO of Visa which is the world’s largest credit card company (they have 60% share of the market) will be tremendously successful as well.  Going public will allow the company to streamline operations, invest in new payment technologies and help insulate member banks from legal damages brought about by antitrust litigation from merchants.

The biggest beneficiaries when Visa goes public will be the dozens of banks that make up its membership, including major U.S. financial institutions like Bank of America (BAC) Wells Fargo (WFC) and JPMorgan (JPM).  They stand to reap hundreds of millions of dollars in capital gains if they sell part of their stakes.  After MasterCard (MA) completed its initial public offering, Citigroup (C) and JPMorgan (JPM) cashed out of their holdings and walked way with one-time gains worth more than $100 million.

This will no doubt be one of the biggest IPO’s in history so it will be interesting to watch it move when it does go public.

 :::::::::::::::::::::::::::::::::::::::::::::::::::::::::::

Looking for more IPO Information?  Check out the all new IPO Stocks Portal page!  Latest Opinions & News, Highest Rated IPO’s, IPO’s Moving With Volume Today, Discussion and Recommended Reading.

::::::::::::::::::::::::::::::::::::::::::::::::::::::::::::

LATEST VISA IPO NEWS


Secrets of Success in 3 Minutes

I’ve been meaning to share this site with my readers for awhile now and finally getting to it.  It’s a great site from TED (Technology, Entertainment, Design) which is an annual conference where industry experts across a variety of industries are challenged to give the talk of their lives in 18 minutes or less.  The website provides more  than 100 of these presentations for free and more are being added.  I thought I’d share a short one here from Richard St. John , who interviewed 500 highly successful people over the course of a decade and found common characteristics among them.  Some of us have heard a few of these traits of success before but it always helps to be reminded of them!

UPDATE: I can’t get this video to work, so you can view it at the site.

Trade of the Day – Weak Volume Bounce Offers Short in Ashland (ASH)

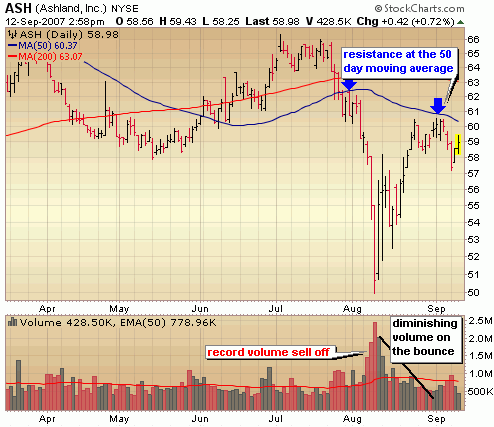
Following a short reprieve from highlighting short trades, where I highlighted a great looking long trade in HMSY, I return today to anothe great short opportunity.. this time in Ashland (ASH).  The stock has carved out a classic short trade setup where the stock takes out key support levels with huge selling volume, followed by a weak bounce up to test new resistance.  The short entry occurs when sell volume begins picking up again to the downside, just as it did on Monday.  The stock has pushed higher over the past two days but I think that just offers an even better entry for this outstanding looking short trade.

IPO Watchlist – SelfInvestors Top 20

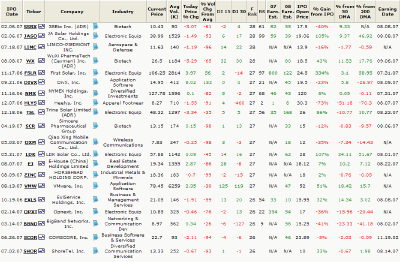
Below you’ll find a screenshot of a new tracking feature implemented at SelfInvestors.com in the past couple months.  It’s the IPO Tracker and it’s a dynamic, sortable watchlist of only the best IPO’s that have come to market over the past year.  You can sort by any of the columns in the live system, but the default sort is by Fundamental Rank (or F Rank), so that companies with the best fundamentals always rise to the top (in fact, this is how all of the tracking systems are set up – ie. Breakout Tracker & ETF Tracker). 

At the top you see SSRX and JASO with fundamental ranks of 28/30 which is an outstanding score.  Keep in mind that IPO’s aren’t in any particular order for a fundamental rank.  In other words all of the stocks ranked 28 are in a random order, so SSRX isn’t necessarily considered THE BEST IPO that I  track.  It’s just one of a few of the BEST IPO’s that I track – JA Solar Holdings (JASO), Limco-Piedmont (LIMC) or Wuxi Pharmatech (WX) could just as easily been listed at the very top.  One other things to note is that there may not be data for RS rank or % from 50 and 200 day moving averages because the stock doesn’t have enough of a history yet.

Looking at the table below I can quickly see that from the list of the top 20 IPO’s in this current market, both First Solar (FSLR) and DivX (DIVX) are moving with good volume today.  The % Vol Change From Avg column displays the conviction behind a move in a stock in that the greater the volume behind a move up, the greater the conviction of the move.  This data column measures the difference in current trading volume from the average trading volume at this point in the trading day. 

The DI15 and DI30 columns are proprietary indicators of SelfInvestors.com and they measure the amount of demand behind a stock using price and volume data over 15 and 30 days.  Of course, the higher the score, the  greater the momentum the stock is showing.  In the table below you see that VMWare (VMW) has shown the greatest momentum of them all, followed by WuXi Pharmatech (WX) and Limco-Piedmont (LIMC).  Heely’s (HLYS) and Big Band Networks (BBND) have been showing the least demand as indicated by highly negative DI30 scores.

Get a full view of the IPO Tracker by clicking the image below. 

Awaiting Retail / Fed, Market Rises On Anemic Volume; Stock of Day – Baidu.com (BIDU)

The big run today seemed to come out of left field considering on Friday we had some distribution and a breach of some key support levels.  In the absence of any major credit/housing/subprime concerns, the market chose to focus on a few positives today in the narrowing of the deficit and some good sales numbers out of McDonalds.  On the surface it looked to be a big bullish day, but considering volume was anemic once again, we can’t take too much from today’s action.  The major indices have basically just pushed back up to near their resistance levels.  We can probably expect more light volume trading in the coming days as the market holds its breath for Friday’s retail numbers, all that overseas commercial paper coming up for renewal and then the big Fed rate decision next Tuesday.  It’s absolutely anyone’s guess as to which way this market will swing over the next week or so.  Combine the high emotions and the Fed uncertainty and it really remains a difficult environment to make money on EITHER side.  I still recommend that most people stay the heck out of this market until several days after the Fed decision, possibly longer.

::: Major Indices Performance – The Numbers :::

(Note: volume averages are based on the average over the past 50 days)
Data as of 4:00EST – End of Day September 11th 2007

Nasdaq: UP 1.5% today with volume 10% BELOW  average
Nasdaq ETF (QQQQ) UP 1.51%, volume 30% BELOW average
Dow: UP 1.38%, with volume 15% BELOW the average
Dow ETF (DIA): UP 1.26%, volume 41% BELOW the average
S&P ETF (SPY): UP 1.17%, volume 28% BELOW the average
Russell Small Cap ETF (IWM): UP 1.59%, volume 29% BELOW the average

::: SelflInvestors Leading Stocks :::

The Self Investors Leading Stocks Index is comprised of stocks in the Breakout Tracker, which is a database of the fastest growing companies near a breakout or having already broken out of a base.  Leading stocks did about as well as could be expected today – about in line with what the Russell 2000 did.  Again, no volume behind the rise in leading stocks today.

Summary:

* Advancers led Decliners 253 to 45
* Advancers were up an average of 2.19% today, with volume 21% BELOW average
* Decliners were down an average of 1.59% with volume 8% ABOVE average
* The total SI Leading Stocks Index was UP 1.61% today with volume 17% BELOW average

::: Where’s the Money Flowing :::

Many investing websites provide leading industries based on price performance alone. However, without accompanying volume levels, this can sometimes be misleading.  The only way that I know of to gauge industry/sector strength WITH volume levels is through the analysis of ETF’s.  A couple years ago this was not possible, but as more traders/investors use ETF’s they become a much better tool for gauging the health of the market and seeing where the money is flowing (or not flowing).  Using the proprietary SelfInvestors Demand Indicator score which measures price and volume movements, I’m able to quickly see which sectors/industries are seeing the greatest inflows of cash.  For a detailed look at how I go about gauging sector/industry strength please see the following post: http://selfinvestors.com/si/industry_tracking/

* Current Leading Sectors/Industries (over last 30 trading days):  
Gold, Biotech, Networking, Technology, Aerospace/Defense
                                          
* Current Lagging Sectors/Industries (over last 30 trading days): 
Retail, Consumer Discretionary, Transports

* Today’s Market Moving Industries/Sectors (UP):
Gold Miners, Retail, Telecom, Real Estate, Energy

* Today’s Market Moving Industries/Sectors (DOWN):
NO big down movers today.

::: Stocks :::

The stocks section will be an area where I highlight one stock selected from a group of stocks moving up with volume well above average and most likely breaking out of a base or consolidation.  Today’s stock is Baidu.com (BIDU) which just continues to defy gravity.

ABOUT: 

Baidu.com, Inc. (Baidu) is a Chinese-language Internet search provider. The Company conducts its operations principally through Baidu Online, its wholly owned subsidiary in Beijing, the People’s Republic of China. In addition, it conducts part of its operations through Baidu Netcom, a limited liability company in Beijing, the People’s Republic of China, which holds the licenses and approvals necessary to operate Baidu’s Websites and provide online advertising services. Baidu offers a Chinese-language search platform, which consists of its Websites and certain online application software, as well as Baidu Union, which is its network of third-party Websites and software applications. It primarily provides Chinese language Internet search services to enable users to find information online, including Web pages, news, images and multimedia files, through links provided on its Websites. In April 2006, the Company established Baidu Times, a wholly owned subsidiary in Beijing.

FUNDAMENTALS: 

Since posting its first profitable year in 2004, Baidu has been a company on an extraordinary growth path, with a near tripling of profits in 2005 and then quadrupling profits in 2006.  It’s not possible to sustain that kind of growth and it has moderated some but the company is still expected to post earnings growth of 75% this year and then again in 2008.  Both net margins (37%) and return on equity (32%) have spiked considerably higher in the last year.  One key characteristic that I look for in big winners are accelerating margins and ROE and Baidu certainly fits the bill.  This all adds up to a near perfect 29/30 fundamental ranking in the SelfInvestors.com database.

TECHNICAL:  

BIDU broke out of a base today with decent volume to a new all time high.  This in and of itself is very bullish action, but the base itself is a bit poorly formed.  Considering the run it’s had since first breaking out in May, I’d like to see a longer consolidation.  The current base is not quite 8 weeks old and the formation is a fairly sharp V like pattern.  These patterns can work and if any stock can continue vaulting from a less than perfect base it’s BIDU, but I’m taking a cautious approach considering the shaky base and the uncertain overall market.  I’m adding a very small position on the breakout and will look to add more on a successful test and bounce off the 50 day moving average.

SELFINVESTORS RATING: With a total score of 52/60 (29/30 for fundamentals, 23/30 for technical), Baidu.com (BIDU) has been and continues to be a top breakout stock.

Full Disclosure/Disclaimer: The stock of the day is by no means a buy recommendation.  Please do your own research and make a personal decision based on your own tolerance for risk.  I currently own a small position in BIDU and will be looking to add a little more when this pullback is complete.

The Best Place to Be Remains on the Sidelines; Gold Shines

Last week played out just about how it could have been expected as the market pushed a bit higher before exhausting its lengthy run right around key resistance levels following the big capitulation day on August 16th.  This against a back drop of contrasting economic data last week as the typically poor housing start numbers were tempered by decent retail and manufacturing results.  Doubts about whether the Fed would cut rates at all were beginning to creep in the minds of traders.. that is until the big miss in the jobs number on Friday which many think tips the scales to a certain Fed rate cut during its next meeting.  Fed funds futures are even pricing in a 40% chance of a 50 basis rate cut.

The Fed has been saying that the impact of the credit/subprime issues on the overall economy has been relatively contained and that they won’t make any moves to help prop up the market or bail anyone out so I have to say I’m surprised that there is so much certainty out there that a rate cut will happen.  While I definitely think the odds are in favor of a .25% rate cut on September 18th, we certainly can’t rule out that the Fed will continue to use other means (providing liquidity, cutting at the discount window) until it sees more definitive evidence that the broader economy is at risk.  Can we really make any assumptions about one jobs report which has always been extremely volatile?  From a trading standpoint it’s important to remember that the expectation of a fed rate cut has been the backbone of the rally off the lows with a 25 basis point cut priced into the market.  I think the ONLY way this market doesn’t eventually test the August lows is if the Fed cuts by 50 basis points at the September meeting.  In the scenario of a 25 basis point cut, we probably get a knee jerk run up reaction following the announcement before the market turns tail and continues lower, repairing the technical damage inflicted in mid August.  If no rate cut takes place this September, look out below. 

Running through these scenarios is a good reminder of just how tricky this current market is to make money in.  The bears have the upper hand right now, but the almighty Fed can strike at any moment with news of a rate cut killing short positions.  It all adds up to what I’ve been saying for several weeks now.  The best place for most people to be right now is on the sidelines.  That will probably remain so through this month and possibly into October.

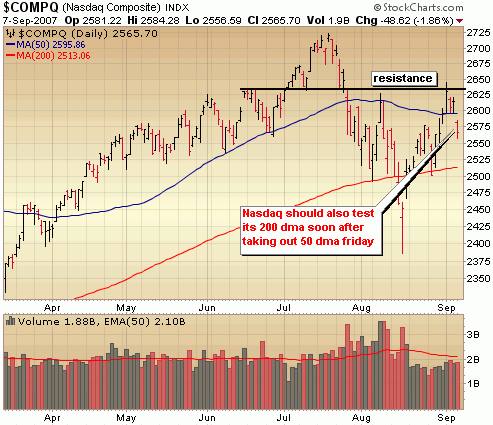
Let’s have a look at the charts.  The Nasdaq pushed to the last level of resistance before resistance of multi year highs and it looked like for a moment it might hold at that 50 day moving average, but the jobs report sent the markets reeling a bit and the Nasdaq below this support level.  Notice the selling volume wasn’t particularly intense on Friday but enough to call it a day of distribution.  The Nasdaq will probably go on to test its 200 day moving average in the coming days.

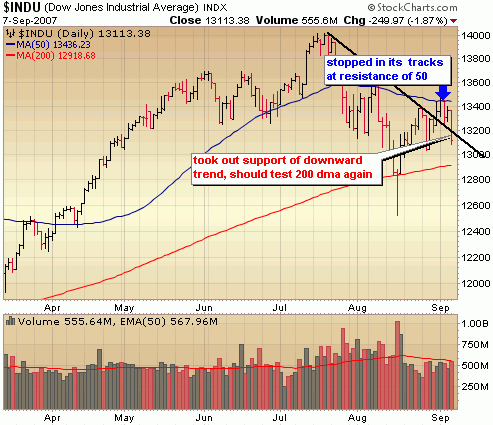
The Dow tested resistance of the 50 day moving average but never broke through like the Nasdaq did.  On Friday it broke through support of the downward trend line and is also likely headed to that 200 day moving average.

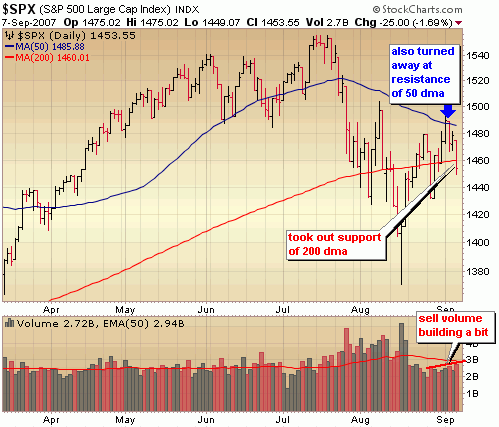
The S&P was also turned away at its 50 day moving average, but unlike the Dow and Naz has already taken out its 200 day moving average.  There really isn’t much support in place until it gets back to near those August lows.. around 1400.

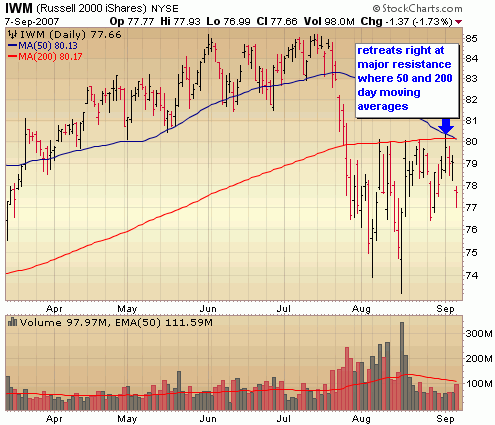
The tracking ETF of the Russell 2000 below is very telling.  This is a classic breakdown, where the stock takes out key support levels, tests new resistance and then resumes the trend down.  In this case, at the strong resistance level where the 50 and 200 day moving averages converge.  In all likelihood the Russell will retest the August lows.

 ::: Model Portfolio Update :::

I continue to trade lighly in this environment with a large cash position.  I did underestimate the potential for the oversold bounce after the big day of capitulation on Aug 16th and admittedly rushed into a few additional short positions a little early.  Small short positions in First Solar (FSLR) and Iconix Brands (ICON) were closed for losses of 12% and 8% respectively, but considering they were small positions the portfolio performance didn’t take much of a hit.  While the market remains a bit stronger than I thought it would be at this point, the bears still have the upper hand and my bias continues to be on the short side.  I replaced the two closed short positions with two new positions on the short side while maintaining long term "long" positions in both Cisco and Google.  A few more days like Friday and I may begin putting a bit more cash into the long side, but in all likelihood I won’t do much of anything for at least the next few weeks.  There is absolutely nothing wrong with continuing to sit on a pile of cash right now.  For the week, the portfolio dipped a bit by .4% bringing the year to date performance to 8.8%, more than 3x the performance of the S&P.  My results this year certainly haven’t been extraordinary, but I’m not all unhappy with the gains in what has been a very difficult market to read.  Current allocation of the portfolio is 53% cash, 24% long and 23% short.

::: Best/Worst Performers :::

– Top 10 Performing Industries For the Week –

1. Silver: 10.65%
2. Gold: 9.55%
3. Drug Related Products: 7.60%
4. Dairy Products: 5.00%
5. Oil & Gas Drilling & Exploration: 4.85%
6. Broadcasting – Radio: 4.55%
7. Catalog & Mail Order Houses:  4.20%
8. Oil & Gas Equip & Services: 4.00%
9. Independent Oil & Gas: 4.00%
10. Music & Video Stores: 3.85%

– Top 10 Worst Performing Industries For the Week –

1. Recreaional Vehicles: -7.10%
2. Toy & Hobby Stores: -5.20%
3. Home Improvement Stores: -5.20%
4. Rubber & Plastics: -4.75%
5. Office Supplies: -4.70%
6. Specialty Retail: -4.60%
7. Staffing & Outsourcing: -4.40%
8. Residential Construction: -4.40%
9. Department Stores: -3.80%
10. Manufactured Housing: -3.60%

– Top 5 Best Performing ETFs For the Week –
 
1. Morgan Stanley China (CAF)  13.85%
2. Market Vectors Gold Miners (GDX) 12.75%
3. ASA Gold (ASA) 9.70%
4. Ishares Silver (SLV) 6.35%
5. SPDR Gold (GLD) 5.45%

– Worst 5 Performing ETF’s –

1. Thai Fund (TTF)  -5.60%
2. Home Construction (ITB) -4.65%
3. Japan Small Cap (JOF) -4.40%
4. SPDR Homebuilders (XHB) -4.30%
5. Powershares Retail (PMR)  -3.95%

:::  IPO’s Worth Watching for This Week :::

No IPO’s scheduled for the next couple weeks. 

::: Upcoming Economic Reports (9/10/07 – 9/14/07) :::

Monday:         Consumer Credit
Tuesday:       Trade Balance
Wednesday: Crude Inventories
Thursday:      Initial Claims, Treasury Budget
Friday:            Retail Sales, Capacity Utilization, Import/Export Prices, Business Inventories

::: Upcoming Notable Earnings Reports :::

None this week

::: In Case You Missed It – SelfInvestors Blog Entries of the Past Week :::

1. Credit Card Rental Car Insurance

2. Trades of the Day – Short Opportunities in Chordiant Software (CHRD) & United Online (UNTD)

3. Trade of the Day – Bullish Triangle Breakout in HMS Holdings (HMSY)

4. CANSLIM Inquiry; Model Portfolio Performance & Buy/Sell Alerts

CANSLIM Inquiry; Model Portfolio Performance & Buy/Sell Alerts

A member recently wrote in with the following questions:

I came across your site the other day when searching CANSLIM. I find your site very interesting, and would like to ask you a few questions if you don’t mind.

1. How is your portfolio doing this year, and what’s the YTD return?
2. I am new to CANSLIM, in your opinion, will it be a good approach for casual trader?
3. In the beginning, I may need to follow your trade closely to get myself familiar with CANSLIM. Will you give buy/sell signal with reasons? Will you treat each trade the same in asset allocation, or differently because some may be more speculative play?

That’s all for now, and thank you very much for your time.

My Response:

Let me begin by saying that while I do use a CANSLIM approach to a certain degree, I use a much more flexible approach and implement my own variation- for example at times I use big momentum swing trades based purely on technicals when the time is right.  I also use extensive short trading during times of market weakness to profit on the other side.  So, while the core of my strategy focuses on buying the best companies and holding for several weeks/months, my strategy will ultimately depend on what the market gives me.  As far as cutting losses at 8% which the CANSLIM method recommends, again I choose to be more flexible.  Sometimes I cut my loss at 2% and other times it may be as much as 12%.  Generally, speaking though I adhere to the principle of keeping losses small.  This is critical.  My average loss over the past few years is right around 5%.

1.  The SelfInvestors Model portfolio is up just over 9% this year.  I’m going to have a tough time duplicating my 27.6% gain last year but given this incredibly volatile, sometimes irrational market I’m not at all unhappy with the performance thus far which is still more than double the S&P.  Each and every week I do a short review of the my performance in the Weekly Report released on Sundays.  I believe in complete transparency.  Hyping a few big winners while sweeping the losers under the rug seems to be the status of quo of many advisory services. 

2.  The CANSLIM approach is quite research intensive because you are focusing on technicals and fundamentals as well as gauging the health of the overall market.  Going this alone will consume much of your free time which is why I developed the tracking system and buy/sell alerts.  I do all the work and my tracking systems spit out the best candidates near a breakout or still in a buyable range.

3.  Absolutely.  All buy and sell signals (received within a few minutes of the transaction) come with a fairly detailed explanation of the trade and the size of each trade will depend upon the overall health of the market and the risk level of the trade.  For example a purchase in Cisco or Google will be much larger than a swing trade in a 3 dollar stock.

Here’s an example of a trading alert in Nastech Pharmaceuticals (NSTK) sent to members today:

"It’s been a very long time since I’ve initiated a QSP trade.  The conditions just haven’t been ripe recently and as I’ve said before I’m not going to initiate alerts for entertainment purposes.  There may be times when I go a few weeks without a new trade (although that will be rare).  While the overall market conditions remain volatile and uncertain making big bets on either side risky there is a sector that is seeing some big money coming in recently.  It’s possible that the next round of market leaders will come from this space.  That space is biotech.  NSTK is one such biotech stock that has seen some big buy volume behind it and it’s been featured in the #1 longs list for some time now.  I believe the time is right to initiate a small QSP trade in NSTK.  I’m in at 14.43 with a $10K position.

There are a few others you might look at in the sector such as IDP and ACEL.  I’ll have a special report on the biotechs for you this weekend."

Interested in the tracking databases, the model portfolio or email alerts of the SelfInvestors premium services?
Get all the details of each membership here:
https://selfinvestors.com/tradingstocks/memberships/

Trade of the Day – Bullish Triangle Breakout in HMS Holdings (HMSY)

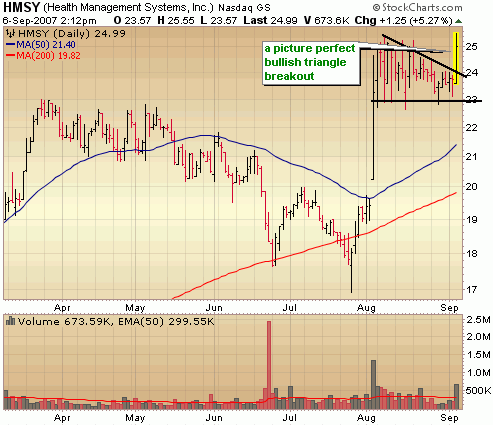
It’s been awhile since I’ve featured a trade on the long side due to increasing risk there, but couldn’t pass up this gem in HMSY which is breaking from a bullish triangle formation with volume today.  This formation is up in all time highs territory and a break above 25.40 would be an all time high.  Doesn’t get too much more bullish than this.  Tread lightly with long trades here though.


Trades of the Day – Short Opportunities in Chordiant Software (CHRD) & United Online (UNTD)

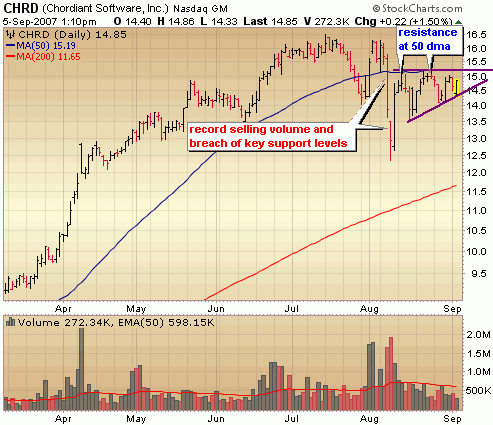
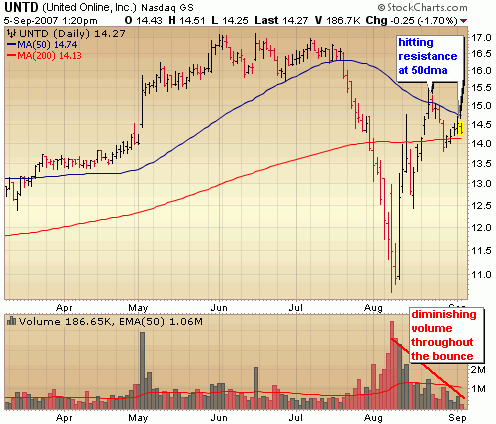
Since there have been few posts in the last couple weeks during my vacation I thought I’d come at with you with not one but two great looking short plays.  I know it’s exciting but please to try to contain yourself.   First up is CHRD, a stock that broke down with record selling volume in mid August and has since retraced some of that move and is now meandering along resistance of the 50 day moving average.  Notice there is a bit of a bearish triangle formation there.  I want to see this stock go from meandering to making a definitive move from this sideways action.  That ALWAYS mean another spike in selling volume and will probably mean it takes out the triangle formation somewhere around 14.40 (or today’s lows).  There isn’t any support until around 12.50 so that would be a nice short trade if it can break down from here.

Next up is UNTD, which has carved out a similar path but over longer time frames.  It’s amazing to see how it dropped 14 of 15 days in late July/early August.  It’s no suprise that the stock has bounced back from those oversold conditions.  When I look for good short positions I want to see diminishing volume levels on these retracements after a big sell off and that’s exactly what we see in UNTD.  I also want to see it retreat from resistance levels, which we also see around the 50 day moving average.  From here, like in CHRD, I want to see selling volume come back into the stock which would probably be indicative that the stock is ready to resume the trend down.