All posts by Tate Dwinnell

Stock Trade of Day – FalconStor Software (FALC) Cup With Handle Breakout

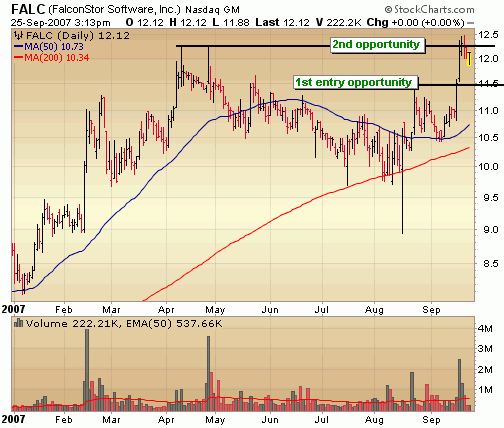
Today’s trade of the day features another cup with handle base.  Falconstor (FALC) is a company with not only a great looking stock chart but with great fundamentals making it a potentially good longer term play.  The stock first broke out on September 18th with very heavy volume and on that day offered the first entry point.  The very next day the stock cleared multi year highs above 12.28 and is now digesting those gains with light selling volume.  I don’t expect this stock to stay down for long.

Halo 3 Launches Amid Rave Reviews

halo 3In just a few minutes Halo 3 launches to the masses in packed electronics and gaming stores across the country.  It’s expected to be the biggest video game launch in history with expected sales of 200 million just in the first day alone.  Yowza!! Halo 3 may just give Microsoft (MSFT) another leg up on Sony (SNE) in the gaming wars as Halo 3 will only be available on the Xbox 360 and launches amid rave reviews.  Metacritic.com, an aggegrator of reviews of games, movies, music, tv shows and books rates Halo 3 a 96 out of 100.

A few reviews:

"It’s solid gameplay, immense replayability, online functionality and incredible production values will ensure its place in video game history, and it is, without a doubt, a satisfying and fulfilling close to the beloved trilogy" – GamePro

"The Forge is a gargantuan achievement that puts game design in the hands of players, daring you to be creative and invent a Halo 3 multiplayer experience all your own. Of course, the multiplayer is every bit as astonishing as it has been in past iterations and even eclipses its predecessors in many respects"  – GameSpy

"The best game yet in one of the best FPS franchises of the era. Better than either of its predecessors, Halo 3 still can’t quite escape the category of flawed masterpiece – but this time around, the flaws are so minor that even the most churlish of reviewers would be hard pressed to mark the game down. " – Eurogamer

So how to profit?  Well.. the obvious choice is Microsoft even though a huge Halo 3 success and robust XBox360 sales would still represent a small fraction of overall revenues.  The stock actually looks good at these levels and for the long term holder I don’t see any reason why a position here wouldn’t be profitable over the next few years.  Technically, I would wait for a surge above the 200 day moving average and that looks all but assured at this point.

The other obvious choice is GameStop (GME), but Halo 3 success is very much built into the stock already.  That being said, it still looks very strong technically but initiating a position up at these levels carries considerably more risk.

Microsoft may have flat out failed in a Web 2.0 initiative (hence the desperation for a piece of Facebook), but it appears to be spending its way into success in the gaming industry which will only continue to grow as games become more appealing to the masses. 

Swing Trade Case Study – China Precision Steel (CPSL)

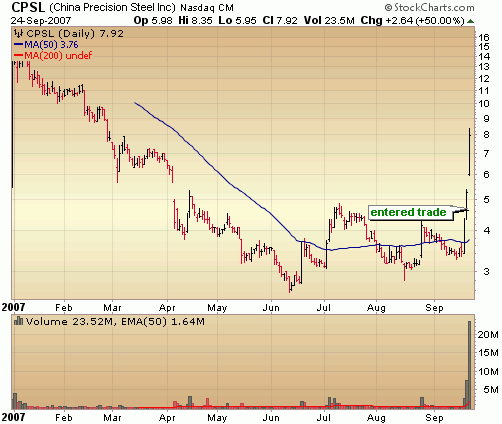
As you know, all of the top Chinese stocks have been on fire.  You can start with Baidu.com (BIDU) (which I featured as Stock of the Day after breaking out a few weeks ago) and go on down the list.  At this point, I’d say the space is getting a bit too frothy with the smaller, more speculative names soaring to massive gains in short periods.  Case in point – China Precision Steel (CPSL), a very small China steel play in a company with highly erratic growth.  It’s a stock that has been in my list of #1 Longs (a new biweekly watchlist highlighting the best trading opportunities that I send to Gold and Platinum members) and was mentioned in the Telechart Live Chat room on Friday as I initiated a position at 4.64.  Below is the daily chart which illustrates the tremendous move over the past 3 days with extraordinary volume.

I was alerted to the move in CPSL on Thursday as it surged above the 50 day moving average but chose to hold off on a purchase until it confirmed the move.  With a gap up on Friday clearing the August highs at 4.29, followed by  tight consolidation and renewed heavy buying in the stock, it was all I needed for an entry signal.  There was certainly enough strength to test the August highs at 4.86 and potentially test the next level of resistance at the top of the gap down way back in April around 5.68 (which also happened to be resistance around the 200 day moving average).  This morning, when the stock gapped up above that key resistance level too, I knew it was on. 

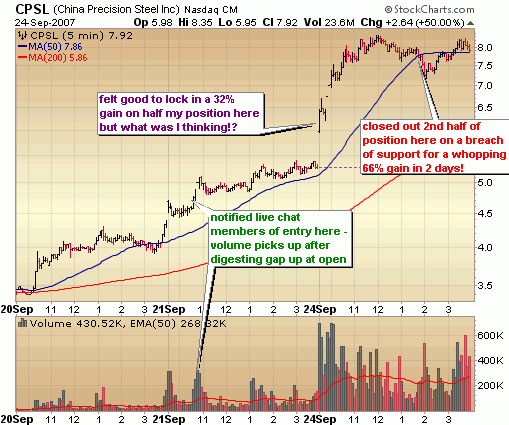
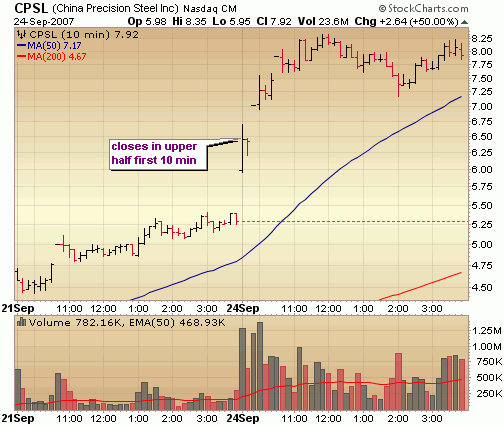
… BUT I made a big mistake!  Instead of sticking to my trading rules, I went with my intuition on this one and decided to lock in profits on half of my position at 6.16 right at the open.  I was the opposite of greedy – I wouldn’t call it fear, but I would call it being too cautious.  The rule that I typically use when deciding to lock in a gain on a gap up is whether the stock closes in the upper half of its range on the 10 minute intraday bar (as shown below). 

This morning, I didn’t let the trade develop at all and it cost me a big chunk of change.  I can’t be too discouraged because the total position was closed for a nearly 50% profit, but I think there are lessons to be learned in even successful  trades as I’ve shown here.  I closed out the last half of my position when it broke through the 50 day moving average on the 5 minute chart.  However, given the amount of volume behind the move today and the fact that it closed near the highs of the day once again, there is a very good chance it could run again at the open tomorrow.  If you’re holding a position overnight, consider not making the same mistake I made at the open today and let the stock complete that first 10 minute bar.  If it closes in the lower half of the bar, you might want to take the profits in this highly speculative stock.

Market Needs Rest Before Tackling Double Top

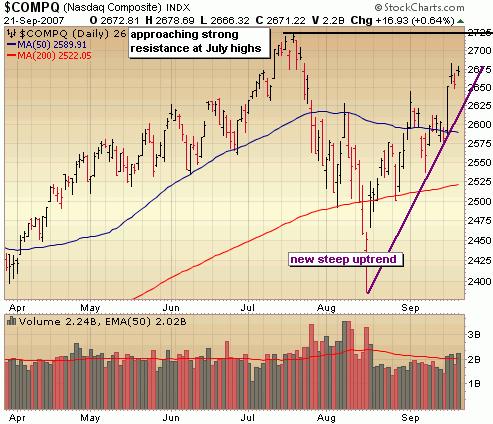
Phew, what a week!  After all that .. the inflation data, the Fed decision, OJ Simpson and some  triple witching the bulls have emerged as the victor of the battle, but have they won the war?  Not yet.  As the major indices approach those July highs the threat of the dreaded double top looms.  Before I can be convinced that another major rally is in the cards, the indices will need to take out those highs convincingly.  I think before that can become a reality, there needs to be some kind of consolidation of the recent rally in order to coil  the spring for a valiant go at a big breakout.  I want to see some kind of retracement of the move off the bottom in August with declining volume which would offer an opportunity to get a bit more aggressive on the long side.  With the euphoria of the Fed move wearing off and the initial surge of short covering largely depleted, the market may just get a good rest over the next week or two before we get into the bulk of earnings.

The chart of the Nasdaq below shows there is a bit of breathing room before it smacks into major resistance at those July highs.  We’ll have to keep a close eye on those levels and see how the market reacts as it could be long term failure point.  Given the action of this Fed, I don’t think that will happen but it’s something to keep an eye one.  Note the steep upward trend over the past month which will provide an initial source of support.

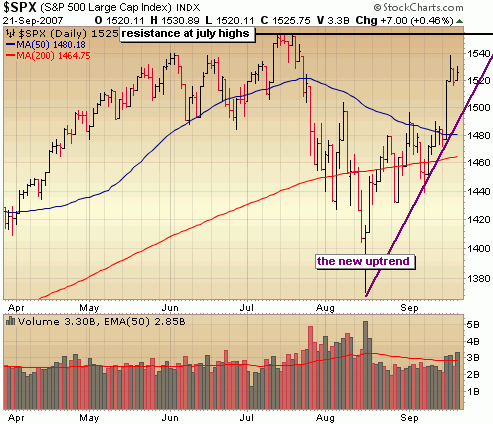
The S&P is nearing that big resistance point as well but has a bit of room to run.  Again, that is a steep upward trend over the past month and I think we need to at the very least retrest that trend line before heading higher so getting aggressive on the long side up at these levels is a bit too risky in my opinion.

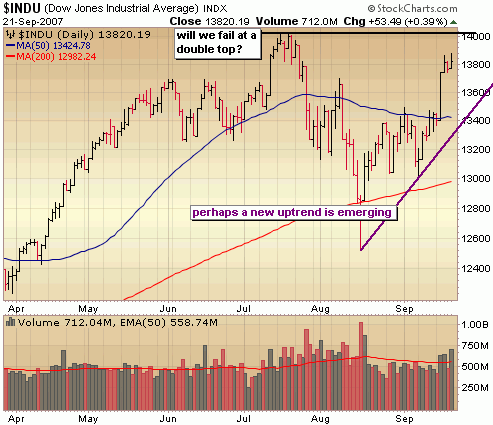
The Dow is much closer to those July highs (which are all time highs) and we may just hit those sometime this week.  The upward trend isn’t as steep in the Dow, but I believe also needs to at least retest that trend line before having a serious go at taking out those all time highs.

 ::: Model Portfolio Update :::

Every couple of months or so, there is what I would call a major shift in the portfolio from short to long or long to short.  Considering I was treading lightly with just a few long AND short positions and evenly balanced on either side, I wouldn’t call last Tuesday a dramatic shift in the portfolio, but I certainly acted quickly and decisively by closing out my four small short positions immediately following the Fed decision.  I don’t regret holding a few short positions ahead of the Fed and still believe that if they had cut by 25 basis points like everyone expected, the market would have ultimately sold off.  I was caught leaning the wrong way, but that’s OK.  The damage was minimized and the portfolio was still able to score a good 2% gain during the week, led by the almighty Google surging to new all time highs (a core holding in the portfolio) and helped by 3 new long positions in top IPO’s.  After closing my 4 short positions in United Online (UNTD) for a 7% gain, Praxair (PX) for a 3% loss, Tenaris (TS) for a 5% loss and Ashland (ASH) for a 5% loss I’m left with 5 long positions and won’t get more aggressive on the long side until one of two things happens.  This market digests recent gains quietly, pulling back a few percentage points OR the market breaks out above those July highs.  The Self Investors Model Portfolio year to date performance increased to 10.9% and the allocation stands at 37% long, 0% short and a large 63% cash position.

::: Best/Worst Performers :::

– Top 10 Performing Industries For the Week –

1. Metal Fabrication: 9.85%
2. Silver: 9.60%
3. Nonmetallic Mineral Mining: 9.40%
4. Copper: 9.35%
5. Housewares & Accessories: 9.20%
6. Steel & Iron: 8.75%
7. Gold:  8.65%
8. General Entertainment: 8.00%
9. Industrials Metals & Minerals: 7.95%
10. Agriculutural Chemicals: 7.60%

– Top 10 Worst Performing Industries For the Week –

1. Sporting Goods: -5.00%
2. Long Distance Carriers: -4.80%
3. Toy & Hobby Stores: -4.25%
4. Manufactured Housing: -2.85%
5. Processing Systems & Products: -2.60%
6. Broadcasting – Radio: -2.45%
7. Trucking: -2.30%
8. Auto Dealerships: -2.05%
9. Medical Practitioners: -2.00%
10. Insurance Brokers: -1.80%

– Top 5 Best Performing ETFs For the Week –
 
1. Morgan Stanley China (CAF)  11.00%
2. PowerShares Golden Dragon (PGJ) 9.70%
3. Market Vectors Steel (SLX) 9.50%
4. Ishares Brazil (EWZ) 8.15%
5. Indonesia Fund (IF) 8.00%

– Worst 5 Performing ETF’s –

1. US Natural Gas (UNG)  -1.80%
2. SPDR Homebuilders (XHB) -1.30%
3. SPDR Consumer Discretionary (XLY) .60%
4. Ishares Transports (IYT) .70%
5. Ishares Health Care (IHF)  1.00%

:::  IPO’s Worth Watching for This Week :::

1. Duff & Phelps (DUF): provides financial advisory services to public and private corporations, investment firms, law firms, and public accounting firms. The company specializes in offering fairness opinions regarding financial reporting, tax valuations, real estate and other asset valuations, and dispute resolution. It also offers investment banking services to companies undergoing mergers and acquisitions, financial restructurings, private placements of shares, or other transactions.  Trading set to begin on Friday.

::: Upcoming Economic Reports (9/24/07 – 9/28/07) :::

Monday:         None
Tuesday:       Existing Home Sales, Consumer Confidence
Wednesday: Durable Orders, Crude Inventories
Thursday:      Initial Claims, GDP (final), New Home Sales
Friday:            Personal Income/Spending, Core PCE Inflation, Chicago PMI, Construction Spending

::: Upcoming Notable Earnings Reports :::

Wednesday: Paychex (PAYX)

::: In Case You Missed It – SelfInvestors Blog Entries of the Past Week :::

1. Breakout Stocks Review: Top Pick Simulations Plus (SLP)

2. Be Zen, Be Like Ben; Stock of Day: Yingli Green Energy (YGE)

3. Trade of Day – Amtech Systems (ASYS) Breaks Out of Cup With Handle

4. Secondary Offerings & Valuation Downgrades May Offer Opportunity

Secondary Offerings & Valuation Downgrades May Offer Opportunity

Beating the market and making money trading stocks year after year is no easy task despite what many will have you believe.  It requires hard work, discipline, emotional control and organization.  It requires an edge.  There are thousands of strategies, chart patterns and tools out there to help you reach your investing goals and there are certainly more ways than one to consistently profit in the stock market.  The key is finding your own way, your own path.  Master the essentials, then over time come up with your own strategies.  Patterns will emerge that you can take advantage of. 

One such pattern that I have found is what I call a "red tag sale".  This happens ahead of the opening bell on news of a valuation downgrade in a top performing stock.  90% of the time, you can throw brokerage price targets and opinions out the window.  The edge and your opportunity comes from taking the opposite position.  A valuation downgrade in a top tier company is nothing more than a red tag sale in that the brokerage downgrades the stock based on valuation, the stock gaps down at the open and you get the opportunity to pick up shares in a high flying stock a bit cheaper.  When looking for these kinds of opportunities take a look at the chart to decide if it’s a good play.  Did the stock recently breakout?  Is buy volume spiking?  Is the stock at all time highs?  If a top rated company recently broke out with big volume and a valuation downgrade pushes the stock back to the breakout point, then that is an ideal situation to get in or add shares.  I wasn’t able to find a good recent example of this but you get the idea.

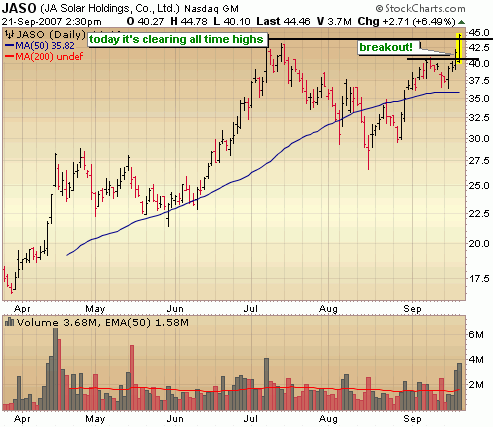
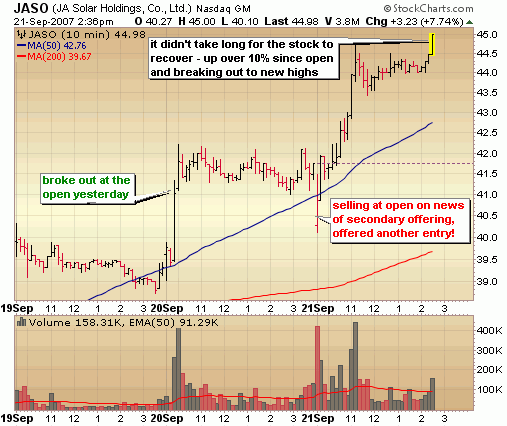
Another situation that I like to profit in involves a secondary offering announcement which occurs when the company offers additional shares for sale.  The dilutive effect of the increase in supply most often results in a sell off in the stock but again this is often temporary in the best companies because the demand is able to soak up the added supply.  This is another chance to pick up shares a bit cheaper.  Again, I look at the chart to see if this temporary dip offers a good entry point to initiate a position for add shares.  A perfect example of this occurred just this morning in JASO, a highly rated solar play.  Yesterday, the stock broke out of a cup with handle base with good volume, but announced last night a registration with the SEC to offer additional shares.  If you missed the breakout yesterday, this news offered a chance to get in near the breakout point!  At this open this morning I notified premium members of the entry point and we’re up over 10% just today as the stock breaks out to new all time highs.

Trade of Day – Amtech Systems (ASYS) Breaks Out of Cup With Handle

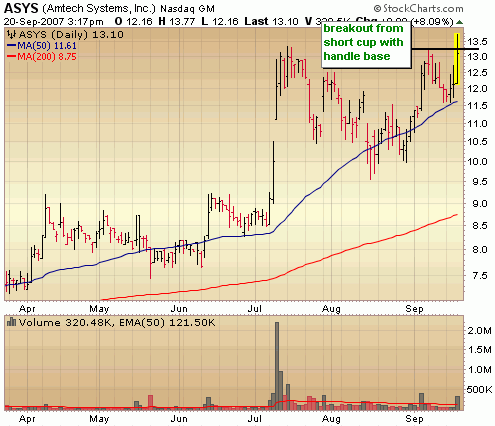
I haven’t featured too many cup with handle bases in the trades of the day segment, but they  are one of most successful chart patterns in a strong market.  On such cup with handle chart that has caught my eye recently is ASYS which has carved out a short but very bullish looking cup pattern and today is breaking out of the handle formation and briefly touched all time highs before pulling back.  Looking at buy vs sell volume ratios, all indications point to further gains from here.

asys cup with handle breakout

Be Zen, Be Like Ben; Stock of Day: Yingli Green Energy (YGE)

The Fed has spoken, the pressure valve of uncertainty has been lifted and shorts were sent scrambling.  Now it’s time to play the hand we’re dealt and the hand we’re dealt changes the game over the next several months from one of a bearish standpoint to one where looking for long opportunities will be most profitable.  We’re ultimately headed higher from here.

I was certainly in the majority and flat out wrong about what the Fed would do.  I was in the camp that the Fed would cut 25 points and use the discount window for a more aggressive 50 point cut, resulting in a sizable knee jerk move up, followed by selling.  As it turns out, to the shock of many, the Fed cut the rate 50 points on both the fed funds and at the discount window and the market soared to its largest gains in a few years. 

Now this preemptive, bold move by the Fed can be debated until we’re all blue in the face but the fact of the matter is that this injects significant liquidity into the market and releases the pressure valve in the credit markets which should keep the market rising at least over the next several months.  Although I tend to consider this move a bit of an overreaction, what do I know?  The Fed has access to more data points then we can imagine and clearly the Fed has seen enough erosion to think that the economy may be in serious trouble.  They didn’t make a decision based on the "potential" for increasing inflation but rather acted decisively to curb the problems that we can see here and now.  Ben and team acted in the here and now rather than on what could be (the inflation monster).  I’ll call it the Zen of Ben.  Yes, the piper may still need to be paid following the easy money cycle and all the greed and speculation it brought with it.  This move may just delay the inevitable.  But for now we should not concern ourselves with what may or may not occur down the road.  This could be a brilliant move or a disaster and only time will tell.  For now be like Ben, be Zen.  Focus on the here and now and profit from the long side while the good times roll.  That means living, thinking, trading in the moment and not fighting this Fed.

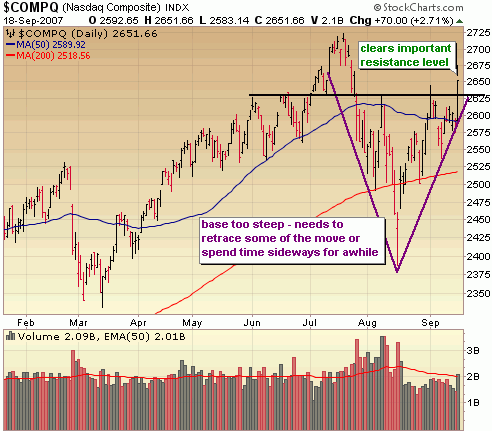
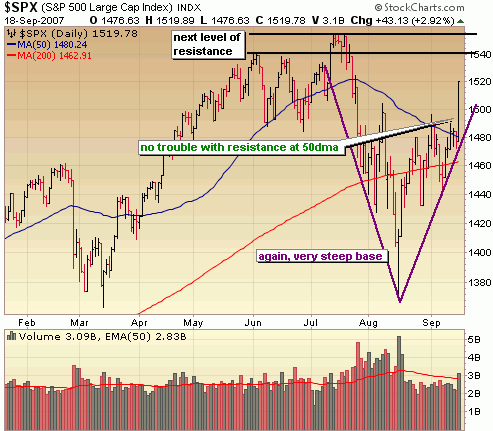
From a technical perspective, volume levels weren’t great today but considering that the market was basically flat lined for several hours I don’t see it as a huge concern.  What is more of a concern is the sharp V like move off those mid August lows (up 10% in just a month).  This market really needs to repair that technical damage a bit more by retracing some of the move or spending some time sideways for a few weeks.  Unless the market continues the habit of shrugging off corrections and soaring to new heights without looking back, the likely action is up to near the July highs then a month or two of sideways action before bolting higher for the rest of the year.  That’s how a "technically rational" market might play out but as we’ve seen over the past several months, the market has been anything but technically rational.  At any rate,  any decent pull backs from here offers opportunity on the long side.

A look at the Nasdaq reveals that no significant resistance levels stand in its way between here and multi year highs around 2725.  Note the steep V like base which is prone to failure.  I think a move to test the highs is all but assured, but a successful breakout to multi year highs and a hold above those levels is not.
The S&P convincingly took out resistance of the 50 day moving average today and is headed to the next level of resistance at 1540.  I’m hesitant to initiate many long positions at this level and want to see some kind of retracement of today’s move before getting aggressive on the long side.
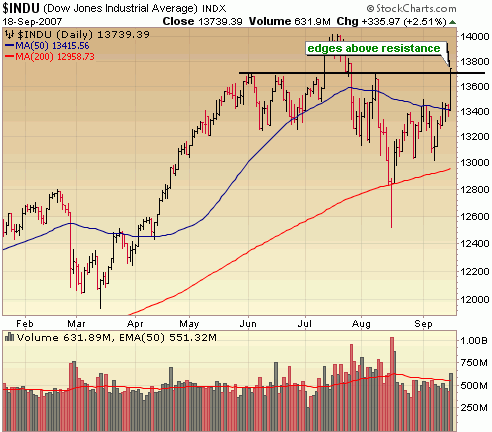
The DOW just edged up above key resistance around 13700 today.  It looks likely that it will soon go on to test its all time highs around 14000.
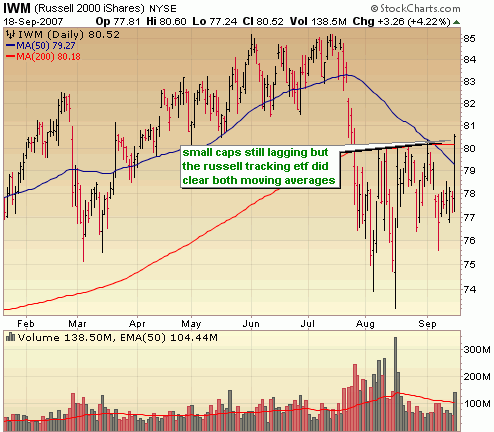
Finally, the Russell Tracking ETF (IWM), cleared two key resistance levels of the 50 and 200 day moving averages.  Small caps remain the laggards.
 
::: Major Indices Performance – The Numbers :::

(Note: volume averages are based on the average over the past 50 days)
Data as of 4:00EST – End of Day September 18th 2007

Nasdaq: UP 2.71% today with volume 5% ABOVE  average
Nasdaq ETF (QQQQ) UP 2.52%, volume 2% ABOVE average
Dow: UP 2.51%, with volume 15% ABOVE the average
Dow ETF (DIA): UP 2.45%, volume 6% BELOW the average
S&P ETF (SPY): UP 2.94%, volume 15% ABOVE the average
Russell Small Cap ETF (IWM): UP 4.22%, volume 15% ABOVE the average

::: SelflInvestors Leading Stocks :::

The Self Investors Leading Stocks Index is comprised of stocks in the Breakout Tracker, which is a database of the fastest growing companies near a breakout or having already broken out of a base.  Leading stocks did very well today and about in line with what the Russell did.  The small ones clearly led the way today, but as with the overall market, volume could have been a bit stronger.

Summary:

* Advancers led Decliners 284 to 15
* Advancers were up an average of 3.84% today, with volume 8% ABOVE average
* Decliners were down an average of 1.67% with volume 7% BELOW average
* The total SI Leading Stocks Index was UP 3.57% today with volume 8% ABOVE average

::: Where’s the Money Flowing :::

Many investing websites provide leading industries based on price performance alone. However, without accompanying volume levels, this can sometimes be misleading.  The only way that I know of to gauge industry/sector strength WITH volume levels is through the analysis of ETF’s.  A couple years ago this was not possible, but as more traders/investors use ETF’s they become a much better tool for gauging the health of the market and seeing where the money is flowing (or not flowing).  Using the proprietary SelfInvestors Demand Indicator score which measures price and volume movements, I’m able to quickly see which sectors/industries are seeing the greatest inflows of cash.  For a detailed look at how I go about gauging sector/industry strength please see the following post: http://selfinvestors.com/si/industry_tracking/

* Current Leading Sectors/Industries (over last 30 trading days):  
Gold, Consumer Goods, Consumer Staples, Networking, Telecom, Energy
                                          
* Current Lagging Sectors/Industries (over last 30 trading days): 
Home Builders, Transports, Real Estate, Nanotech, Broadband

* Today’s Market Moving Industries/Sectors (UP):
Home Construction, Regional Banks, Retail, Materials

* Today’s Market Moving Industries/Sectors (DOWN):
NO big down movers today.

::: Stocks :::

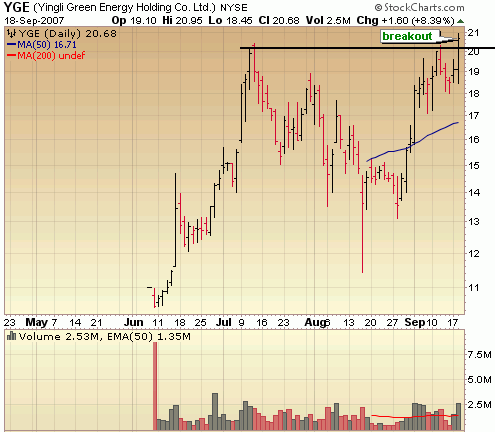
The stocks section will be an area where I highlight one stock selected from a group of stocks moving up with volume well above average and most likely breaking out of a base or consolidation.  Today’s stock is Yingli Green Energy (YGE), which broke out of a short cup with handle base today with strong volume.

ABOUT: 

Yingli Green Energy Holding Company Limited (Yingli Green Energy) is a vertically integrated photovoltaic (PV) product manufacturer in China. Through Baoding Tianwei Yingli New Energy Resources Co., Ltd. (Tianwei Yingli), the Company’s principal operating subsidiary based in China, it designs, manufactures and sells PV modules, and designs, assembles, sells and installs PV systems that are connected to an electricity transmission grid. As of June 7, 2007, the Company’s annual production capacity was 95 megawatts of polysilicon ingots and wafers, 90 megawatts of PV cells and 100 megawatts of PV modules. Yingli Green EnergyGÇÖs end-products include PV modules and PV systems in different sizes and power outputs. It sells PV modules under its own brand name, Yingli, to PV system integrators and distributors located in various markets around the world, including Germany, Spain, China and the United States.

FUNDAMENTALS: 

Yingli has been no exception to the exceptional growth seen in the solar industry over the past two years with earnings growth nearly quadrupling in 2006.  The company hit a bit of a snag with its earnings in the past two quarters but that is expected to be an abberation and the company is seen posting overall growth in 2007 of 82%, then another 90% growth in 2008.  Profit margins are good and return on equity is off the charts after a big spike over the past year.  Overall, despite the hiccup in the last two quarters, this is a company with great fundamentals and a ton of momentum.

TECHNICAL:  

I’m a big fan of highly rated IPO’s like Yingli which tend to do extremely well in strong markets because they are off the radar of many and it isn’t until they have run up significantly that people start paying attention (be sure to see a recently posted IPO watch list of the highest rated IPO’s).  Getting in on a breakout from the first base formation is an ideal entry point and that is exactly what the stock did today.  It broke out from a short cup with handle base formation at 20.40 with strong volume to a new all time high.  All indications point to further gains from here.
SELFINVESTORS RATING: With a total score of 51/60 (26/30 for fundamentals, 25/30 for technical), Yingli (YGE) is near the top of the SelfInvestors.com Breakout Watch list.

Full Disclosure/Disclaimer: The stock of the day is by no means a buy recommendation.  Please do your own research and make a personal decision based on your own tolerance for risk.  I currently do own a position in YGE.
Breakout Stocks Review: Top Pick Simulations Plus (SLP)

It’s time to return to the bi-monthly reviews of the SelfInvestors.com Breakout Tracker.  The Breakout Tracker has been the cornerstone of the premium service since day 1 and is a database comprised of the best companies in the world that are near a breakout or have broken out of a base (ie. cup with handle, flat, base on base, ascending, etc).  All stocks are analyzed and ranked by me before they ever make it to the database, guaranteeing only a database of the best.   The Breakout Tracker combines the power of the human element of stock research with the updating, sorting and filtering capabilities of a dynamic database, alerting members to buying opportunities in the highest quality stocks with very little research.

The following list is a screenshot of the Breakout Watch filter which spits out a list of the highest ranked stocks that are near a breakout or within 5% of the pivot (or breakout) point.  Note: Fundamental Rank (F Rank) and Technical Rank (T Rank) are ranked from 0 – 30, 30 being the best. 

Click on the image below for a larger image.

One other important thing to point out are the DI Scores, which are proprietary indicators of SelfInvestors that basically measure the demand in a stock using price and volume data over 20 and 40 days.  The higher the score, the greater the demand. 

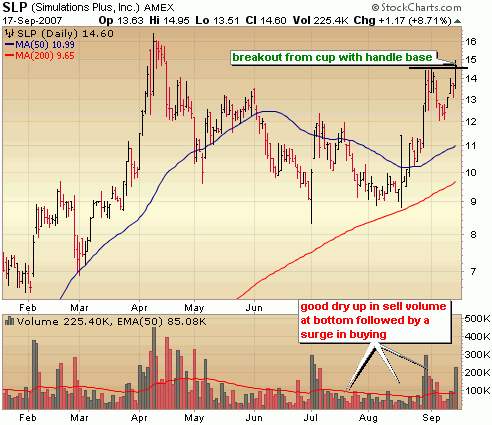
Please keep in mind that while there are some great looking opportunities in this list, the current market environment makes initiating positions more risky, so scaling into positions with small initial buys or avoiding positions altogether is probably the best course of action.  Of course, ALWAYS do your own research.. but you knew that 🙂  With the disclaimers out of the way, I’d like to highlight one breakout stock in particular – Simulations Plus (SLP).  The thin trading volume, lack of institutional ownership and the fact that the company did just over 6 million in sales in ’06 may cause concern for some but this also indicates it’s off the radar and could continue to provide explosive gains if the company can continue the growth it has posted over the past year and a half.  Technically, the base looks outstanding with a beauty of a breakout from a cup with handle base today.

Disclaimer: I currently own a small position in SLP.

Short Guide to Shorting Stocks

So how does shorting work?  Basically what you are doing is borrowing shares from your broker and selling them at current market price to another buyer in hopes of buying them back (or covering) at a discount in order to return the borrowed shares to the lender and keep the difference, which is your profit.  So, let’s say you short 100 shares of ABC at $10 a share.  So, you’ve borrowed 100 shares, sold them at the market price of $10 and your account would be credited $1000.  If the stock falls, you can buy the stock back at a cheaper price, repay the broker the shares you borrowed and pocket the difference.  So, let’s say the stock falls to $8/share and you buy the shares back (called "covering").  You pay the $800 dollars for the 100 shares, give them back to your broker and you get to the pocket the difference ($1000 – $800 = $200).  However, should you have to cover above $10/share, you will need to use additional funds in order to buy the shares back that you owe to your broker (you lose money!)  Here a few things to keep in mind when selling short:

** You must have a margin account to short stocks, for which you will be charged interest


** Avoid shorting stocks with large dividends or avoid shorting during the ex-dividend date – you pay the dividend


** Short stocks with good liquidity (at least a few hundred thousand shares)

** Avoid shorting stocks that are already heavily shorted to avoid being caught in a short squeeze.   A short squeeze happens when a large number of short traders attempt to cover their position at the same time, driving up the price of the stock quickly.  This is a another reason for sticking to stocks with good liquidity.  If caught in a short squeeze of a stock with poor liquidity, you could get slaughtered because there would be few shares available to purchase in order to cover your short position.  Usually, news in the market will trigger a short squeeze, but sometimes traders who notice a large number of shorts in a stock will attempt to induce one. The importance of liquidity can be felt here too, since the greater the number of shares traded in a stock, the less susceptible it is to manipulation by a single investor or small group of investors.  You can gauge the amount of short selling by checking the short interest in a stock which is expressed as a percentage of shares sold short (calculated by dividing the number of shares short by total shares outstanding).  Of course, the higher the percentage, the greater the short interest.  In addition, the short interest ratio, which is the number of shares sold short divided by average daily volume can indicate the amount of short selling in a stock.  This number is commonly expressed as "days to cover".  The higher the number of days to cover, the greater the likelihood of a short squeeze.  I have found www.shortsqueeze.com to be a good source for this information.

** Your broker may force you to cover the trade if it can no longer lend the shares to you (ie. the lender wants his shares back so that he can sell his position).  This is one big pitfall of short trading and can force you out of a trade long before you are ready and profitable!  If I were to take a guess this happens probably 10% of the time.

** I don’t buy the argument that shorting is extremely risky – it’s based on the notion that stocks can rise to infinite levels (meaning your losses could be infinite), whereas in a long trade your losses are limited because the stock can’t go lower than zero.  Sure, your losses can be endless in a short trade… if you let them!!  Just as with a long trade, it’s critical to practice sound money management by keeping losses small!

** Look for smaller profits in short trades (typically 10 – 20%), with the profit target near the next level of support.

In a future post I’ll have a look at the trade setups I use for shorting stocks.  You can certainly see the kinds of charts I look for in good shorting opportunities in past trades of the day, but I’ll go into a bit more detail.  If there is anything that I may have left out in this mini guide feel free to post a comment.