All posts by Tate Dwinnell

Shorts Sent Scrambling, But Need More Signs of Bottom

Holy moly, the long awaited oversold snap back rally has arrived! Time to locate those cash bundles under the spare bedroom mattress and buy, buy, buy!  Eh, well not exactly but after 6 consecutive weeks of market declines, it was good to see the green return in a big way.  While I don’t consider myself a bull or a bear, but a momentum trader, I do prefer a market that rises.  It’s quite a bit easier to make money in a rising market. 

Getting the market off on the right foot this morning was the report out of Wells Fargo which beat estimates and increased its dividend.  No it wasn’t a great quarter and profits decreased 21% from the year ago period, but quite extraordinary news under the circumstances and the market is going to reward companies that come out with any kind of positives.  I would imagine that is the largest single day percentage gain in its history (or darn near).  I think we’re really going to start seeing the market separate the wheat from the chaff in the financials, with those responsible financial institutions that largely avoided the sub prime mess seeing exceptional gains over the next few years.  You could put Wells Fargo (WFC) in that category. 

Also aiding equities today was another sharp drop in crude which has fallen about $10 a barrel in the last 2 days.  I’m still riding my DUG for nice profits and looking to lock in around resistance of the 200 day moving average, but it may get a little pull back before it tests that area. 

So what about today’s move on the technical side?  At this point I don’t see this as being a bottoming out move.  There is a ton of money on the sidelines trying to predict a bottom and shorts have to have an itchy trigger finger looking to lock in some great profits in the last few weeks.  There is no doubt that much of today’s rally was due to short covering.  Volume came in lighter than yesterday, so no indication of accumulation by institutions today. 

Much has been made of the VIX in the past few weeks as a bottoming indicator and I’ve certainly had a few emails about whether it’s really all that important.   To that I say yes it’s an important indicator and the fact that more people are watching it makes it even more important, but it is just ONE indicator and a big spike in volatility isn’t required for a bottom, but you do often see a major spike when panic selling kicks in, so it’s something look for.  It did spike a bit on Monday and touched 30 which is getting into an area where fear is escalated, but keep in mind that at major bottoms of the past it has surged as high as 35 – 40 and the volatility trend is still up.  In addition, I just haven’t seen all out panic selling yet, so the potential for one last dramatic move lower is still there.

I’m going to play the market now the exact same way I did off the March bottom.  Begin dabbling on the pull backs with smaller positions than usual.  I will not get more aggressive until a trend of accumulation (high volume buying) and diminished selling emerges.  Considering the major indices kicked off major support levels on Monday I think we are very very close to that, but it is absolutely not the time to add a bunch of long positions.  Patience, patience, patience… there will always be plenty of time to profit and profit big.

Capitulation Averted BUT Prepare For Massive Short Term Rally

What a week, what a Friday.. but we’ve been down this road before.  The constant parade of CEOs and government officials denying there are problems.  The rumors, the manipulation the itchy trigger fingers of traders.  We saw it around the March bottom and one can only hope that we are near the end here at the developing July bottom.  I for one am sick of the irresponsibility of the media in disseminating false information and/or rumors in financial news, but hey anything for a headline right?   It started with the morning headlines that Freddie and Fannie may be bailed out by the government which provided the catalyst for a sustained sell off, but buyers stepped in big after a report from Reuters that Bernanke had provided Freddie and Fannie with access to the discount window (which they later backed down from after the Fed denied such discussions).  As the news drifted to unsubstantiated rumor, much of the gain evaporated, dashing hopes for capitulation.  

Fed spokeswoman Michelle Smith said U.S. central bank officials were following the situation with struggling Fannie Mae and Freddie Mac closely but disputed that access to the discount window had been offered.  "Federal Reserve officials are following the situation closely. However, there has been no discussion with the GSEs about access to the discount window," Smith said in a statement issued on Friday afternoon.

Friday was so darn close to what you could call an important capitulation day, but panic never quite kicked in.  The VIX did come quite close to hitting 30, but the selling was quite orderly throughout.  I really wanted to see a 400 – 500 point move down in the Dow to really flush it out, followed by the kind of buying we saw after the Fed rumor from Reuters.  Friday was a case of both panic selling and institutional buying fizzling out, leaving the market vulnerable to more losses in the short term (perhaps another few percentage points).  However, I do think we are quite close to an intermediate bottom as both the Dow and S&P approach the bottom of their downtrends while the Nasdaq is within shouting distance of the March lows as you’ll see in the charts below.

In the weekly charts of the indices below, the well defined downtrends stand out.. as does the precipitous drop over the past several weeks which is in line with what happened in January.  In the Nasdaq, there is quite a bit of room to run before hitting the bottom of the downtrend, but it does have big support at the March lows just below 2200, so it could certainly hold there and never touch the bottom of the channel again.  So keep an eye out for capitulation in the Nasdaq in the 2175 to 2200 range.
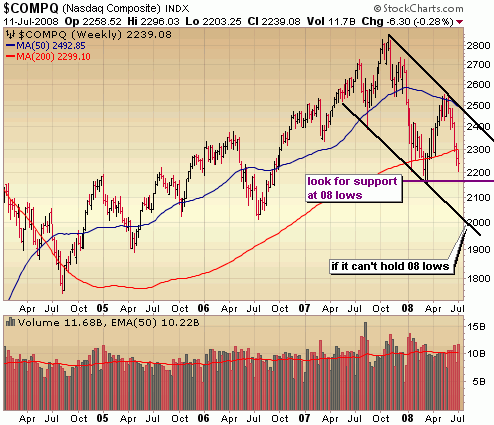
71308_nasdaq

Both the S&P and Dow have taken out the 2008 lows back in March and that really set them up to test the bottom of their downward  trends.  I do think we will get a furious rally if and when the S&P touches that channel around 1200.  So, we’re not quite out of the woods and there is quite a bit of risk of more deterioration, but we’re close.  Hang in there.
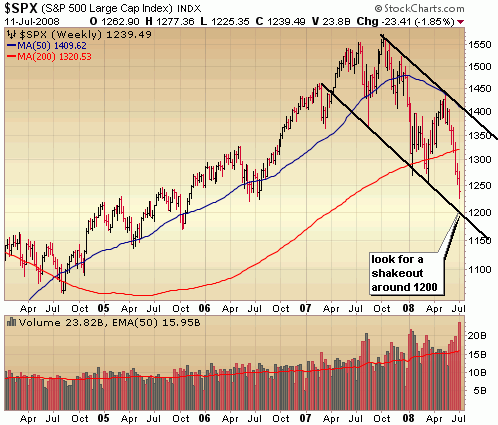
71308_sp500

A similar situation in the Dow as it too approaches the bottom of the downtrend with a nearly vertical drop over the past several weeks.  This dramatic move down will not be sustainable for too much longer and it’s just a matter of time before a short covering fueled snap back rally occurs.  It could happen very soon.  If the Dow takes out 11,000 again, keep an eye on the area around 10700.
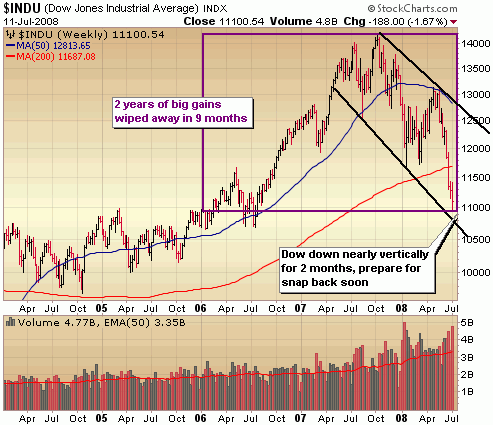
71308_dow

I want to leave you this week with market summary from Don Worden of Telechart.  The man has a way with words and I particularly liked how he summed up Friday’s action (reprinted with permission):

The market opened in a mood that Alan Greenspan might have described as "irrational despondency." At the outset there seemed to be a widespread preoccupation with the delusion that FANNIE MAE and FREDDIE MAC were heading straight for the bankruptcy pits. You don’t need to be an expert to realize that this is an unthinkable scenario (that could create a calamity greater than the great depression) and that the government would take over those two enormous businesses before they would entertain any idea of letting them go under–should it ever become necessary.

It didn’t help a bit when Treasury Secretary Paulson stated that "no bailout of FANNIE MAE and FREDDIE MAC is on the horizon."  Things got worse when somebody spread a rumor that Israel was setting up an air base in Iraq, in preparation for attacking Iran. This was denied promptly and vehemently by American officials, but nobody seemed to believe them. Not for several hours anyway.  Oil responded predictably to this chaotic scene, but it was the stock market that was bombarded most cruelly in this fusillade of frivolous nonsense. 

It seemed there would be no end to it. The world would simply end in one final conflagration. But then suddenly in the afternoon a Reuters source indicated that FANNIE and FREDDIE would have access to the Fed’s discount window. Stocks responded as if rising from the dead. The Dow rose from down 200 to an actual gain. The assurance that capital would be available to the two lenders if they were in dire need softened concern. The stocks rose.

However, wouldn’t you know that a mob scene doesn’t evaporate that easily. The Fed refused to confirm it would lend to Fannie or Freddie. Stocks simply turned around and went back down.  But in contrast to the scuttlebutt that followed, they didn’t go all the way back down. At the close both the Dow and SP-500 had regained close to half of their earlier losses. The Nasdaq Composite had actually regained 76% of it losses. 

The day was not a bust. Two of the Eight Important Averages ended in the black. Only three of the eight closed down over one percent despite the earlier havoc. Nothing closed down two or more percent. Despite the seemingly irreparable devastation earlier, three Breadth Groupings held positive scores.

::: Model Portfolio :::

** This section will now appear as a separate report about every other Wednesday. 

The Self Investors Model Portolio wrapped up 2006 with a gain of 27.6%, 2007 with a gain of 30.2% and is more than 10% ahead of the S&P in a very difficult 2008.  This is a REAL portfolio with position sizing and features annualized returns of 24%.

Would you like to receive buy and sell alerts in the Model Portfolio within minutes (NEW! now get them via instant messaging in near real time) of each transaction?  You can receive these along with ALL of the tracking tools and video reports with the very popular Gold membership.  Don’t delay, get started today and join me for many more highly profitable months here at SelfInvestors.com.

::: Best/Worst Performers :::

– Top 10 Performing Industries For the Week –

1. Diagnostic Substances: 6.70%
2. Aluminum:  6.30%
3. Drug Related Products: 5.70%
4. Silver: 5.05%
5. Home Health Care: 4.50%
6. Chemicals – Major Diversified: 4.50%
7. Cigarettes:  4.15%
8. Agricultural Chemicals: 4.00%
9. Food Wholesale: 3.70%
10. Metal Fabrication: 3.65%

– Top 10 Worst Performing Industries For the Week –

1. Mortgage Investment: -31.50%
2. Toy & Hobby Stores: -12.00%
3. Specialty Retail: -11.75%
4. Resorts & Casinos: -10.80%
5. Lodging: -10.30%
6. Apparel Clothing: -10.15%
7. Banks – SE: -10.05%
8. Office Supplies: -9.70%
9. Investment Brokerage – National: -9.40%
10. REIT – Hotel/Motel: -8.30%

– Top 5 Best Performing ETFs For the Week –

1. Market Vectors Coal (KOL) 7.95% 
2. Claymore China Real Estate (TAO) 7.50%
3. Morgan Stanley China (CAF) 6.53%
4. iShares China (FXI) 5.90%
5. SPDR China (GXC) 5.20%

– Worst 5 Performing ETF’s –

1. US Natural Gas (UNG) -12.20%
2. iShares Broker Dealers -8.35%
3. Dow Jones Home Construction -8.05%
4. SPDR Homebuilders (XHB)  -7.90%
5. SPDR Financials (XLF) -6.50%

::: Upcoming Economic Reports (7/14/2008- 7/18/2008) :::

Monday:        None
Tuesday:       PPI, Retail Sales, Business Inventories
Wednesday:  CPI, Capacity Utilization, Industrial Production, FOMC Minutes, Crude Inventories
Thursday:      Housing/Building Permits, Initial Claims
Friday:           None

::: Earnings I’m Watching This Week :::

Monday: Genentech (DNA)

Tuesday: CoStar Group (CSGP), Intel (INTC), Johnson & Johnson (JNJ)

Wednesday: Ebay (EBAY), Wells Fargo (WFC), Yum Brands (YUM)

Thursday: Danaher (DHR), Evergreen Solar (ESLR), Gilead Sciences (GILD), Google (GOOG), Merrill Lynch (MER), Microsoft (MSFT), SunPower (SPWR), Coca Cola (KO), JP Morgan (JPM)

Friday: Citigroup (C), Schlumberger (SLB)

Boston Scientific (BSX) Provides Good Valuation, But Technically Shaky

The following post is provided exclusively to readers of SelfInvestors.com by the good folks at TheCorrectCall.com.  I agree that medical and drug stocks are showing some resiliency.. some even showing very bullish action, but being a technical trader myself I personally would hold off on Boston Scientific until it gets back above key resistance levels of the 50 and 200 day moving averages.  Perhaps its upcoming earnings report will be just the catalyst to do so. 

:::::::::::::::::::::::

Boston Scientific (BSX) makes a variety of medical devices that are used in several areas of interventional medicine across the globe. The company has three main focus areas: Cardiovascular, Endosurgery, and Neuromodulation.

BSX got some great news recently as its Xience V stent received FDA approval. It is partnering with Abbott Labs on the stent. This could give Boston Scientific a nice shot in the arm as sales of stents have declined lately due to safety concerns. In fact, Fitch raised BSX’s outlook to stable from negative due to its progress in the drug-coated stent market.

The company will report second-quarter earnings on July 22. Analysts are expecting 11 cents per share, which would represent 37% growth over last year’s results. BSX has dramatically exceeded expectations in each of the past three quarters, so it wouldn’t be unreasonable to expect it again. One analyst has raised his estimate just over the past week for this quarter.

We like the company’s valuations at these levels. It is only trading at 1.25x book value, which is a huge discount to several of its peers. Likewise, its price/sales ratio is low at 2.31. It is also changing hands at 18.7x next year’s earnings. This is below its expected growth of 22% for next year. With all of the positive developments, we see the stock at $15 in the next 3-to-6 months.

The timing could be right too. In our weekly review of industry performance and chart analysis, all things healthcare appear to be on the march forward. BSX’s chart reveals limited downside and a reliable buy signal.

Suggested Stop: $11.56

Solar Whacked, Medical Showing Strength, GE Reports Friday

I’m trying to take a bit of time off this weekend so won’t have a detailed look at the market this week but will have an update once normal trading volumes return towards the middle of the week. 

::: Model Portfolio :::

** This section will now appear as a separate report about every other Wednesday. 

The Self Investors Model Portolio wrapped up 2006 with a gain of 27.6%, 2007 with a gain of 30.2% and is more than 10% ahead of the S&P in a very difficult 2008.  This is a REAL portfolio with position sizing and features annualized returns of 24%.

Would you like to receive buy and sell alerts in the Model Portfolio within minutes (NEW! now get them via instant messaging in near real time) of each transaction?  You can receive these along with ALL of the tracking tools and video reports with the very popular Gold membership.  Don’t delay, get started today and join me for many more highly profitable months here at SelfInvestors.com.

::: Best/Worst Performers :::

– Top 10 Performing Industries For the Week –

1. Drug Manufacturers – Major: 4.40%
2. Biotechnology: 3.65%
3. Discount – Variety Stores: 1.85%
4. Auto Parts Wholesale: 1.85%
5. Gold: 1.70%
6. Education & Training Services: 1.65%
7. Long Distance Carriers:  1.60%
8. Drug Manufacturers – Other: 1.35%
9. Medical Instruments & Supplies: 1.10%
10. Telecom Services – Foreign: 1.05%

– Top 10 Worst Performing Industries For the Week –

1. Resorts & Casinos: -16.30%
2. Internet Service Providers: -14.15%
3. Major Airlines: -13.15%
4. Publishing – Periodicals: -13.10%
5. Semiconductor – Memory Chips: -12.75%
6. Auto Dealerships: -11.75%
7. Mortgage Investment: -11.30%
8. Long Term Care Facilities: -11.05%
9. Home Furnishings & Fixtures: -11.05%
10. Semiconductor – Specialized: -10.20%

– Top 5 Best Performing ETFs For the Week –

1. iShares Silver (SLV) 5.75% 
2. HLDRS Biotech (BBH) 4.15%
3. Central Fund of Canada (CEF) 3.80%
4. US Oil Fund (USO) 3.25%
5. SPDR Biotech (XBI) 2.70%

– Worst 5 Performing ETF’s –

1.Claymore Global Solar Energy (TAN) -15.20%
2. Turkish Invest Fund (TKF) -13.60%
3. Greater China Fund (GCH) -13.15%
4. PowerShares Clean Energy (PBW)  -12.15%
5. Market Vectors Coal (KOL) -12.05%

::: Upcoming Economic Reports (7/7/2008- 7/11/2008) :::

Monday:        None
Tuesday:       Wholesale Inventories, Consumer Credit
Wednesday:  Crude Inventories
Thursday:      Initial Claims
Friday:           Export/Import Prices, Trade Balance, Mich Sentiment (prelim), Treasury Budget

::: Earnings I’m Watching This Week :::

Tuesday: Alcoa (AA)

Wednesday: Acergy (ACGY), Shaw Group (SGR)

Friday: General Electric (GE)

Energy Recovery (ERII) IPO Begins Trading

It has been EXTREMELY quiet on the IPO front this year, with the exception of a few standouts such as Visa (V) and Intrepid Potash (IPI).. I’ll throw Colfax (CFX) in there as well considering it’s held up remarkably well during the market meltdown over the past few weeks and is poised to break out of a base.

energy_recoveryerii_IPO Another IPO worth keeping an eye on in the coming weeks that began trading today is Energy Recovery (ERII), a California based company that manufactures devices for better efficiency during the water desalination process.  The company says its PX devices (its core product is the PX Pressure Exchanger) reduce the energy required for desalination by 60%.  It’s a small, but growing company in what will be an industry that will attract quite a bit of attention in the coming years.. the water treatment industry.  Clean, drinking water is one vital resource that is nearly constant in supply (around 3% of total water) and soaring in demand (doubling every 20 years).  Think oil is a problem?  Water will be much more so and the companies leading the initiative to increase supplies of clean drinking water will thrive. 

The stock priced at 8.50 raising 68 million for the company, but opened trading well above that at 11, before ultimately succumbing to overall market pressure, finishing the day more than 10% off the open at 9.83.  As I do with all IPO’s and new ETF’s, I’ll let it trade for at least two weeks to see if it can carve out a bullish technical formation, then get in on any breakout.

Fortunately I don’t need to dive into the detailed analysis here, because a few have already done it so I’ll direct you there.

Jeffrey McLarty of Blue Moat "A Buy At the Right Price"
http://blog.bluemoat.com/?p=221

Zachary Scheidt at Zach Stocks "Good IPO in a Sea of Losses"
http://zachstocks.com/2008/07/energy-recovery-inc-erii-good-ipo-in-a-sea-of-losses/

Big Oil Windfall Profits Tax a Bad Idea

I was catching up on some email tonight and came across a good point made by Steve Sjuggerud of DailyWealth.  He compares the tax rate and profit margins of Microsoft vs Exxon Mobile providing a clear example of why gouging big oil further would be a bad idea and most likely lead to higher prices at the pumps.  This article reprinted with permission.

THE DUMBEST TAX POLICY YOU COULD POSSIBLY SUPPORT

Oil is skyrocketing… and Chevron and Exxon should be making outrageous profit margins. So let’s tax those “windfall” profits! But… hold on a minute…

From March 2007 to March 2008, Exxon’s profit margin was just 10%. Meanwhile, its income tax rate was about 43%.

Compare this with Microsoft: Microsoft’s profit margin was over 28%. And Microsoft’s tax rate was under 30%.


microsoft_exxon_margins

Microsoft makes a much bigger profit margin than Exxon. And it’s taxed way less. Heck, if anyone deserves an “excess profits tax,” it’s Microsoft, not Exxon, right?

Do you think Microsoft’s Office software is outrageously expensive? And if so, is the right solution to tax Microsoft more? Does that fix the problem for consumers?

Right now, people just want to hear that the government is doing something to fix high gas prices. Many people naively believe the gas stations and Big Oil companies like Exxon are gouging them.

But calling for a windfall tax on Big Oil is among the dumbest policies you can possibly support… and there are a lot of dumb ones to consider.

For more on Oil Prices and Oil ETF Trading see our sister site Oil ETF Central

Snap Back Rally?; A Few Bullish ETF Trends – Gold, Nuclear, Agriculture, Japan & More

I took a look at the major indices in detail a few days ago, so in this weekly report I’ll take a look at the latest trends in ETF’s to get an idea of where money is being put to work in this challenging market.  As for the overall market, the odds are increasing for a major snapback rally of 3 – 5% before I believe bears resume control.  In my opinion, being aggressively short down here is a mistake with cash being the best option, while taking advantage of a snap back rally with aggressive day/swing trades on the long side using leveraged ETFs such as DDM, SSO or QLD.  The Dow is reaching oversold levels not seen since the January plunge, so could be the biggest beneficiary of a snap back rally.

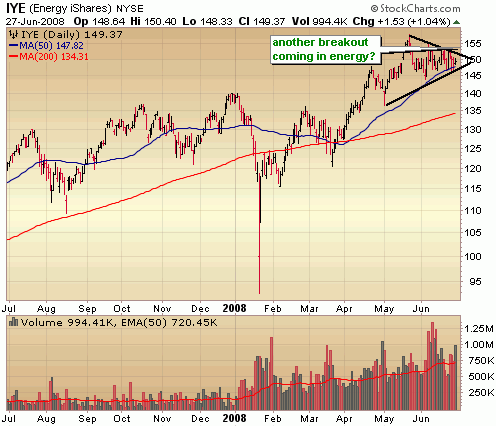
The bull run in energy continues unabated for the time being with the Energy Ishares ETF (IYE) carving out a bullish triangle formation on the daily chart.  A breakout from this formation could signal another upside move in energy stocks.  The US Oil Fund ETF (USO) broke out of a short consolidation last Thursday… so no bearish indications in the oil charts just yet.  However, I continue to hold my Ultra Short Oil & Gas ETF (DUG) for the time being.  It needs to break out above the 50 day moving average and soon.. the longer oil holds up without a significant correction, the greater the likelihood oil will continue pushing higher. 

62908_iye

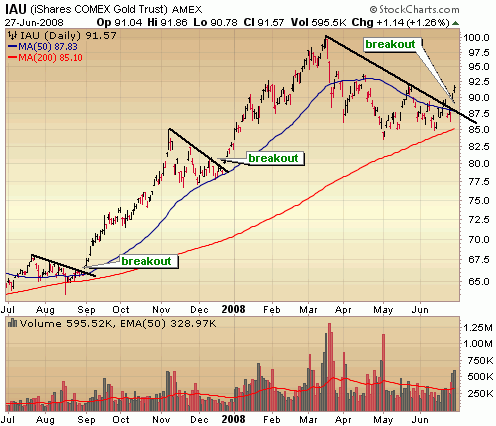
Gold as a long play was discussed here several days ago and it continues to be a top performer.  The iShares Gold Trust ETF (IAU) broke out of a downtrend and looks poised to test all time highs around 100 within the next few months.  If you missed out, be patient.. it should pull back and offer a better entry.  I have been playing gold with the Double Long ETN (DGP) and my top individual play is Yamana Gold (AUY)

62908_iaugold

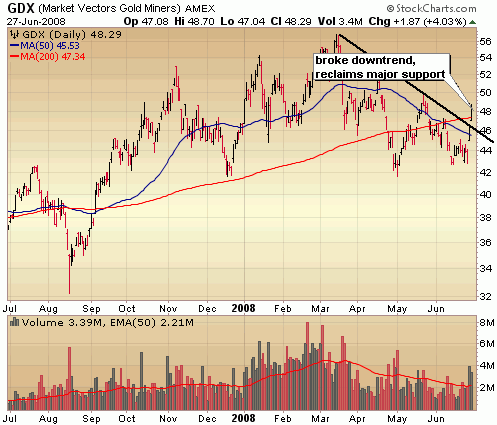
No surprise that the Gold Mining group broke out as well.  Bucyrus Intl (BUCY) is the play here and still looks quite bullish despite already doubling this year.

62908_goldminersgdx

I’ve liked the Market Vectors Nuclear Energy ETF (NLR) for some time now but have been patiently waiting for entry.  I still think we’ll see Uranium/Nuclear join the commodity party particularly if John McCain wins the presidency.  I just want to see price and volume surge a bit out of this handle formation in a double bottom base before initiating a position. 

62908_nlr

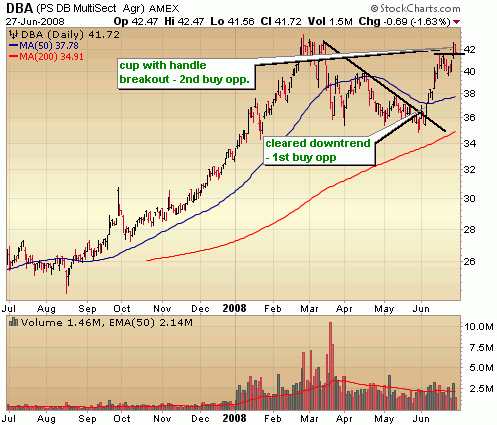
The PowerShares DB Agriculture ETF (DBA) was the hottest ETF in the last months of 07 and carved out a much needed base this year.  It broke out of the downtrend in early June offering an initial entry point, paused briefly for a handle formation and is breaking out again.  This is a fund that seeks a return based largely on the price of sugar, corn, soybeans and wheat.  Expect this fund to do well if Obama, who fully supports ethanol subsidies, wins the presidency.

62908_dba

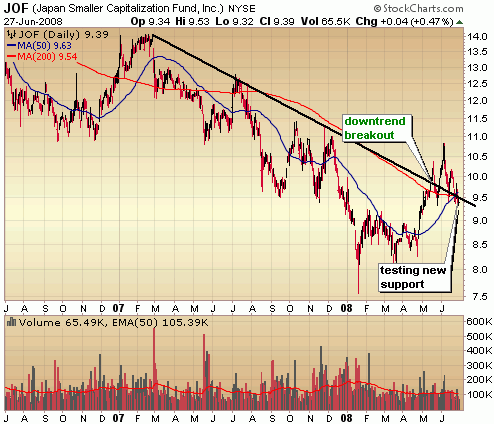
The Japan Small Cap ETF (JOF) looks mighty interesting down here for the patient investor.  It broke a more than one year downtrend in May and has been digesting those gains in a healthy manner, possibly setting up a decent entry as it tests new support.

62908_japanjof

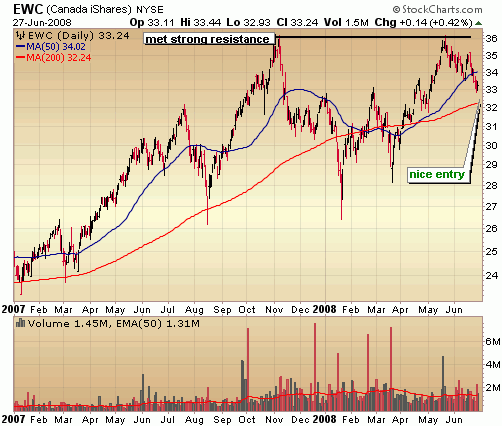
Oh Canada, the beneficiary of surging commodity demand without all the political risk.  The Canada iShares ETF (EWC) met strong resistance at 36 before digesting the big gains off the March lows.  I like the EWC off the 50 dma around 32.

62908_ewc

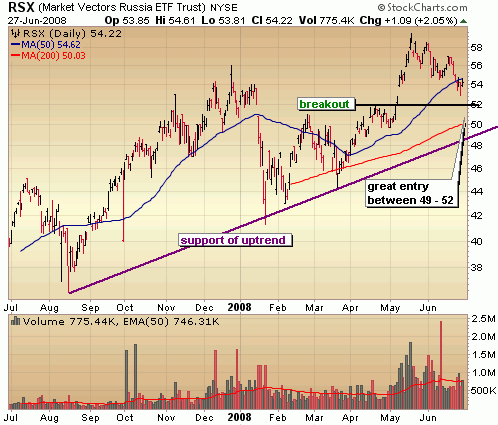
Russia is benefiting from surging oil demand BUT with major POLITICAL RISK.  Much more speculative than the Canada ETF, but with potentially more reward.  The area between 50 (support of upward trend) to 52 (where it broke out in May) is a big support area for the Market Vectors Russia ETF (RSX).  I’d consider a position in this area and hold it as long as it remains above the upward trend line in purple.

62908_rsxrussia

::: Model Portfolio :::

** This section will now appear as a separate report about every other Wednesday. 

The Self Investors Model Portolio wrapped up 2006 with a gain of 27.6%, 2007 with a gain of 30.2% and is more than 10% ahead of the S&P in a very difficult 2008.  This is a REAL portfolio with position sizing and features annualized returns of 24%.

Would you like to receive buy and sell alerts in the Model Portfolio within minutes (NEW! now get them via instant messaging in near real time) of each transaction?  You can receive these along with ALL of the tracking tools and video reports with the very popular Gold membership.  Don’t delay, get started today and join me for many more highly profitable months here at SelfInvestors.com.

::: Best/Worst Performers :::

– Top 10 Performing Industries For the Week –

1. Gold: 9.55%
2. Silver: 6.90%
3. Research Services: 3.25%
4. Oil & Gas Drilling & Exploration: 2.60%
5. Drugs Generic: 2.45%
6. Oil & Gas Equip & Services: 2.10%
7. Photographic Equip & Supplies:  2.10%
8. Drug Delivery: 1.45%
9. Hospitals: 1.40%
10. Computer Based Systems: 1.40%

– Top 10 Worst Performing Industries For the Week –

1. Semis – Memory Chips: -14.25%
2. Trucks & Other Vehicles: -13.35%
3. Surety & Title Insurance: -12.95%
4. Medical Practitioners: -11.65%
5. Mortgage Investment: -11.20%
6. Office Supplies: -10.50%
7. Major Airlines: -10.40%
8. Resorts & Casinos: -10.05%
9. Long Term Care Facilities: -9.20%
10. Sporting Activities: -9.20%

– Top 5 Best Performing ETFs For the Week –

1. Market Vectors Gold Miners (GDX) 10.15% 
2. Asa Gold (ASA) 9.85%
3. US Oil Fund (USO) 4.20%
4. PowerShares Agriculture (DBA) 4.05%
5. PowerShares Commodities (DBC) 3.95%

– Worst 5 Performing ETF’s –

1. iShares Sweden (EWD) -10.20%
2. iShares Belgium (EWK) -9.90%
3. India Fund (IFN) -8.80%
4. iPath India (INP)  -7.85%
5. PowerShares Clean Energy (PBW) -7.40%

::: Upcoming Economic Reports (6/30/2008- 7/4/2008) :::

Monday:        Chicago PMI
Tuesday:       Auto/Truck Sales, Construction Spending, ISM Index
Wednesday:  Crude Inventories, ADP Employment, Factory Orders
Thursday:      Initial Claims, Nonfarm Payrolls, Unemployment Rate, ISM Services 
Friday:           None – Holiday

::: Earnings I’m Watching This Week :::

None this week – earnings season won’t kick off in full force until mid July

Bear Stock Market Strategies: Shorts, Gold, Bonds, Tips & Other "Options"


The following post is provided exclusively to readers of SelfInvestors, courtesy of TheCorrectCall.com.  Some great ideas for safer investing strategies in a bear stock market.  Previously, they recommended a gold trade which I agree with 100%.. I recently added a gold play in the Self Investors Model Portfolio which did quite well yesterday.

:::::::::::::::::::::::::::::::::::::::::::::::::::::::::::::::::::::::::::::::::::::::::::::::::::::::::::::::::::::::::::

"RBS issues global stock and credit crash alert"
"Morgan Stanley warns of ‘catastrophic event’ as ECB fights Federal Reserve"
"Everything seemingly is spinning out of control"

These are some of the alarming headlines that many of our readers and The Correct Call have read recently. Crashes, Catastrophes, Spinning Out of Control. are these Chicken Little warnings? or are dark clouds gathering and about to unleash a withering financial storm?

The truth is we don’t pretend to know one way or the other. It is vital to remain objective and take what the market gives you. The Correct Call takes a top-down approach and sees what the market is saying and invests accordingly. We are not afraid of negativity or overwhelmed by optimism. As a result, we believe there are always great opportunities out there no matter the environment.

That being said, many of our readers have asked us "what can I do to protect my portfolio in this market?" So we did our research looking for investments that have little, no, or negative correlation with US stocks; meaning, investments that don’t necessarily move in tandem with stocks. They have their own free will, so to speak.

We have identified 7 things you can do to protect your portfolio RIGHT NOW!

  1. CASH is KING:
      Don’t be afraid to move some money to the sidelines. Selling losers makes a lot of sense. It can take years for many of these companies to recover. We are still waiting for many of the tech darlings of the late 90’s and early 2000’s "to get back to what we paid for them." How long before Qualcomm gets back to $88, let alone $1000.
      Some of the things you should be looking at to determine which of your stocks are cash candidates include:

        Earnings Misses Bad News Management Shake-Ups Deteriorating Fundamentals Relative to its Peers Desperate for an Infusion of Cash

      Once you have decided which stocks make sense to sell, you might consider matching your loses with some of your gains. Don’t be greedy, eventually today’s winners will give way and be replaced by the next hot thing.
      When the markets – be it Real Estate or Stocks – hit rock bottom, you will need cash on hand to take advantage of these bargains. It is in these discarded investment misfits that triple digit returns will be found.

  2. BUY GOLD:
      Investors worried about mounting losses can possibly stem the tide by adding Gold to their portfolio. According to a study titled "Is Gold a Hedge or a Safe Haven? An Analysis of Stocks, Bonds and Gold" by Dirk G. Baur and Brian M. Lucey, gold is an "ideal venue to park money during periods of uncertainty."
      Their analysis found that in the US, Gold and stock returns are negatively correlated and that Gold acts as a hedge at all times. That means when stocks go down, Gold usually goes up.
      Conservative investors should buy iShares COMEX Gold Trust (IAU), streetTRACKS Gold Trust (GLD) or iShares Silver Trust (SLV). More aggressive investors might consider owning individual stocks or DB Gold Double Long ETN (DGP). DGP’s objective is to give its owners twice the return of Gold’s price changes. With DGP, if Gold moves up 5%, investors can expect see a return of 10%.
  3. INVEST IN TIPS:
      Worried about inflation? You should be, but inflation is negatively correlated to stock. When inflation is on the rise, stocks tend to fall. Here is how you can profit.
      Treasury Inflation-Protected Securities, or TIPS, provide protection against inflation. The principal of a TIPS increases with inflation and decreases with deflation, as measured by the Consumer Price Index. When a TIPS matures, you are paid the adjusted principal or original principal, whichever is greater.
      TIPS pay interest twice a year, at a fixed rate. The rate is applied to the adjusted principal; so, like the principal, interest payments rise with inflation and fall with deflation.
      One of easiest way to invest in TIPS is through iShares Lehman TIPS Bond Fund (TIP).
  4. NON-DOLLAR BONDS:
      Non-dollar denominated bond funds have little correlation with US stock prices. Again, the importance of this is that the performance of foreign currency based bond portfolios and US stocks are unlinked and move up and down for different reasons. International bond exposure should help limit your portfolio’s volatility and preserve purchasing power when the dollar is falling.
      One such no-load fund is the T.Rowe Price International Bond Fund (RPIBX) . The fund’s objective is to provide high current income and capital appreciation by investing primarily in high-quality, non-dollar-denominated bonds outside the U.S. Right now 91.2% of the fund is composed of foreign bonds with more than 80% rated "A" or better.
  5. MANAGED FUTURES:
      Managed Futures accounts are like mutual funds as they pool investors’ money into one portfolio. The portfolio managers have the discretion to invest long or short in futures contracts within equity indexes like the S&P, NASDAQ, & Dow, commodities like soy, corn, coffee, sugar., foreign currencies, and US government bond futures. Most of these accounts rely on proprietary quantitative models, more commonly known as "black box" strategies.
      One of the purported advantages of managed futures is that these accounts have historically exhibited low or even negative correlation with US stocks and are capable of producing gains under any market conditions.
      Some of the drawbacks of these portfolios have been:

        Large initial investment required. Limited liquidity as typically there is a minimum holding period before having the ability to withdraw funds. Very little in the way of information.

      Fortunately, Rydex Funds have solved many of these problems. Starting at just $25,000, investors can now own Rydex Managed Futures Strategy in 3 classes: A Shares (RYMTX), C Shares (RYMZX) and H Shares (RYMFX.)

  6. COVERED CALLS:
      Covered Calls are an options strategy whereby investors who own stock sell call options against that stock. For example, Joe Investor owns 1000 shares of IBM, he writes or sells another investor the right to acquire his shares at a set price, called the strike price, usually on, but sometimes before a specific date, otherwise known as the expiration date.
      For our example, the IBM July 125 Calls are trading at $2.90 per contract. Each contract represents or controls 100 shares of IBM, 10 contracts equals 1000 shares. As a covered call writer, you sell the calls and receive $2,900 (100 * $2.90 * 10 contracts). The $2,900 is deposited into your account.
      Two things can happen when the options expire in July:

        We will start with the worst case scenario. IBM stock goes higher than or equal to $125. In this case, the investor who owns the option will buy it from Joe at $125, but he gets to keep the $2,900. If Joe wants to keep the stock, he will have to buy the options back, known as covering a position. In most cases investors will have to pay more than the premium received when selling the options.
        In the 2nd scenario, IBM stays under $125 per share. In this situation Joe keeps his IBM shares and, if he likes, can sell more options and collect more money.
  7. SHORT ETFs:

    The objective of a short ETF is to go up in value when the underlying index goes down. For example, if the NASDAQ 100 index were to drop 10%, the short NASDAQ 100 ETF would rise 10% in value. Some of these funds offer leverage and produce twice the return of the index.
    ProShares offers a robust offering of both types of short ETFs. For a complete list visit http://www.proshares.com/funds?products=98616&fundType=
    . Keep in mind, when the markets go up, these ETFs WILL LOSE VALUE.

The Correct Call suggests that conservative investors commit up to 10% of their entire portfolio to a mix of these strategies. More aggressive types can allocate closer to 30% of their equity holdings into these hedges.

Market Carving Out Double Bottom? Need a Spike in VIX

I have to admit, today’s move caught me a bit off guard.  I was looking for some kind of dead cat bounce from oversold levels and a big washout once earnings began pouring in and traders returned from the July 4th holiday.  The market awaits nobody!  I mentioned to members last night that you can throw out the trading action on the day of the Fed.  It’s in the day or two after the announcement that is most important as traders digest the words of the Fed and construct their trading strategies for the month ahead.  Apparently, the consensus strategy was to sell, sell, sell!

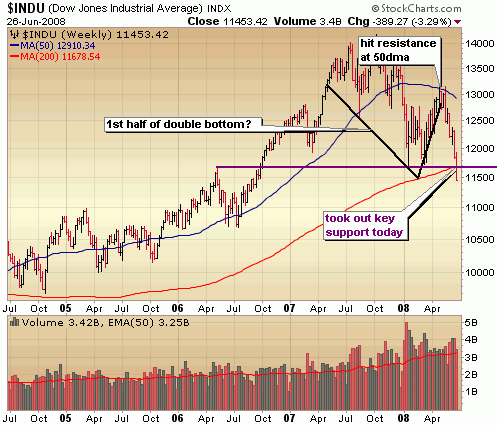
Today was a defining move particularly for the Dow, which busted through the March lows which also happens to be support at the old all time highs.  I know, I know.. here come the emails that say the Dow doesn’t matter.  Yes, it’s not a good representative of the market, BUT it is a HEADLINE number.  It’s the number that Joe Schmo sees when he comes home from work on the evening news, so it does matter.  Hopefully Joe Schmo has heeded my advice this year to stay the heck out of this market or be fully hedged.  Either way, you my friend are sitting darn purdy here.. flush with cash and ready to pounce when a new bull market emerges.

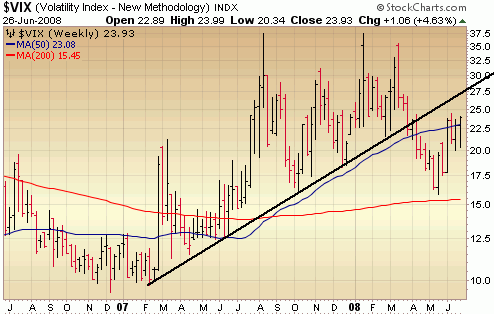
Ah but first things first.  This is a big, bad bear market with not a bull in sight.  Let’s take a look at the charts to get a sense of where we might be headed next… but before I do let me be very clear:  this is no time to be a knife catcher nor a hero trying to pick a bottom.  Before that can happen we need a spike in the volatility index (VIX) followed by massive capitulation.  Here’s a look at the VIX which could hit resistance around 28 and market a bottom.  You see it broke the up trend of 2007 following that March low, so could be settling down.  Watch the VIX (potentially tomorrow) should it test what is now resistance of that up trend line around 28 – 30.

62608_volatilityVIX

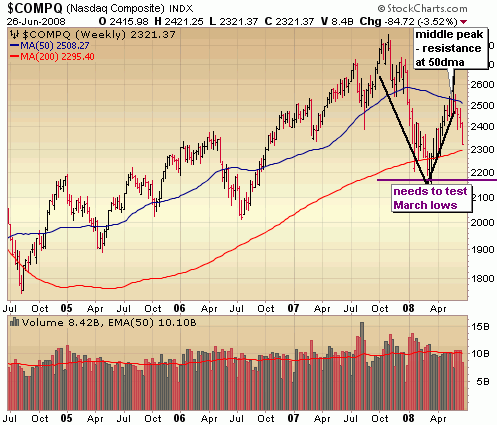
The Nasdaq could get a snap back rally after touching 2300, but ultimately it will need to come down and test those March lows, potentially carving out the 2nd leg down of a double bottom base. 

62608_nasdaq1

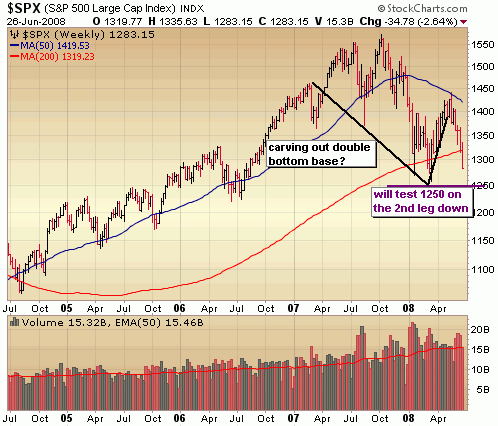
Note the potential for a double bottom base in the S&P as well but remember that the 2nd leg down often undercuts the first leg down, shaking out the last of the weak holders.  So, while 1250 – 1260 is strong support around the March lows, it may take a breach of that level to really drive the fear and get the VIX up in 30 range. 

62608_sp5001

I didn’t annotate it out in the S&P and Naz but if you’re new to chart reading or believe the charts don’t matter I want you to take a look at the rise off the March bottom and run to that 50 day moving average in blue on all the indices.  It’s absolutely no coincidence that the market failed at that point.  Zero, zilch.  Now think about all the "professionals" on CNBC or other entertainment (I mean news..) outlets that said the economy isn’t so bad and now is a great time to buy.  If just one person reads this report tonight, begins to turn off Cramer and think for themselves based on simple chart analysis then I’m happy.

62608_dow1

Please continue to be careful out there.  My recommendation remains the same.. stay on the sidelines or fully hedged.   Although fully hedged is becoming more of a risk down here, so moving more to cash is the best option right now.  Good night and good trading.