The Fed induced capitulation gave way to a quick ramp up in the market off an oversold bottom but it didn’t long for traders to lock in profits as poor economic news poured in. Just as the conviction behind buying levels reveals much about the health of the overall market, the conviction behind the selling does the same.
The technical action last week was encouraging. Some fear crept back into the market on Tuesday’s nearly 400 point Dow plunge, but as I mentioned in the after market report that day, there was a divergence between price and volume. The selling intensity was not characteristic of institutions dumping positions left and right. To me, it looked like healthy selling following, a V like spike up off the bottom. Notice that over the next 3 days, the market stopped the bleeding almost immediately despite a significant futures sell off following a poor Cisco outlook. That action on Thursday was a good indication that maybe buyers are beginning to return. I remember reading all the doom and gloom regarding Cisco on some of the discussion boards with calls for a drop below 20. Cisco closed in the green for the day with a massive day of capitulation. It was significant for Cisco, for tech and the Nasdaq in general.
Let’s take a quick look at the charts….
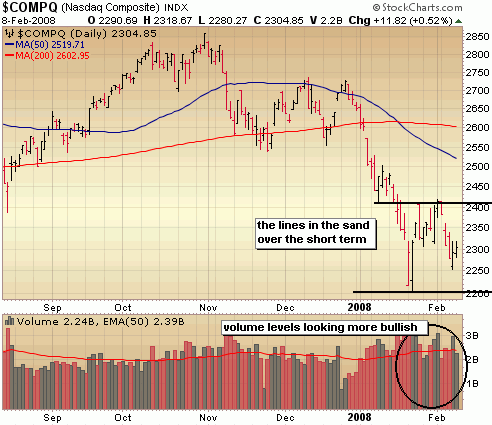
The Nasdaq looks mighty close to bottoming, but if in fact that is the case we need to get some big buying follow through soon. That revesal off the lows on Thursday with heavy volume was in my mind a telling sign that bulls are resuming some control at least in the short term. I do believe that the odds of a rally here are significantly greater than another leg down below key support of 2200 but much risk remains. This is still a headline driven market with no leadership. Keep that in mind when making trading decisions. If the Nasdaq can take out 2425, look for a run to 2500.

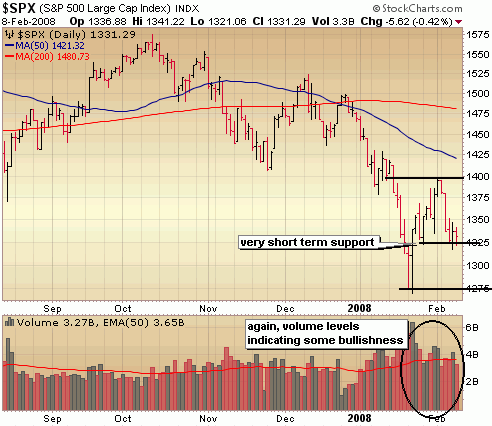
I like the healthy retracement of the initial surge off the bottom. Notice that buy volume has been overshadowing sell volume. There is short term support in the S&P at 1325 so taking out that level and closing below that level would indicate that a test of the lows around 1275 are likely. Again, I think big buying needs to happen quickly (sometime next week) or testing the lows of this correction (or worse) becomes much more likely.

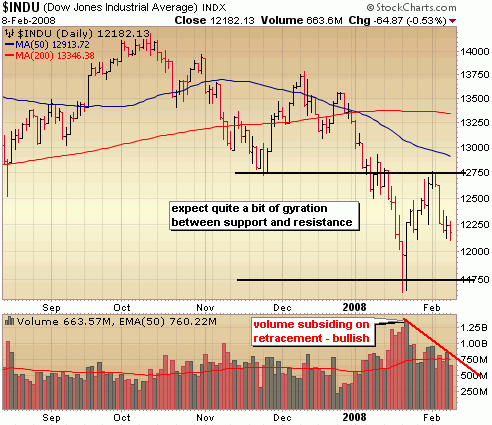
You see the Dow is about at the half way point of a retracement as well and could very well yo yo back and forth between support and resistance as the market sorts out a bottom down here. Volume levels do indicate more bullishness, but institutions need to step in and start doing some buying soon or we’re testing the lows around 11500 – 11750.

::: Model Portfolio :::
** This section will now appear as a separate report to be published on most Wednesdays.
The Self Investors Model Portolio wrapped up 2007 with a 30.2% gain. Would you like to receive buy and sell alerts within minutes (NEW! now get them via instant messaging in near real time) of each transaction in the portfolio? You can receive these along with ALL of the tracking tools and reports with the very popular Gold membership. Don’t delay, get started today and join me for many more highly profitable months here at SelfInvestors.com.
::: Best/Worst Performers :::
– Top 10 Performing Industries For the Week –
1. Wholesale – Other: 2.75%
2. Medical Laboratories & Research: 2.55%
3. Medical Practitioners: 2.30%
4. Home Health Care: 2.05%
5. Drug Related Products: 1.50%
6. Drug Delivery: 1.10%
7. Entertainment Diversified: .85%
8. Medical Instruments & Supplies: .65%
9. Medical Equipment Wholesale: .35%
10. Independent Oil & Gas: .25%
– Top 10 Worst Performing Industries For the Week –
1. Semiconductor – Memory Chips: -15.35%
2. Residential Construction: -14.45%
3. Credit Services: -11.05%
4. Recreational Vehicles: -10.70%
5. Banks – SE: -10.25%
6. Toy & Hobby Stores: -10.05%
7. Heavy Construction: -9.90%
8. Cement: -9.55%
9. Home Furnishing Stores: -9.20%
10. Farm Products: -9.10%
– Top 5 Best Performing ETFs For the Week –
1. US Natural Gas (UNG) 7.50%
2. Powershares Agriculture (DBA) 4.80%
3. Powershares Commodity (DBC) 4.70%
4. US Oil (USO) 3.45%
5. Ishares Silver (SLV) 2.45%
– Worst 5 Performing ETF’s –
1. SPDR Homebuilders (XHB) -14.60%
2. Ishares Home Construction (ITB) -12.60%
3.
4. Market Vectors Global Alernative Energy (GEX) -10.10%
5.
This section will now appear as a separate post on Mondays.
While 2008 should be a much slower year for IPO’s considering the deterioration of the market, there will continue to be some good companies coming to market here and there. I’ll be highlighting the best IPO’s every Monday.
::: Upcoming Economic Reports (
Monday: None
Tuesday: Treasury Budget
Wednesday: Retail Sales, Business Inventories, Crude Inventories
Thursday: Trade Balance, Initial Claims
Friday: Export/Import Prices, Capacity Utilization, Industrial Production,
::: Earnings I’m Watching This Week :::
Monday:
Qiagen (QGEN)
Tuesday:
Rick’s Cabaret (RICK)
Wednesday:
Nvidia (NVDA), First Solar (FSLR), The Navigators (NAVG), Baidu.com (BIDU), Healthcare Services Group (HCSG), Genzyme (GENZ), Rio Tinto (RTP), Millicom Intl (MICC)
Thursday:
Bucyrus (BUCY), Capella Education (CPLA), Chipotle Mexican Grill (CMG), Strayer Education (STRA), Hittite Microwave (HITT)
Friday:
Abercrombie and Fitch (ANF), Diana Shipping (DSX), Yingli Green Energy (YGE)
::: In Case You Missed It – SelfInvestors Blog Entries of the Past Week :::
1. Not So Super Tuesday But Selling Constructive
2. Solera Holdings (SLH) One To Watch After Strong Earnings
3. Model Portfolio Update: Big Tech Is Killing Me
4. WMS Industries (WMS) Breaks out to All Time Highs On Earnings
5. China Oil Perspective – CNOOC (CEO), Petrochina (PTR) & China Petroleum (SNP)