Well, those battle tested bulls were able to hold the line for another week and even showed a bit of life at the end of the week, rallying in hope and anticipation that Super Geithner will swoop in and save the day Monday with his bank band-aides. Let’s just keep in mind what has happened in the past following these government initiatives.. the euphoria wears off in a hurry.
Whether that happens this time around remains to be seen, but for now the indices maintain critical support levels but still confined within bearish descending triangles with much overhead resistance to contend with. The song remains the same in this market: don’t chase rallies and only buy on pull backs. If in fact this market rallies again either before, during or soon after the Geithner press conference (update: it looks like this may be delayed until Tuesday), do avoid chasing it!
Let’s jump into the charts. …
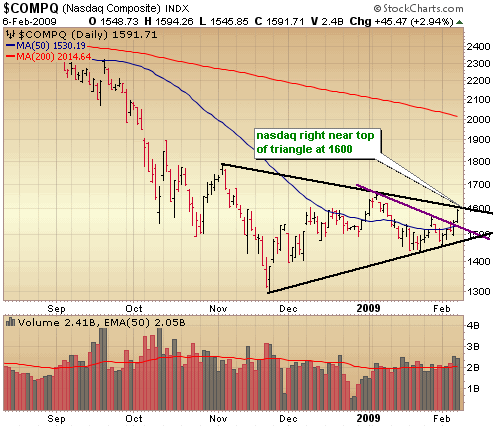
How about that Nasdaq showing some green for the year! It moved into positive territory after breaking out above the 50 day moving average again with some decent volume. I have to say the indices look better right here than at any point over the past 6 months, but we are not out of the woods just yet. We’ll have to keep an eye on the developing descending triangles forming in the indices. Watch the 1600 – 1610 level in the Nasdaq in the coming days which will be a very important level of resistance. Even if it clears that level and holds soon, it’s come too far too fast. You want to build long positions on the pull backs.. that’s so important in this market.
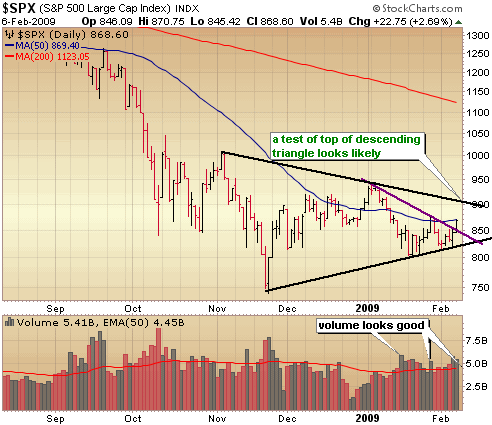
The S&P500 still needs to convincingly clear the 50 day moving average before we can begin talking about the top of the triangle at 900. If it can come up and test that level and I think there is a very good chance of doing so, we’ll be overbought so I’ll likely be sounding the caution alarm at that point.
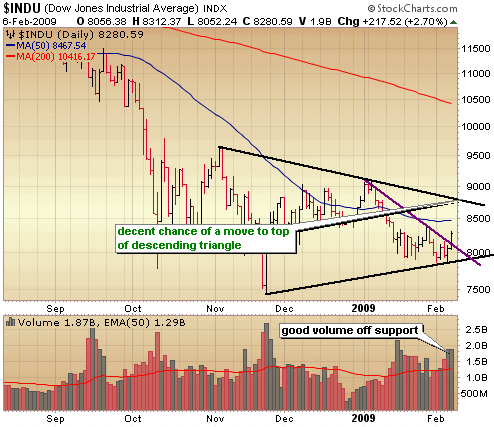
The Dow barely held on to key support last week and after that day of distribution on Wednesday I thought the market could be in a bit of trouble, but once again bulls held the line and kept support intact for now. Good volume off support which should be enough to at least get the Dow up to the 50 day moving average soon and possibly join the Nasdaq and S&P in testing the top of the descending triangle around 8750
::: Model Portfolio :::
** This section will now appear as a separate report about every other Wednesday.
The Self Investors Model Portfolio wrapped up 2006 with a gain of 27.6%, 2007 with a gain of 30.2%, finished nearly 35% ahead of the S&P in a very difficult 2008 and is off to a great start here in 2009, ahead of the S&P by 6%. This is a REAL portfolio with position sizing and not based on extrapolated hypothetical gains for each trade. On average it beats the S&P by 20% per year.
Would you like to receive buy and sell alerts in the Model Portfolio within minutes (NEW! now get them via instant messaging in near real time) of each transaction? You can receive these along with ALL of the tracking tools and video reports with the very popular Gold membership. Don’t delay, get started today and join me for many more highly profitable months here at SelfInvestors.com.
::: Best/Worst Performers :::
– Top 10 Performing Industries For the Week –
1. Steel & Iron: 22.70%
2. Residential Construction: 21.40%
3. Surety & Title Insurance: 17.55%
5. Industrial Metals & Minerals: 16.35%
6. Sporting Goods Stores: 16.10%
8. Banks – SE: 15.90%
9. Copper: 14.55%
10. Agricultural Chemicals: 14.55%
– Top 10 Worst Performing Industries For the Week –
1. REIT – Residential: -8.20%
2. Insurance Brokers: -4.95%
3. Silver: -4.50%
4. Paper & Paper Products: -4.20%
5. Resorts & Casinos: -4.15%
6. Waste Management: -3.60%
7. Food – Major Diversified: -3.15%
8. Toys & Games: -2.60%
9. REIT – Hotel/Motel: -2.25%
10. Aerospace/Defense: -1.95%
– Top 5 Best Performing ETFs For the Week –
(excluding leveraged ETFs)
1. Market Vectors Steel (SLX) 21.85%
2. Greater China Fund (GCH) 18.95%
3. iShares Home Construction (ITB) 17.50%
4. SPDR Homebuilders (XHB) 16.35%
5. Market Vectors Coal (KOL) 14.30%
– Worst 5 Performing ETF’s –
1. US Oil Fund (USO) -3.50%
2. iShares Gold (IAU) -1.90%
3. SPDR Gold (GLD) -1.90%
4. iShares Switzerland (EWL) -1.85%
5. Morgan Stanley Frontier Markets (FFD) -1.80%
::: Upcoming Economic Reports (2/9/2009- 2/13/2009) :::
Monday: None
Tuesday: Wholesale Inventories
Wednesday: Treasury Budget, Crude Inventories
Thursday: Retail Sales, Initial Claims
Friday: Mich Sentiment – Prel
::: Earnings I’m Watching This Week :::
Monday: Beazer Homes (BZH), Chindex Intl (CHDX), Ctrip.com (CTRP), Energy Conversion (ENER), Sohu.com (SOHU)
Tuesday: Aecom (ACM), Applied Materials (AMAT), Female Health (FHC), Intercontinental Exchange (ICE), Terra Industries (TRA), Terra Nitrogen (TNH), Yingli Green Energy (YGE)
Wednesday: Chipotle Mexican Grill (CMG), Compellent Technologies (CML), COMSCORE (SCOR), Core Laboratories (CLB), Genzyme (GENZ), Toll Brothers (TOL)
Thursday: ABB (ABB), AsiaInfo Holdings (ASIA), BigBand Networks (BBND), Capella Education (CPLA), Constant Contact (CTCT), Strayer Eduction (STRA)
Friday: Cameco (CCJ), Cognizant Technologies (CTSH)


