The theme for this week was a return to resiliency. We began to see good resiliency in the market back in December despite the constant barrage of negative news and managed to attack the 50 day moving average 3 times, eventually pushing significantly above at the tail end of 08. The oversold conditions set the market up for a profit taking situation but as the financials began to fall apart again, traders took profits… and took profits.. as the indices find themselves once again submerged below key resistance of their 50 day moving averages.
I’ll call last week’s trading resilient stabilization. The market didn’t go anywhere, but let’s keep in mind that despite a 350 point plunge on inauguration day the market was unable to follow through and quickly bounced back above support. The next 3 days, the market sold off in the morning to key support levels and held each time, staging healthy rallies. This despite another financials free fall, awful earnings from Microsoft and GE as well as an avalanche of job losses.
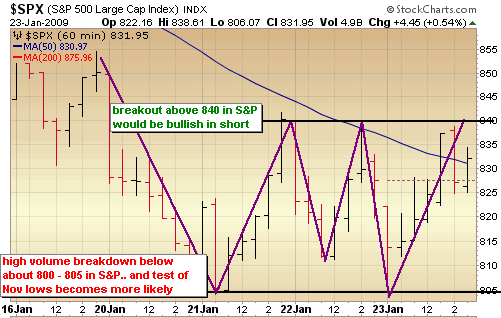
Now the end result was essentially running in place, but the resilience is impressive and I think it gives us a decent shot at a new leg up in this market. Am I making a big bet that way? Absolutely not. I’m not making large bets either way until we get a big break either way. Take a look at the hourly chart of the S&P below. The lines in the sand in the shorter term are clear. If we break above 840 with big volume, a test of the 50 day moving average becomes likely. If we break the 800 level with volume, that sets us up for a retest of the November lows. It really could go either way, but I’ll give a slight edge to the bulls here and call a 55% chance of breaking up and 45% of breaking down, but wait for the market to tell you how to trade.
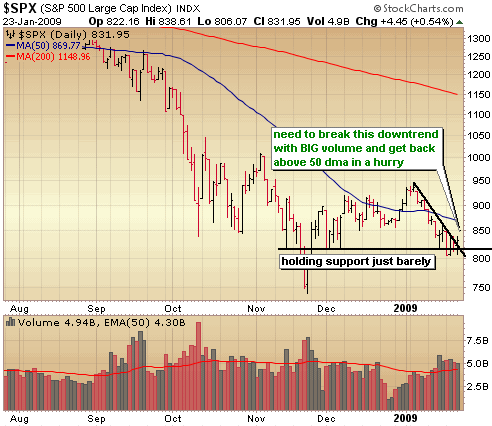
On the daily chart of the S&P500, you notice the see saw action last week as the market clinged to support. Next week, we need to get moving and in a big way. The longer we remain submerged below those 50 day moving averages the greater the likelihood that the November lows will be tested. Trade cautiously on the long side until we get a high volume move up from here and you better get hedged or move to cash if we close below S&P 800. Good luck next week.
I’ll leave you with one more chart .. here is a chart courtesy of Telechart which shows the percentage of stocks above the 200 day moving average dating back to 1987. Not since the crash of 87 have there been so few stocks above the 200 day moving average. Only 6.5% of stocks are currently above the 200 day moving average. Compare that to the absolute bottom of the tech crash in 2002 when about 18% of stocks were above the 200 day moving average. Now, of course these are unprecedented economic times we live in but you can’t help but notice that history shows a big recovery in the number of stocks getting above their 200 day moving averages when we get down to these levels. It’s certainly possible this market flushes out again to shake out a few more, but prepare for a massive relief rally sometime in the next few months.
::: Model Portfolio :::
** This section will now appear as a separate report about every other Wednesday.
The Self Investors Model Portfolio wrapped up 2006 with a gain of 27.6%, 2007 with a gain of 30.2%, finished nearly 35% ahead of the S&P in a very difficult 2008 and is off to a great start here in 2009, ahead of the S&P by 6%. This is a REAL portfolio with position sizing and features annualized returns of 24%.
Would you like to receive buy and sell alerts in the Model Portfolio within minutes (NEW! now get them via instant messaging in near real time) of each transaction? You can receive these along with ALL of the tracking tools and video reports with the very popular Gold membership. Don’t delay, get started today and join me for many more highly profitable months here at SelfInvestors.com.
::: Best/Worst Performers :::
– Top 10 Performing Industries For the Week –
1. Silver: 19.30%
2. Gold: 13.80%
3. Health Care Plans: 9.65%
5. Nonmetallic Minerals & Metals: 8.25%
6. Semis – Memory Chips: 6.45%
7. Farm Products: 4.60%
8. Electronic Stores: 4.45%
9. Information Technology Services: 4.05%
10. Metal Fabrication: 3.90%
– Top 10 Worst Performing Industries For the Week –
1. Banks – NE: -21.20%
2. Jewelry Stores: -16.25%
3. Accident & Health Insurance: -15.05%
4. Office Supplies: -14.85%
5. Recreational Goods: -13.40%
6. Banks – Money Center: -13.20%
7. Banks – Pacific: -11.75%
8. Recreational Vehicles: -11.60%
9. Banks – Midwest: -11.60%
10. Medical Practitioners: -11.50%
– Top 5 Best Performing ETFs For the Week –
(excluding leveraged ETFs)
1. Market Vector Gold Miners (GDX) 17.20%
2. iShares Silver (SLV) 13.00%
3. Templeton Russia (TRF) 10.65%
4. PowerShares Precious Metals (DBP) 10.60%
5. Asa Gold (ASA) 10.40%
– Worst 5 Performing ETF’s –
1. Korea Fund (KF) -20.15%
2. HLDRS Regional Banks (RKH) -16.40%
3. SPDR Trust Series (KBE) -13.65%
4. Morgan Stanley Frontier Markets (FFD) -10.20%
5. SPDR Financials (XLF) -9.90%
::: Upcoming Economic Reports (1/26/2009- 1/30/2009) :::
Monday: Existing Home Sales, Leading Indicators
Tuesday: Consumer Confidence
Wednesday: Fed Rate Decision, Crude Inventories
Thursday: Durable Orders, New Home Sales, Initial Claims
Friday: GDP, Chicago PMI
::: Earnings I’m Watching This Week :::
Monday: Amgen (AMGN), American Express (AXP), Caterpillar (CAT), McDonald’s (MCD), Steel Dynamics (STLD), Weatherford (WFT)
Tuesday: Bristol Myers Squibb (BMY), Devry (DV), EMC Corp (EMC), FPL Group (FPL), Gilead Sciences (GILD), Jacobs Engineering (JEC), Nuecor (NUE), St Jude Medical (STJ), Stryker (SYK), Vistaprint (VPRT), Yahoo (YHOO)
Wednesday: Green Mountain Coffee Roasters (GMCR), Murphy Oil (MUR), Qualcomm (QCOM), Ryland Group (RYL), Starbucks (SBUX), Wells Fargo (WFC)
Thursday: 3Par (PAR), 3M (MMM), Altria Group (MO), Amazon (AMZN), Broadcom (BRCM), Celgene (CELG), Cybersource (CYBS), Ford (F), Starent Networks (STAR)
Friday: Arch Coal (ACI), Exxon Mobile (XOM), Honda (HMC), Proctor & Gamble (PG)


