I’m back! After more than a week in beautiful Troncones, Mexico I’m ready to get back to work and recharged for the coming year! While I was away the market worked off overbought conditions in a way that was .. I’d say a bit less than healthy as the indices broke through support of the 50 day moving averages with increasing sell volume. I really wanted to see the indices work off overbought conditions by trading somewhat sideways along the 50 day moving average, but traders clearly wanted to lock in profits after a nearly 30% move up offer the late Nov lows.
The action didn’t look good heading into late Thursday morning. We got a big distribution day on Wednesday, sending the indices convincingly below their 50 day moving averages with a continuation of that downward pressure Thursday morning. However, with the market getting into very oversold levels and the Dow down 7 straight days, it was time for a bounce ..
and bounce we did as details of the release of the 2nd round of TARP funds and the Obama stimulus plan emerged. The market staged a nice recovery in the latter half of the day with very good volume which may have signaled the beginning of a new leg up.
I’ve got much to do to get caught up this weekend, so I’ll keep it brief this week and move right into the charts. Let’s have a look at the S&P500 below.
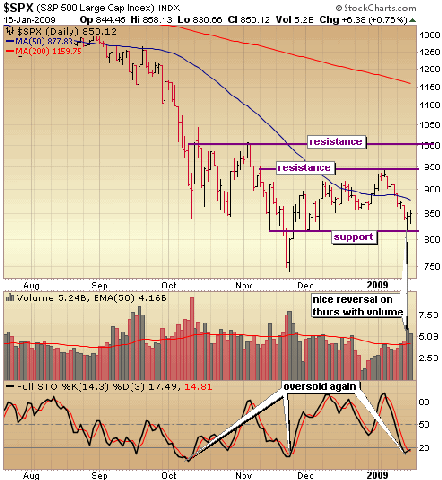
Notice the S&P cleared the 50 day moving average (in blue) in late December/early Jan but with light holiday trading volume. Also notice stochastics (in the bottom pane) revealing overbought conditions as traders began to get back to work. The conditions were ripe for profit taking and take profits they did. The indices sold off more than 10% in less than two weeks and once again took out the 50 day moving average as sell volume picked up. Not exactly the kind of orderly profit taking I wanted to see, but perhaps it clears the way for a more sustained move up. First things first though. We have to get back above that 50 day moving average and do so relatively soon. Last Thursday was a good start with the key reversal and close near the highs of the day with volume, but now we need confirmation of that move with a big volume up day. Thursday’s low is the new line in the sand for support. If we take that level out, all bullish bets are off with a test of the absolute lows likely.
I believe we’ll hold Thursday’s low and possibly make a run to test S&P 1000 before this market falls apart again. We’re now as oversold as we were at the November and October lows and the indices are in much better technical shape this time around. Hence, my bullish bias as we begin the Obama era.
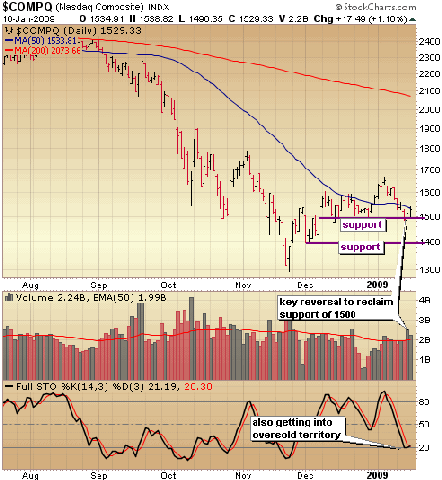
Tech is beginning to look increasingly attractive to me for a swing trade, but a big hurdle for tech is coming this week with earnings out of IBM, Apple, Microsoft and Google. If the Nasdaq can close next week above the 50 day moving average that would be mighty bullish in my opinion. Keep an eye on Nasdaq 1500 which is an important short term support level. If close below that level with big volume, the Nasdaq is headed for a retest of 1400, so we need to hold there and quickly get back above the 50 day moving average which it tested on Friday.
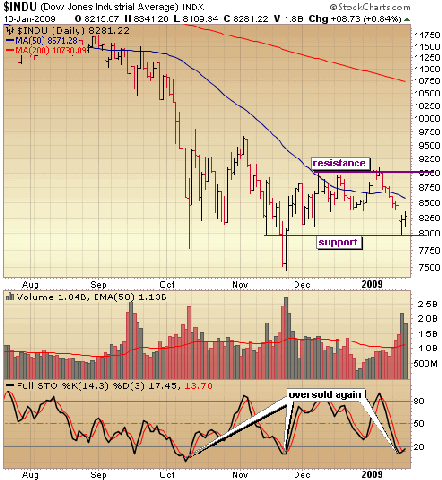
The Dow took out several important short term support levels last week before finding a floor at 8000 which will remain a very important level of support. If we close below that level on any particular day, we could be in for another retest or possible breach of the lows of the correction around 7500. I believe that with the magnitude of Thursday’s reversal in conjunction with oversold conditions, we begin to move higher once again. How quickly we move higher and the amount of volume behind the moves higher will ultimately determine the strength of this current market. If buy volume is weak and the Dow has trouble getting back above the 50 day moving average, be very careful on the long side.
So to summarize, I’m without a doubt leaning to the bullish side following last weeks pullback due to Thursday’s key reversal day and oversold conditions. However, I remain somewhat cautious until we can get back above the 50 day moving averages. In my last report I mentioned I had been adding some long exposure to the Self Investors Model Portfolio but would hold off on adding more until I saw how the big fellas traded in the New Year.
“While I am increasingly bullish and have added additional long exposure, I’m still only about 30% net long in the portfolio. I probably won’t increase my long exposure too much until traders return from vacation next week. How this market reacts in the first few days of next week will be very important. If the bullish action of late yesterday and today remains, I may increase my long exposure to 60 – 70%.”
I didn’t increase long exposure at all during this latest pull back because volume increased on the sell side and support of the 50 dma was wiped out again. It wasn’t until late last week when the indices began hitting oversold levels that I added a bit more long exposure, pushing my net long exposure to around 35%. If we get a big confirmation move soon, I will be looking to get that to around 60%
::: Model Portfolio :::
** This section will now appear as a separate report about every other Wednesday.
The Self Investors Model Portfolio wrapped up 2006 with a gain of 27.6%, 2007 with a gain of 30.2%, finished nearly 35% ahead of the S&P in a very difficult 2008 and is off to a great start here in 2009, ahead of the S&P by 6%. This is a REAL portfolio with position sizing and features annualized returns of 24%.
Would you like to receive buy and sell alerts in the Model Portfolio within minutes (NEW! now get them via instant messaging in near real time) of each transaction? You can receive these along with ALL of the tracking tools and video reports with the very popular Gold membership. Don’t delay, get started today and join me for many more highly profitable months here at SelfInvestors.com.
::: Best/Worst Performers :::
– Top 10 Performing Industries For the Week –
1. REIT – Healthcare Facilities: 7.95%
2. Education & Training Services: 7.45%
3. Consumer Services: 6.80%
5. REIT – Residential: 6.70%
6. Diagnostic Substances: 5.25%
7. Drug Stores: 4.60%
8. Computer Based Systems: 4.45%
9. Scientific & Technical Instruments: 3.95%
10. Healthcare Information Service: 3.55%
– Top 10 Worst Performing Industries For the Week –
1. Information Technology Service: -22.50%
2. Toy & Hobby Stores: -21.70%
3. Money Center Banks: -15.70%
4. Banks – Midwest: -12.70%
5. Railroads: -12.25%
6. Air Services – Other: -12.20%
7. Recreational Vehicles: -10.40%
8. Resorts & Casinos: -10.00%
9. Banks – Mid Atlantic: -9.90%
10. Aluminum: -9.55%
– Top 5 Best Performing ETFs For the Week –
(excluding leveraged ETFs)
1. Herzfeld Caribbean Basin (CUBA) 9.55%
2. iShares US Medical Devices (IHI) 5.10%
3. Chile Fund (CH) 4.25%
4. PowerShares Dynamic Biotech (PBE) 4.05%
5. Morgan Stanley India (IIF) 2.55%
– Worst 5 Performing ETF’s –
1. SPDR Series Trust (KBE) -20.70%
2. Market Vectors Russia (RSX) -18.80%
3. HLDRS Regional Banks (RKH) -18.40%
4. Templeton Russia & East Europe (TRF) -18.30%
5. SPDR Financials (XLF) -16.25%
::: Upcoming Economic Reports (1/19/2009- 1/23/2009) :::
Monday: Market Closed
Tuesday: None
Wednesday: Crude Inventories
Thursday: Building Permits, Housing Starts, Initial Claims
Friday: None
::: Earnings I’m Watching This Week :::
Tuesday: Cree Inc (CREE), Johnson & Johnson (JNJ), IBM, New Oriental Education (EDU), Petmed Express (PETS)
Wednesday: Apple Computer (AAPL), CNH Global (CNH), Ebay (EBAY), Hudson City Bancorp (HCBK), NVE Corp (NVEC)
Thursday: Google (GOOG), Ezcorp (EZPW), ITT Educational (ESI), Intuitive Surgical (ISRG), MEMC Electronic Materials (WFR), Microsoft (MSFT), Potash (POT), Synaptics (SYNA), Teledyne Tech (TDY), Zoll Medical (ZOLL)
Friday: General Electric (GE), Schlumberger (SLB)