After any sustained move in the market up or down, I get a bit more hyper vigilant about looking for clues that the trend is about to change, at least in the short term. That always begins with a read of the charts.. a trust in what the technicals are telling me. This certainly goes along with my previous post about mastering emotions when trading – the more mechanical and technical you are, the less likely your emotions will influence your trading decisions. I sent the following note to registered members of SelfInvestors.com over the weekend (you can sign up for these weekend and after market reports with your email address on the home page if you’d like) discussing this:
Focusing On the Charts, Not on Opinion
"Following a lengthy market run (or sell off) like the one we’ve had over the past couple months (which is rivaling the run off the market bottom back in ’03) I tend to get a little defensive and begin looking for any clues that the run is over, at least in the short term. Those clues come in the form of technical analysis and only technical analysis. In fact it’s during these times I try to read less about the various opinions on what the market will do and focus more on what the charts are indicating. Granted, for those of us who are technical analysts or "chartists" it’s not always easy to trust the charts, but essential.
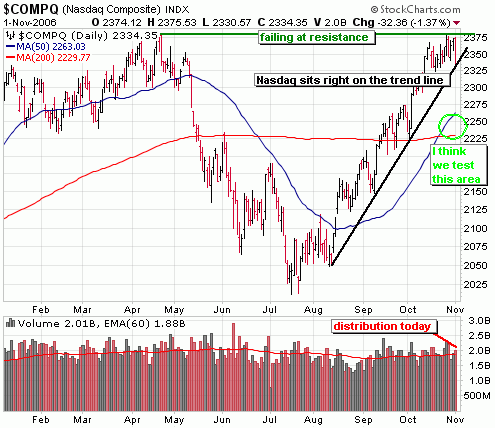
So what are the charts telling me and what am I "trusting"? For the S&P and Dow, I’m fairly neutral. The charts aren’t showing signs of significant weakness at this point and there are no significant resistance levels in sight. What concerns me most is the Naz and the deteriorating action in the semiconductors which appear to have much more room to run.. to the downside. In the Nasdaq, it faces formidable resistance at the April highs. If you take a look at the weekly chart, what you’ll see is 3 straight weeks of weakening technical action. By all indications, with the Nasdaq leading the way, the market begins to digest its gains now.

That being said, I don’t believe any correction from here will be severe and that any dips will provide anxious buyers who may have missed the bulk of the rally with an opportunity to get their feet wet. I know I will be looking for an orderly pull back to begin leveraging gains with margin. Remember that many investors are still stung by the 2000 crash and remain skeptical about the ability of the market to make them money with tolerable risk. It wasn’t until recently that more friends of mine (who don’t follow the market) have begun to make comments about the market, but none of them are yet putting money to work. We haven’t reached that frenzied stage"
A Round of Profit Taking Begins
If there has been any question about whether significant profit taking at these lofty levels would ensue, today’s action probably puts those questions to rest. In the weekend review email I mentioned that I’m "trusting" the technicals which are telling me the Nasdaq was showing signs of a top (resistance, 3 straight weeks of weakening action) and that the correction begins now with the Nasdaq leading the way. Today’s action confirms it.
On Monday and Tuesday, the bulls held their ground just as they have over the past several days, preventing significant selling. However, new fears are creeping into the market. With the lower than expected GDP on Friday, the Chicago PMI at a 14 month low yesterday and a much larger drop in the Manufacturing ISM this morning to 51.2% (anything below 50% indicates contraction), there are fears that perhaps the economy may be slowing a bit too much. That provided an excuse to lock in some nice profits and that trend should continue over the next couple weeks.
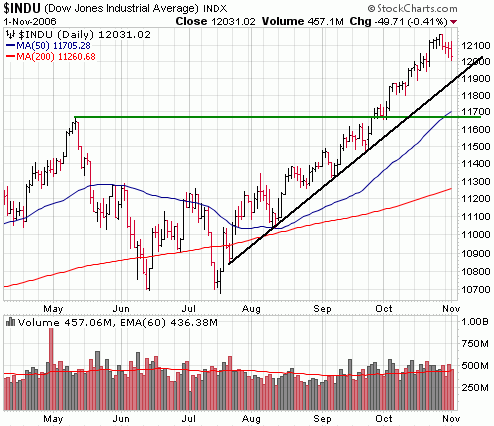
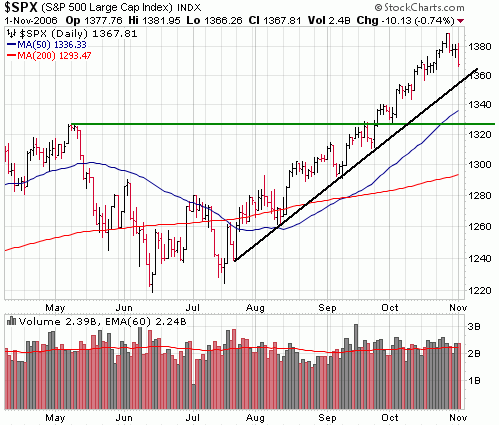
It should be noted that the Nasdaq led the way down today, with semiconductors providing leadership to the downside. Distribution (institutional selling) occurred in the Nasdaq, but not in the S&P and Dow. Technically, the Nasdaq is currently sitting right on support of its upward trend line but has the momentum to take out that level and ultimately test the area around 2250, where the 50 and 200 day moving averages converge. Both the Dow and the S&P looked relatively healthy today, despite the selling and have some room to run before testing their upward trend lines.
Here’s a look at the charts of the major indices:
The Nasdaq still has support at the first support area of the upward trend line (in black), but the intensity of today’s selling (distribution) would indicate that level won’t hold. I’m looking for a much larger drop to the area around where the 50 and 200 day moving averages converge (~ 2250). Note the failure at resistance of the April highs.

You can see that the Dow remains the strongest of the indices and the selling wasn’t nearly as intense in the big blue chips as it was in the smaller, tech oriented names. There is a considerable amount of room to run before the Dow even touches its upward trend line. It’s too soon to tell if it will hold that line, but if I were to guess I’d say it eventually takes out that level and retests the previous all time highs around 11,700.

The S&P looks very similar to the Dow and has some room to run before testing first level support at the upward trend line at around 1360. If it can’t hold there, expect a retest of the previous highs around 1330.

Leading Stocks Deteriorate
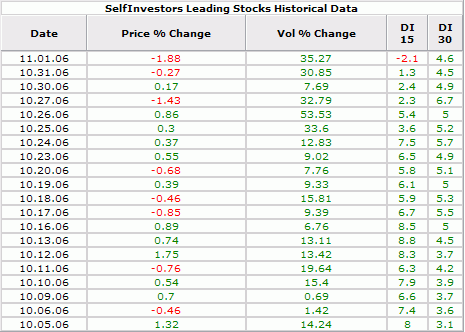
The action in the Nasdaq is a concern, but more concerning is the action of leading stocks. The Self Investors Leading Stocks Index, which is an index comprised of 360 (it fluctuates between 300 – 400) of the fastest growing companies leading the market higher. They did not fare well today. In fact it was one of the worst performances in a few months. If you’ve been following some of the earnings reports recently, you’ve seen the carnage in even the best companies. Garmin (GRMN), Encore Wire (WIRE), TheStreet.com (TSCM), Ansoft (ANST), and on and on. The performance of leading stocks is something that I monitor every day (you can too over in the right column of this blog) and the trend over the past several days clearly indicates leading stocks are faltering. The following table shows the performance of the Leading Stocks index over the past 20 days with its corresponding DI scores. I’ve mentioned those scores here before, but basically they are Demand Indicator scores (a measurement that I formulated to track demand in a stock or index based on price and volume movements – the higher the score, the greater the demand). Registered members of SelfInvestors.com will have access to this historical data once the new site is released in just a couple weeks! Stay tuned.
Notice the steady trend lower in the demand, particularly in the shorter time frame of 15 days. In the middle of October, the DI 15 score was averaging around 7-8, but in the last several days it’s been hovering around 2, before dropping to negative today for the first time in several weeks.
