Breakout Stock Highlights (9.1.06 – 9.15.06) Comtech Group (COGO), International Securities Exchange (ISE), GOL Intelligent Airlines (GOL) & Perficient (PRFT)

It’s time again for another rousing rendition of the breakout stock highlights report… and it’s a good one so hold on to your britches.  Ok, well maybe not that good.  There are many high quality breakouts over the past few weeks and I’ll highlight just a few in this report but that doesn’t mean it’s time to bet the farm on these plays.  I’m still advocating a cautious approach up at these levels especially considering we have important data and announcements coming up tomorrow morning (inflation PPI, housing starts) and Wednesday (rate decision).  That said, here’s the breakdown of the past couple weeks. 

In the two week period there were a total of 37 breakouts tracked in my database (actually 3 are  included in the top rankings but not shown in the screenshot I’ve provided for you below because they were added or their pivot points adjusted after the screenshot was taken).  These 3 are highly rated and worth looking into further – Highland Hospitality (HIH), currently the highest rated stock in the database with a score of 55 out of 60; BlackRock (BLK) and MEMC Electronic Materials (WFR) both with overall ranking of 52 out of 60.  All three are outstanding companies with nice looking charts.

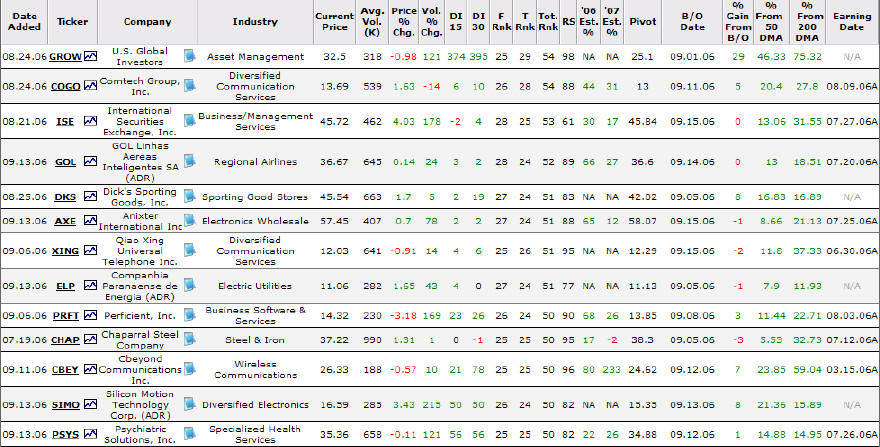
Got off track there a bit.. back to the data.  Of the 37 breakouts, 25 have finished the period with a gain, 7 with a loss and 5 with no gain.  All in all, a very successful couple of weeks for breakouts.  Only 2 stocks finished the period with a loss greater than 8% – Agnico Eagle Mines (AEM) and Himax Technologies (HIMX).  Himax Technologies (HIMX) however, continues to hold up well and could still stage another breakout.  The big winner and one of the top breakout stocks in the database for several weeks now is US Global Investors (GROW) with a whopping 29% return following its breakout on September 1st.

:::::>  As always, here’s a screenshot of the database that shows some of the top breakouts

I’d like to highlight a few of the charts of top breakout stocks showing good technical action and not too extended from a proper buy range.  Starting it off is Comtech Group (COGO) which first broke out on September 11th with very good volume above 12.90.  Notice the dry up in volume at the bottom of the base, the surge in the right side, followed by another dry up in the handle, followed by another surge in buy volume at the breakout.. all classic signs of building demand for a stock.  The action of the past 3 days however have been slightly negative and probably indicate the stock needs some time to consolidate recent gains.

Next up is International Securities Exchange (ISE) which has benefited from a surge in the brokers/exchanges group.  I have this company as the highest rated in this industry and although its carved out a somewhat steep base (correcting around 40%), the positives can’t be ignored.  The stock showed good institutional support at its 200 day moving average on 3 occasions this summer and it’s beginning to show good demand.  I’d probably want to see it confirm it’s breakout by getting above today’s high with volume at least 50% greater than average.  However, another lower volume decline to around 44 may offer a better entry.  Should the stock test its all time highs, I’d be tempted to lock in some profit given the severity of the correction.  That’s just me though.  I’m never disappointed in taking a profit too early.. unless of course I’m referring to TASR a couple of years ago when I locked in a quick 50% gain only to watch the stock get away from me.. and uh.. yeah I’d rather not talk about that one.

Over the past few weeks maybe you’ve noticed the parabolic move in Copa Holdings (CPA), the Panamanian airliner that’s risen 50% in just the last month alone.  The growth in this airliner, capitalizing on the Panama boom is mighty impressive, but the growth in GOL Intelligent (GOL) airlines, the Brazilian airliner is staggering.  Its earnings growth has been nearly doubling in each of the past few years and isn’t yet showing any signs of slowing down.  Looking at the chart, you see a good bounce off the 200 day moving average while carving out the second leg down of its somewhat asymmetrical double bottom base.  This is the first time its touched the moving average in almost a year.  It bounced off that area back in October 2005 as well as April 2005.  So, the uptrend marches on with a recent breakout above the middle peak in the W shaped base above 36.50.  The stock has stalled a bit, but has some support around 35.. certainly worth watching.  It’s the highest rated airliner in the database.

Last, but not least is a favorite of mine – Perficient Systems (PRFT).  A small, fast growing company off the radar of most investors with an outstanding looking chart.  After carving out a bullish looking shallow base, it broke out to multi year highs with a very good pick up in trading volume.  Its been consolidating those recent gains and still looks outstanding.  Something I’ve discussed in these reports many times before is the how a stock offers multiple entries.  The first entry was provided on a breakout above the short handle with near record volume on September 8th.  The stock provided a second entry point the very next day as it took out multi year highs above 14.47.  Now the stock is offering yet another chance as it pulls back to what should be a strong area of support around 14. 

Note: For purposes of full disclosure I do currently have long positions in PRFT and WFR.

Weekly Market Review – Critical Week Ahead (Multi Year Highs, More Inflation Data & the Fed Speaks)

With early indicators forecasting a soft landing in the economy and crude and other commodities continuing their precipitous decline, the environment was ripe for more buying from the bulls last week.  With another leg up, we inch ever so close to those all important multi year highs in the Dow and S&P.  Add to that housing data, producer price index inflation data and another Fed decision on interest rates and you have a whopper of a week on the horizon.  No doubt this week is critical and may determine the fate of this market for the rest of the year.  Put your hard hats on and get to work.  It’s important to prepare for both sides of the market at this point. 

Be sure to keep an eye on my MidDay Market reports this week.. I’ll be watching price and volume movemnents like a hawk and keep you updated on important market moves this week.

::: Model Portfolio Update :::

Last week was one of the busiest weeks of trading in the Model Portfolio that I can remember, having to shift from a short dominated portfolio, to a long one.. I got caught leaning the wrong way this week and paid the price.  For the week, the market went one way (up) and the Model Portfolio went the other (down 1.2%). 

While the short plays hurt, the biggest hit occurred in my lone silver play Silver Wheaton (SLW), which went from big time bullish break out and leader of the portfolio to massive breakdown at the drop of the hat.  A sizable gain turned to a loss on the trade.  Highly frustrating, but it happens (hopefully not very often).  Along with SLW, two other long positions were closed during the week – Time Warner Telecom (TWTC) (Quick Strike Profit Play) for a small loss and Knight Capital (NITE) for a small gain. TWTC was sold because I felt like it was stalling.. it was eventually sold when it broke through the 35 day moving average on Sept 11.  NITE sold off sharply due to a report on Friday that  trading volume had decreased from the previous month AND the year ago period.  With heavy selling volume in the morning and no sign of a bounce, I wasted no time in taking a small profit in the position. 

On the other side of the coin, I scrambled to close 4 of the 5 short positions as all were showing considerable strength.  Penn National Gaming (PENN) was covered for an 11% gain, while SIAL (-5%), CHRW (-6%) and ATHR (-4%) were covered for losses.  To replace the shorts and closed long positions, 6 new long positions were initiated (2 on Monday, 4 Wednesday). 

Current allocation of the portfolio is as follows: roughly 7% short, 23% cash and 70% long.  With multi year highs fast approaching I may be decreasing my long exposure on any signs of weakness.  The Year to Date performance of the portfolio dropped 1.2% for the week and stands at 15%.. still more than double the return of the S&P500.

::: PinPoint the Highest Ranked Breakout Stocks in Just Minutes Each Day! :::

Want to take your membership to the next level?  Premium members who have been following along with buy and sell alerts in the Model Portfolio are smashing average returns with a 15% YTD performance.  In addition to alerting you to the best opportunities on the long side, short opportunities are used to make money during a downturn.  That’s just one of many premium features….

There are literally dozens of breakout stocks to watch every day.  How about a database of stocks all ranked according to fundamentals and technicals, complete with pivot points, earnings date, % change from breakout and moving averages, future earnings estimates and relative strength rating?  How about Stock Watch reports highlighting long and short opportunities for the coming week?  It will save you hours of research every week and drastically improve your results.

Try it out for yourself for 30 days!  Sign in to your account here: http://www.selfinvestors.com/amember/member.php and take advantage of the no risk trial.

::: Best/Worst Performers :::

– Top 10 Performing Industries For the Week –

1. Electronic Stores                            12.50%
2. Major Airlines                                    9.55%
3. Investment Brokerage                       9.40%
4. Industrial Equipment                          9.30%
5. Processing Systems & Products      8.60%
6. Home Furnishing Stores                   8.30%
7. Residential Construction                   8.02%
8. Home Improvement Stores                7.85%
9. Jewelry Stores                                 7.50%
10. Housewares & Accessories          7.45%

– Top 10 Worst Performing Industries For the Week –

1. Silver                                                -12.48%
2. Gold                                                    -9.00%
3. Copper                                                -7.20%
4. Oil & Gas Equip & Services                -5.65%
5. Long Distance Carriers                       -5.35%
6. Independent Oil & Gas                        -4.55%
7. Oil & Gas Drilling & Exploration           -4.55%
8. Industrial Metals & Minerals                -4.40%
9. Heavy Construction                            -3.70%
10. Nonmetallic Mineral Mining                -3.25%

– Top 5 Best Performing ETFs For the Week –
 
1. SPDR HomeBuilders (XHB)                    9.00%
2. HLDRS Internet Infrastructure (IIH)        9.00%
3. Ishares Broker – Dealer (IAI)                  7.30%
4. Ishares Networking (IGN)                      6.00%
5. PowerShares Dynamic Semis (PSI)      5.70%

– Worst 5 Performing ETF’s –

1. Ishares Silver  (SLV)                            -11.00%
2. Market Vectors Gold Miners (GDX)      -10.25%
3. Asa Gold (ASA)                                     -8.62%
4. Central Fund of Canada (CEF)               -7.10%
5. StreetTracks Gold (GLD)                       -5.35%

**  IPO’s Worth Watching for This Week **

The number of IPO’s coming to market will increase dramatically over the next few weeks, so keep an eye on this space!

1. DivX (DIVX): Certainly the most anticipated IPO’s of the week and possible one of the most anticipated of the year.  DivX offers products and servcies to improve the media experience, such as compression-decompression software library.  It’s still a very small company with just 27 million in revenue in the first 6 months of the year, but one that is rapidly growing.  Trading set to start on Friday.

2. CommVault Systems (CVLT): Provider of data management software applications and related services.  The company’s products enable its customers to deploy solutions for data protection, business continuance, corporate compliance, and centralized management and reporting.  The company is profitable and showing very good growth.  Trading set to start on Friday.

3. Home Diagnostics (HDIX): Manufacturer of blodd glucose monitoring systems and disposable supplies for diabetics.  The company believes its blood glucose monitoring systems offer diabetics performance and features that are comparable to or better than its comptetitors at substantially lower prices.  The company is profitable and growing quickly as profits have more than doubled in the past year.  Trading set to start on Thursday.

4. Riverbed Technologies (RVBD): Provider of innovative and comprehensive solutions to the fundamental problems of wide area distributed computing.  The company believes its Steelhead appliances can enable its customers to improve the performance of their applications and access to their data across WANs, increasing transmission speeds by 5 to 50 times and, in some cases, by up to 100 times.  This is not a profitable company and one that continues to burn cash.  Trading set to start on Wednesday.

5. Hawkeye Holdings (HWY):  Third largest ethanol producer in the US based on production capacity as reported by the Renewablee Fuels Association.  It owns 2 of the largest ethanol production facilities in the US.  The company is experiencing very good growth over the past year.  Trading set to start on Friday.

6.  Hiland Holdings (HPGP): Engaged in gathering, compressing, dehydrating, treating, processing, and marketing natrual gas, and fractionating, or separating, natural gas liquids..  Trading set to start on Wednesday.

Others to Watch: Porter Bancorp (PBIB) on Friday & Warner Chilcott (WCRX), a specialty pharma company starts trading Wednesday.

** Upcoming Economic Reports (9/18/06- 9/22/06) **

Monday:        Treasury International Capital Inflows, Current Account
Tuesday:       PPI, Housing Starts, Retail Sales
Wednesday:  FOMC Interest Rate Decision, Petroleum Status, Mortgage Apps
Thursday:      Money Supply, Philly Fed Survey, Jobless Claims, Leading Indicators
Friday:           None

** Latest Blog Entries – In Case You Missed Them!**

– SelfInvestors Blog –

Big Drop In Commodities Gives Market Momentum, But Major Resistance Looms (Sept. 12th)
http://investing.typepad.com/tradingstocks/2006/09/resistance_loom.html

** Look for a new Breakout Stock Highlights article to be posted tomorrow at the blog – there are several high quality breakouts in the last couple weeks.

MidDay Market Update – Nasdaq Breaks Through Resistance in Triple Witching Volatility

::: Today’s Market Action :::

It’s triple witching friday and that means a whole lotta volatility and strange movements in individucal stocks.  The market opened up big out of the gates as traders were pleased with the tame CPI data and sent the Nasdaq surging above important resistance of the 200 day moving average and the June Highs around 2233.  It didn’t take long for those gains to evaporate as the Nasdaq filled the opening gap, but finding support there.  It’s been on the way back up and the odds are good for the market to finish the day in the green.  Both the Dow and S&P have yet to touch their multi year highs, but are within striking distance.  Expect volatility to increase as we near the close.. in addition to options expiration, the S&P will undergo some reshuffling. 

** Market volume levels are meaningless for guaging health today, so I won’t be displaying those in this report.

::: Self Investors Leading Stocks :::

SelfInvestors Leading Stocks are stocks of the fastest growing companies in the world that are near a breakout or have already broken out of bases.  These stocks comprise the Breakout Tracker database of SellfInvestors.com and are hand picked by me for inclusion based on sales/earnings growth, ROE, profit margins, management ownership and institutional buying.  Only the best make it into the database.  Tracking the health of these stocks is a very important piece to guaging the overall health of the market.  The SelfInvestors Leading Index is an aggregate performance of the entire database of stocks (usually 300 – 400 stocks depending on the health of the market).  I break it down into Advancers and Decliners and look at the price and volume movements of both throughout the day.

** Again, it’s meaningless to display volume levels but advancers are outpacing decliners today. Volume is a bit heavier in stocks moving to the downside today, but nothing to be too concerned about.  Volume levels are relatively meaningless today.

::: Where’s the Money Flowing :::

Many websites just provide leading industries based on price performance alone.. without the volume, this can be misleading.  The only way that I know of to guage industry/sector strength WITH volume levels is through the analysis of ETF’s.  A couple years ago this was not possible, but as more traders/investors use ETF’s they become a much better tool for guaging the health of the market and seeing where the money is flowing (or not flowing).  Using the proprietary SelfInvestors Demand Indicator score which measures price and volume movements, I’m able to quickly see which sectors/industries are seeing the greatest inflows of cash. 

* Leading Sectors/Industries – Semis, Technology, Consumer Discretionary, Telecom, Consumer Services
* Lagging Sectors/Industries – Energy, Energy, Energy.. and Energy AND Gold.

* In keeping with the common theme of late, Homebuilders are leading the way again today.  Also doing well is Software and Nantoech.  Gold is getting a little bounce today with some volume
* Once again Energy is the only area of significant selling.

::: Stocks :::

This area still under development.

Big Drop in Commodities Gives Market Momemtum, But Major Resistance Still Stands in Way

With traders filing in from Labor Day vacations and trading volume returning to normal levels, the market was to reveal more clues as to its direction.  There certainly has been much speculation (myself included to a certain degree) that the rally off the July lows is/was a sucker’s rally in danger of a collapse once traders returned from summer vacations.  In the first couple days of trading last week, it appeared that scenario would play out after 2 straight days of mild distribution..  However, the steep drop in commodity prices recently (which have stoked inflation fears over the past year) appears to be igniting this market as a massive shift from anything commodity related flows into technology (primarily), consumer descretionary, healthchare, financials and even retail names.  It’s too soon to tell just where the floor of the commodity drop is and whether it can be the catalyst for a sustained market rally, but one thing is fairly certain –   it’s going to be quite some time before we see sustained and substantial moves in these commodities again (see this chart that shows crude taking out its 3 year trend line).   There is just simply too much money pouring out of them right now.  In the long run, this bodes well for the market.

Today’s action was the strongest I’ve seen in a month as prices moved up substantially with volume well above average levels.  SelfInvestors.com Leading Stocks (an indexed handpicked by me comprised of the fastest growing companies near a breakout or having already broken out of a base) also did very well today (yesterday they did not).  One day obviously doesn’t make a trend, but it may be enough momentum to at least get to major resistance areas in the indices that I’ve mentioned in previous reports – the multi year high in the Dow at 11670, the multi year high in the S&P at 1327 and the 200 day moving average in the Nasdaq at 2234.  Despite today’s bullish move and the "economically positive" drop in commodities recently, I’m still very much concerned with these major resistance levels.  I’ll point out again that the rise over the past few months is a steep one with the indices (particularly the S&P and Dow) etching V like bases which are prone to failure.  If and when we test these multi year highs, I would be listening to that little voice of reason over your shoulder saying, "Be careful up here, be careful".

Note: on Friday the all important CPI number will be released.

Here’s a look at the charts and their resistance levels.

MidDay Market Update – Market Following Through

::: Today’s Market Action :::

After yesterday’s sharp bullish reversal off the lows with volume, the market is following through with another bullish move through the first part of trading day today.  Volume is quite good and on pace to come in higher than yesterday in the major indices (it should be noted that volume is tracking much lower in the tracking ETFs of the major indices), indicating a good chance of another day of accumulation (a telling sign that institutions are once again putting money to work). 

(Note: volume averages are based on the average over the past 50 days)
Data as of 1:30PM EST

Nasdaq: up .91% today with volume currently tracking 3% ABOVE  average
Nasdaq ETF (QQQQ): up .81%, volume 13% BELOW the average
Dow: up .52%, volume 2% BELOW average
Dow ETF (DIA): up .58%, volume 23% BELOW the average
S&P ETF (SPY): up .52%, volume 27% BELOW the average
Russell Small Cap ETF (IWM): up 1.42%, volume 40% BELOW the average

Leading stocks that make up the SelfInvestors Breakout Tracker database are fairing a bit better today but sell volume is still heavier than buy volume in these leading stocks. 

Summary:

* Advancers leading Decliners 283 to 110.
* Advancers are up 1.67% today, but volume is 8% BELOW average
* Decliners are down .98% and volume is somewhat heavy at 10% ABOVE average
* The total SI Leading Stocks Index is up .82% today but with volume a bit below average by 3%

* Where’s the Money Flowing *

Many websites just provide leading industries based on price performance alone.. without the volume, this can be misleading.  The only way that I know of to guage industry/sector strength WITH volume levels is through the analysis of ETF’s.  A couple years ago this was not possible, but as more traders/investors use ETF’s they become a much better tool for guaging the health of the market and seeing where the money is flowing (or not flowing).  Using the proprietary SelfInvestors Demand Indicator score which measures price and volume movements, I’m able to quickly see which sectors/industries are seeing the greatest inflows of cash. 

* Leading Sectors/Industries – Consumer Discretionary, Technology, Pharma, Financial, Retail
* Lagging Sectors/Industries – Energy, Energy, Energy.. and Energy AND Gold.

* Today, Homebuilders, Broadband and Retail are surging again just as they did yesterday; Transports and Consumer Discretionary are also moving up today with volume
* Energy is getting hit once again today.. along with Utilities

** Stocks **

This area still under development.

MidDay Market Update – Big Bullish Reversal

In early trading today it appeared we were headed for distribution day number 3 in just 4 days, then buyers rushed in to save the day and keep both the S&P and Nasdaq above support of their 20 day moving averages.  Bullish action indeed.  With volume coming in at below average levels but ahead of Friday’s levels, we’re in line for a day of accumulation (assuming of course the early selling doesn’t resume in the last hour of trading).  Here are the volume levels as of 2:45PM EST)

(Note: volume averages are based on the average over the past 50 days)

Nasdaq: up .34% today with volume currently tracking 11% BELOW  average
Nasdaq ETF (QQQQ): up .57%, volume 29% GREATER than average
Dow: up .06%, volume 11% BELOW average
Dow ETF (DIA): up .22%, volume 16% BELOW the average
S&P ETF (SPY): up .15%, volume 5% BELOW the average
Russell Small Cap ETF (IWM): up .06%, volume 11% BELOW the average

Leading stocks that make up the SelfInvestors Breakout Tracker database are NOT fairing well today.  Volume is much heavier in declining stocks than advancing stocks.. a bearish indicator.

Summary:

* Decliners are outpacing Advancers 226 to 167.
* Advancers are up 1.27% today, but volume is 18% BELOW average
* Decliners are down 2.37% and volume is somewhat heavy at 15% ABOVE average
* The total SI Leading Stocks Index is down .82% today with volume up just a bit at 1% GREATER than the average

* Where’s the Money Flowing *

Many websites just provide leading industries based on price performance alone.. without the volume, this can be misleading.  The only way that I know of to guage industry/sector strength WITH volume levels is through the analysis of ETF’s.  A couple years ago this was not possible, but as more traders/investors use ETF’s they become a much better tool for guaging the health of the market and seeing where the money is flowing (or not flowing).  Using the proprietary SelfInvestors Demand Indicator score which measures price and volume movements, I’m able to quickly see which sectors/industries are seeing the greatest inflows of cash. 

* Leading Sectors/Industries – Consumer Discretionary, Technology, Pharma, Financial, Realty
* Lagging Sectors/Industries – Energy, Energy, Energy.. and Energy.  Transports too.

* Today, Homebuilders, Broadband, Semis, Retail and Consumer Services are moving up with volume
* Gold and Energy are selling off today with significant volume

** Stocks **

This area still under development.

Weekly Market Review – Friday’s Inflation Data is Main Event

As expected, traders returned from Labor Day vacations to take some profits off the table.  While selling volume wasn’t particularly intense, it was enough for 2 consecutive days of distribution indicating the big fellas were taking some profits off the table.  Nothing to be alarmed about at this point, but worth keeping an eye on.  The big event for next week will be Friday’s CPI data and how the market reacts will reveal a big clue as to the health of this market.  One underlying shift with potentially big implications is declining crude prices, which over time could dramatically decrease inflation concerns and be the catalyst this market needs to break out to multi year highs.  Looking at a long term chart of light crude (continuous contract), it broke through a 3 year trend line at the end of August and more recently broke through support of the 200 day moving average (http://www.selfinvestors.com/crude91006.jpg).  Crude is oversold in the short term and most likely will see some bounce, but the technical damage is done.  It’s going to be a long time before we see $80 crude and that bodes well for the bulls.

** Model Portfolio Update **

The Model Portfolio held up well in a down week.. and managed to eak out a gain of .2%.  With the market reaching lofty levels and profit taking underway, I shifted the weight of the portfolio more to the short side by closing 2 long positions and initiating 3 new short positions (all of which closed the week with a profit).  Long positions were closed in Cognizant Tech Solutions (CTSH) and True Religion (TRLG).  While both don’t look particularly weak, they don’t look particularly strong either.  As part of a strategy shift in an increasingly choppy market, I don’t hesitate to dump a stock if it’s not showing great strength.  There are too many other opportunities out there and you can always buy them back.  In particular, with CTSH I plan to buy the stock back if it proves itself by breaking above 72 with great volume.  With a 16.2% year to date return, the strategy is paying off.  Current prtfolio allcocation is roughly 35% short, 35% long and 30% cash.  Should the market hold up reasonably well next week, I plan to add a long position or two.

:::::::::::::::::::::::::::::::::::::::

A couple weeks ago I sent out a report to premium members highlighting my top break stocks for the coming week.  At the top was US Global Investors (GROW), which soon thereafter vaulted more than 30%.  I’m about to release two new top breakout plays (and no you won’t see these in the IBD 100!) off the radar of most traders and on the verge of big time moves.  Get these picks and full access to all member tools and reports with your *free* 30 day premium trial.  Just login to your account page at http://www.selfinvestors.com/amember/member.php and sign up in seconds! 

:::::::::::::::::::::

** Best/Worst Performers **

– Top 10 Performing Industries For the Week –

1. Pollution & Treatment Controls        5.19%
2. Dairy Products                                5.08%
3. Long Distance Carriers                   4.73%
4. Discount – Variety Stores               3.55%
5. Department Stores                          3.52%
6. Lodging                                           2.71%
7. Apparel – Footwear                        2.68%
8. Aerospace/Defense                       2.43%
9. Restaurants                                    2.36%
10. Auto Parts Stores                         2.06%

– Top 10 Worst Performing Industries For the Week –

1. Oil & Gas Refining & Marketing        -5.41%
2. Shipping                                           -5.18%
3. Water Utilities                                   -5.02%
4. Manufactured Housing                    -4.66%
5. Data Storage Device                       -4.49%
6. General Contractors                        -4.21%
7. Auto Parts                                        -4.20%
8. Industrial Metals & Minerals              -3.92%
9. Independent Oil & Gas                      -3.86%
10. Medical Laboratories & Researc    -3.85%

– Top 5 Best Performing ETFs For the Week –
 
1. HLDRS Retail  (RTH)                              2.09%
2. Ishares Tawian  (EWT)                         1.76%
3. PowerShares Retail  (PMR)                   1.69%
4. Ishares Singapore  (EWS)                     1.43%
5. Ishares Consumer Services  (IYC)        1.19%

– Worst 5 Performing ETF’s –

1. Ishares Silver  (SLV)                            -6.03%
2. Powershares Dynamic Energy  (PXE) -4.87%
3. Central Europe & Russia  (CEE)           -4.74%
4. Ishares South Africa  (EZA)                -4.59%
5. PowerShares Clean Energy  (PBW)    -3.97%

**  No IPO’s Worth Watching for This Week **

** Upcoming Economic Reports (9/11/06- 9/15/06) **

Monday:        None
Tuesday:       Trade Balance, TIPP Economic Optimism, Retail Sales
Wednesday:  Treasury Budget, Petroleum Status, Mortgage Apps
Thursday:      Money Supply, Import Price Index, Business Inventories, Jobless Claims
Friday:           CPI, Industrial Production, Real Earnings, Manufacturing Index, Consumer Sentiment

** Latest Blog Entries – In Case You Missed Them!**

– SelfInvestors Blog –

Self Investors Leading Breakouts Soar to New Heights, But.. I’m Stil Cautious (Sept. 5th)
http://investing.typepad.com/tradingstocks/2006/09/selfinvestors_l.html

MidDay Market Update – Orderly Profit Taking

With the market a bit extended and resistance levels near, it’s most likely looking for any excuse to pull back.  What’s important is how orderly and the amount of selling volume that accompanies any consolidation/pull back.  Today, we are getting some orderly profit taking as volume is currently well below average levels and lighter than yesterday.  Here are the numbers for the major indices as of 1PM EST:

(Note: volume averages are based on the average over the past 50 days)

Nasdaq: down 1.2% today with volume currently tracking 1% GREATER than average
Nasdaq ETF (QQQQ): down 1.39%, volume 22% BELOW average
Dow: down .35%, volume 20% BELOW average
Dow ETF (DIA): down .43%, volume 37% BELOW the average
S&P ETF (SPY): down .67%, volume 32% BELOW the average
Russell Small Cap ETF (IWM): down 1.78%, volume 27% BELOW the average

Leading stocks that make up the SelfInvestors Breakout Tracker database are fairing well today despite a more than 3:1 ratio of Decliners vs. Advancers.  Leading stocks that are moving are moving with volume, while those that are declining are declining with mild volume.

* Decliners are outpacing Advancers 336 to 53.
* Advancers are up 1.3% today and volume is good at 28% ABOVE the average
* Decliners are down 1.86%, but the good news is that volume is light at 11% BELOW average.
* The total SI Leading Stocks Index is down 1.43% today with volume 5% below the average

* Where’s the Money Flowing *

Many websites just provide leading industries based on price performance alone.. without the volume, this can be misleading.  The only way that I know of to guage industry/sector strength WITH volume levels is through the analysis of ETF’s.  A couple years ago this was not possible, but as more traders/investors use ETF’s they become a much better tool for guaging the health of the market and seeing where the money is flowing (or not flowing).  Using the proprietary SelfInvestors Demand Indicator score which measures price and volume movements, I’m able to quickly see which sectors/industries are seeing the greatest inflows of cash. 

* Leading Sectors/Industries – Pharma, Financial, Nanotech, Health Care, Telecom
* Lagging Sectors/Industries – Transports, Oil Services, Home Builders

* There are no significant sector/industry moves up today
* Homebuilders, Semis, Water, Global Energy and Broadband is getting hit today

** Stocks **

This area still under development, but you may like to have a  look at the latest post over at the blog which highlights a few of the top breakout stocks in the SelfInvestors database

http://investing.typepad.com/tradingstocks/2006/09/selfinvestors_l.html

SelfInvestors Leading Breakouts Soar to New Heights, But.. I’m Still Cautious

Over the past couple weeks, particularly in the past few days, several of the SelfInvestors.com highest rated breakout stocks have been soaring to new highs with outstanding volume as new leaders emerge.  As the market meanders higher with less than inspiring volume, some individual stocks are making explosive moves.  Highly rated companies such as US Global Investors (GROW), Silver Wheaton (SLW), NewMarket Corp (NEU), Copa Holdings (CPA) and Bolt Technology (BTJ) all made new all time highs today with very good volume.  Here’s a look at the charts of these companies…

As always, you can view the list of top breakouts (these are stocks ranked 50/60 or above and have already broken out) here.


——————————–

As much as I’d like to highlight all of these top rated breakout opportunities BEFORE they happen, the advertising here pays very little and doesn’t compensate for the full time job of researching, analysing, ranking and maintaining my database of stocks.  Not to mention it wouldn’t be fair to my paying members.  How about giving the SelfInvestors.com premium service a try for free for 30 days?  I guarantee you won’t be disappointed.

——————————-

Despite the successful breakout of some of my highest rated stocks, I still maintain an increasingly cautious approach as the major indices march towards major resistance levels with very little wind in their sails. 

In my weekend report to registered members, I mentioned the following:

With economic data of last week showing signs of a soft landing, the market continued to march higher, albeit in unmeaniful holiday trading.  With trading volume levels returning to normal levels later this week, we should begin to see signs of the market showing its hand.  I continue to believe that the market has come too far, too fast, with little institutional support behind the move in the past couple months.  With resistance at multi year highs in both the S&P (1326.70) and Dow (11670.19) as well as the 200 day moving average for the Nasdaq (about 2230) on the horizon, it’s important to proceed with caution on the long side.  There is some room to run to the upside before meeting those levels, but once those levels are reached I’ll be playing the market as if that is the end of road.  Essentially, I’m forcing the market to prove me wrong by breaking out to new multi year highs in the Dow and S&P and above the 200 day moving average for the Nasdaq WITH BIG VOLUME.  Only then will I get aggressive on the long side.

Here’s a look at the charts of the major indices.  If we get a few more moves up to resistance with lackluster volume, you better believe i’m increasing my short allocation big time.

You see the Dow marching toward its multi year highs of last May.  The fairly steep incline and lack of volume (whether its typical of this time of year or not) are a concern as it approaches this formiddable resistance level.  Be careful up here and consider locking in some of those profits soon.

Similar scenario for the S&P500.  At the very least, it needs to come in a bit and retest that steep trend line.

The Nasdaq isn’t close to resistance of multi year highs, but it is close to strong resistance of the 200 day moving average.. an area where it retreated from back in June.

ETF, IPO & Breakout Stocks Analysis, Tracking & Research