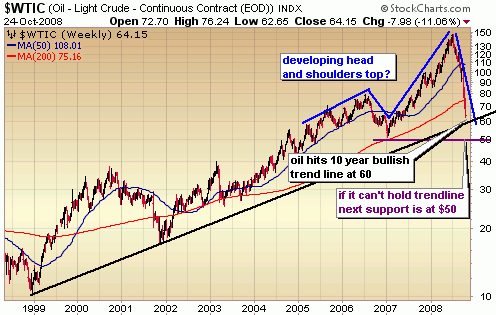
Here’s a long term weekly graph of light crude oil over the last 10 years. You have to go back to 2000/2001 to see a similar correction but the current correction in crude oil is much more dramatic. On the bullish side of things, crude oil will hit major support at a 10 year bullish trend line around $60/barrel and could see a significant bounce up to the next level of resistance around 80. It’s buyer beware when oil recovers to $80 though because a big head and shoulders top is forming. I have begun getting long oil stocks but will look to take profits if and when crude hits $80. The key is that 10 year trend line if you’re long oil. If it takes out that 10 year trend line we could see much lower crude prices in the coming years.
For more on oil and oil etfs see our sister site Oil ETF Central

What I understand in the graph is that the MEAN OIL Price will continue to grow through time if nothing will be done. Yes, it is true that there is a periodical pattern from some season to another of oil price increase and drops, but, these fluctuations will just be around an increase in the mean oil price. Again, all of these pattern will happen if nothing will be done.