Category Archives: Industry Spotlight
Semiconductor ETF’s Breakout (SMH, IGW) – Trading Opportunities
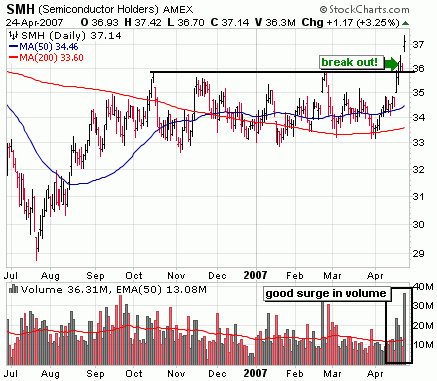
Semiconductors have broken out in recent days and that bodes well for the overall market. We still need to come in a bit after a steep incline, but if the semis can stage a run here, that would lend good internal strength for the market to hold up at multi year highs. The Semi Holders (SMH) is the strongest of the Semiconductor ETF’s with Texas Instruments (TXN), Intel (INTC) and Applied Materials (AMAT) making up a little more than 50% of the fund. It got a big boost following Texas Instruments’ earnings report yesterday after the bell.
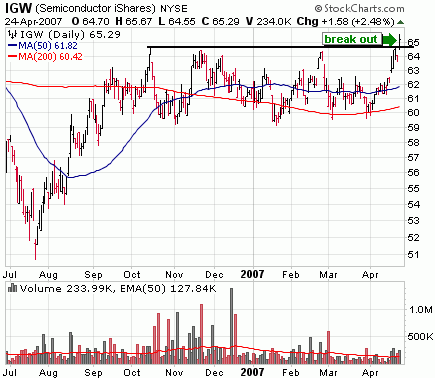
The Ishares Semis (IGW) broke out today, but volume hasn’t been impressive yet. This is a much more diversified fund with no companies dominating in the allocation.
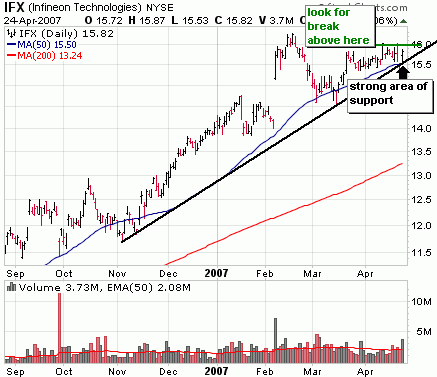
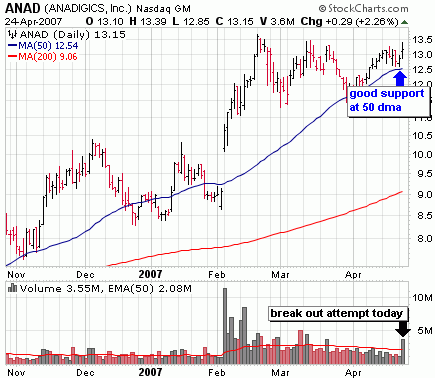
ETF’s are a good diversified way to play a break out in the semis, but I prefer to play invidual stocks which, while riskier, offer much greater reward. I should mention I am only holding positions for a short period at this time, looking to capture quick profits over a couple days. I’m waiting for the market to digest recent gains before initiating positions for the longer term. Here’s a sampling of the bullish charts I’m seeing in the semiconductor space.
Note: the companies highlighted are not necessarily good fundamentally, but all look great technically. Do your own research on these and know when they report earnings.
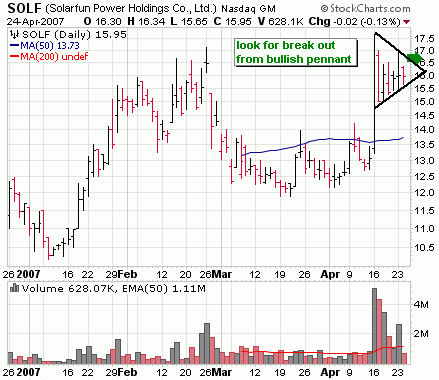
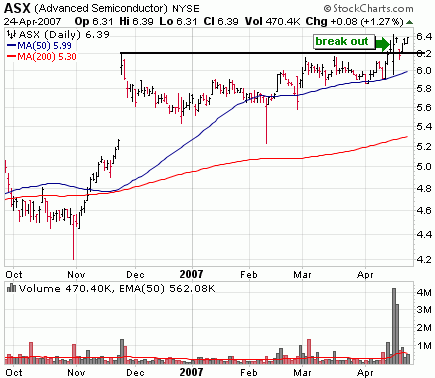
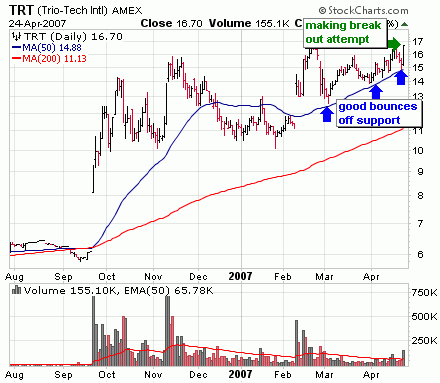
Disclaimer: I currently own positions in TRT and SOLF
A Uranium ETF.. Sort OF
In yesterday’s article which took a look at profit opportunities in clean coal, nuclear and uranium miners I alluded to the fact that there really wasn’t a way make a diversified investment within the US Markets in the uranium space. A reader’s comment reminded me of a portion of my research I forgot to include. While there isn’t any way that I know of to play uranium through ETF’s there is one Canadian company that just buys up uranium and stores it, allowing you to play the spot price of uranium. However, I don’t I’d be playing the spot price of uranium up at this level, which no doubt has moved higher on the Cameco mine flood news. The price has about doubled in the past year and near $75/pound. It’s an investment tool I’ll certainly be keeping an eye on though. Anyway the company is Uranium Participation Corp (ticker U:TO) I believe most brokers will allow you to make trades on the Toronto Exchange but you’ll most likely pay a hefty commission.
“Uranium Participation Corp. will invest at least 85% of the gross proceeds of the over-allotment in U3O8. The objective of Uranium Participation Corp. is to provide an investment alternative for investors interested in holding U3O8, which will be physically stored in duly licensed facilities located in Canada, France, the United Kingdom and/or the United States. The strategy of Uranium Participation Corp. is to invest primarily in long-term holdings of U3O8 and not to actively speculate with regard to short-term changes in uranium prices.”
There are many Canadian, so called uranium plays out there that you reallly have to be careful of. Take a look at this list of Candadian uranium miners. Reminds me of the tech boom when any company that put .com in their name got big attention from speculators. Be careful, I imagaine that there is little possibility some of these miners are going to be extracting significant amounts of uranium any time soon.
Part II: Profiting from the Advanced Energy Initiative – A Look At Clean Coal, Nuclear Power Utilities & Uranium Miners
Several days ago before the State of the Union address, I wrote up an article about profiting from the increasing importance that government has placed on advancing new energy initiatives to ween ourselves of dependence on foreign oil. The report began generally by taking a look at thePowerShares Clean Energy Fund (PBW ) and ended specifically with profit opportunities from changing the way we fuel our vehicles through the use of hybrids (tickers:HMC, TM, UQM, ALTI), ethanol (tickers: ANDE, PEIX, VSE, MGPI) and fuel cells (an industry I just can’t recommend investing in at this point).
Today’s report focuses on the second half of the Advanced Energy Initiative which discusses ways we’ll change the way we power our homes and business. The first part of the AEI describes ways we’ll begin reducing our dependence on foreign oil by changing transportation fuel sources, while the second part really focuses on decreasing our dependence on natural gas. Since natural gas is primarily produced in the US and Canada this is less of a security issue but rather an issue of scarcity, the volatility of natural gas prices and how that affects our economy. Essentially, the goal is to rely less on natural gas to power our homes and businesses to ensure the availability of affordable electricity and ample natural gas. It’s assumed that by doing so, prices drop and US firms will be more competitive in the global market keeping more jobs here at home. The Advanced Energy Initiative mentions that according to the National Association of Manufacturers, the chemicals and plastics industries, which rely on natural gas both for energy and as a raw material, have lost 250,000 jobs and $65 billion in business due to the rise in natural gas.
The 3 main goals of the AEI as it relates to natural gas reduction (and where we’ll look to profit) are:
1. Add $2 billion to clean coal technology research and bring to marketplace
2. Eliminate proliferation of risks and expand the promise of clean, reliable and affordable nuclear energy
3. Reduce the cost of solar photovoltaic technologies so that they become cost competitive by 2015 and expand access to wind energy
Clean Coal
According to the AEI report, the US holds more than one quarter of the world’s coal reserves and the energy content of this reserve exceeds that of the world’s known recoverable oil. The difficult part is eliminating the pollution produced by coal so that we can tap into this resource on a greater scale without further damaging the environment. The problem is even greater in developing countries China and India which generate 2/3 of their electricity from dirty coal, resulting in the most polluted cities in the world. Of course there is much debate about the whether clean coal can be achieved at all and I could dedicate an entire blog to this subject, but this is an investing blog so I’ll focus on those companies attempting to reduce/eliminate coal pollution.
The process of reducing coal pollutants is called CO2 capture/storage (CCS) or geological carbon sequestering and involves separating the CO2 as it’s created and pumping it underground to be stored. One initiative from the government and a group of coal producers andutilities is FutureGen, a proposed zero emissions power plant that uses a technology called Integrated Gasification Combined Cycle (IGCC) that boasts drastically reduced sulfur dioxide (SO2), nitrogen oxide (NOx ) and mercury emissions as well as sequester the greenhouse gases (CO2). It all sounds good on paper, but there is great concern that it’s more of a PR stunt for these polluting companies rather than a sustained solution with great impact. Clean coal is largely considered a stopgap measure, rather than a lasting one to solve our energy needs with little environmental destruction.
As far as investing in this arena, there are limited choices. Of course there are the coal producers themselves which stand to benefit from an increased use of coal – Penn Virginia Resources (PVR), Massey Energy (MEE), Peabody Energy (BTU) and Arch Coal (ACI), but socially conscious investors may be more comfortable and find greater profit in a small but fast growing company that provides the technology to significantly reduce coal plant emissions. The company is Fuel Tech (FTEK) and they provide the technology to help reduce the nitrogen oxide by as much as 30 – 70% not only in coal plants but other manufacturing plants as well. One big factor pushing up its stock price recently is news that the company is making inroads into China which is concerned about pollution ahead of the 2008Bejing Olympic Games.
*Interested in more on this subject?*
Unmasking the Truth Behind Clean Coal
Clean Coal Technologies White Sheet US Dept of Energy – Clean Coal
How It Works – Clean Coal Technology
The False Promise of Clean Coal
Clean Coal Multimedia Presentation
Alternative Energy Blog – Coal
The Energy Blog – Hydrogen From Coal Technologies
Expanding Nuclear Capacity
Whereas coal currently provides half of the electricity we use to power our homes and business, nuclear power currently makes up a much smaller percentage and provides just 20% of the electricity we use. Many feel that nuclear energy is a much better alternative to coal or natural gas to fuel our energy needs because it’s much cleaner, the plants are cheaper to operate (1.72 cents/kilowatt-hour compared to 2.21 for coal, 7.5 for gas and 8.09 for oil) and the electricity costs that result are lower and more stable. The big negative with this type of energy is the up front cost to build the plant and the risk associated with spent nuclear fuel, making it too much of a financial risk for companies to build new plants.
Consider these stats from a recent Kiplingers article:
- the amount of electricity the US uses is expected to increase 50% in the next 25 years – on a global scale, the increase is expected to be more profound as emerging economies use moreTVs, radios, computers and air conditioners.
- the London based World Energy Council says that meeting new demand for electricity while reducing the current level of emissions will require tripling the world’s nuclear plant capacity by 2050.
Also pointed out in the article is the lack of investment opportunities in the nuclear space since most companies rapidly building nuclear facilities are foreign companies or privately held. General Electric is a play, but their nuclear business represents just 10% of its annual revenues.
Where does that take us? To existing utilities with an existing sizable inventory of nuclear plants as well as the uranium mining companies. The reasons are fairly straight forward as the article points out – in addition to huge start up costs there are years of regulatory hurdles to clear, so companies with existing nuclear facilities have a huge leg up. On the mining end of things uranium prices have skyrocketed recently and over the long haul should continue this trend.
The big gorilla of nuclear utility plays is Excelon (EXC) with the largest exposure to nuclear power facilities. You’re probably never going to make a fortune with this company, but just as it has over the past several years, it’s probably just going to keep going up at a steady pace over the long haul. Not to mention it pays a dividend of about 2.75%
Number two in the space is Entergy (ETR) which also has done nothing but go up over the last several years. You see in the chart below that the stock broke out from a base back in July and has run up nearly 30% since. It’s too extended for my liking at this point but if you can get it off the 50 day moving average, it might be a great time to add a small position.
Because of heavy regulation and cost to build new nuclear facilities in the US, there just aren’t many US players in the nuclear utility space.
There are more investing options with the uranium miners and for this I’d like to refer you to two excellent articles on the uranium mining industry written by James Finch of StockInterview: Why the US Needs a Nuclear Renaissance & In the Case of Uranium Stocks, Smaller May Be Better
The big gorilla of uranium miners is Cameco (CCJ) which has seen its stock price weighted down recently after flooding at Cigar Lake, a major mining facility. If you’re looking for the biggest, least speculative play, the stock may soon off a decent entry point. A quick technical analysis of the chart indicates it will probably spend more time going sideways and possibly even retest the November lows around 31. If it hits that level, I’m backing up the truck for the long haul. From a technical standpoint, Energy Metals (USU) and USEC (USU) currently offer the best profit potential over the next several weeks. Others to consider are Fronteer Development (FRG) and Uranerz Energy (URZ)
If you’re willing to play the Toronto Stock Exchange, there are many more opportunities but depending on your broker, you’ll most likely pay much higher commission fees. Another thought would be to play theETF’s of the two big mining economies – Canada and Australia, but both the Ishares Canada (EWC) and Ishares Australia (EWA ) are concentrated in financials. Although uranium mining is currently a small chunk of their business now, big Australian minerBHP Billiton (BHP ) should generate a larger portion of their revenue from uranium mining in the next few years as India, China and Russia continue to move towards cleaner energy solutions. An interesting fact: Australia doesn’t currently use an nuclear power of its own!
*Additional Articles and Resources related to nuclear utilities and uranium mining *
How Stuff Works – Nuclear Power (article)
9 Ways to Play the Nuclear Power Surge (article)
America Warms Up to Nuclear Power (article)
Uranium Stocks Blog
Uranium Miner (website)
Uranium Miners Join Forces (news)
China Going to the Moon (news)
Environmentalists Long on Concerns, Short on Solutions (article)
Japan Nuclear Power Steams Ahead (news)
South Africa Secure Uranium for Nuclear Energy (news)
Perspectives on Uranium Part I (recommended reading)
Perspectives on Uranium Part II (recommended reading)
China Says Global Warming in Hands of Richer Nations (news)
3 Australian Uranium Miners You Should Know (blog)
Coming Next Week: A Look At the Solar & Wind Industries
Next week, I’ll conclude my series of articles on investing in alternative energies with Part III, taking a look at the solar and wind industries. In my research so far, the general consensus is that solar and wind are a few years off from making significant contributions to our power needs and in the mean time we’ll need to continue using "dirtier" solutions of coal, natural gas and nuclear solutions.
Legendary Oil Investor T. Boone Pickens Thirsty for Water Rights
 If legendary oil investor T. Boone Pickens is as successful investing in the water industry as he was investing in oil, it may pay to follow his lead. I’ve written on more than one occasion here about the potential for investing in water companies in the next few years along with several others. Chris Mayer of Daily Wealth recently wrote the following article about the emerging demand, shrinking supply of usable water and the profit potential of investing in water rights.
A Refreshing Idea
By Chris Mayer
He’s a member of the coveted Forbes 400 with an estimated net worth of over $2.7 billion. The Oklahoma native built a fortune on buried treasure – namely, oil and gas. He is the founder of Mesa Petroleum, which he started for $2,500. In its first year, it netted $435,000 in profits and eventually became a billion-dollar enterprise. He was also involved in a bunch of hostile takeovers of oil and gas companies – Gulf, Phillips, and Unocal.
Now 78, the old billionaire has a new buried treasure he’s accumulating – water rights.
Do you have a guess who this cagey guy is?
He’s T. Boone Pickens. Yes, that T. Boone Pickens. And he’s gobbling up water rights in Texas.
Pickens’ new company, Mesa Water, has been buying up ground water rights in Roberts County, Texas – 200,000 acres in all. He says that over a 30-year period, he expects to make more than $1 billion on his investment of $75 million. (Which means he’ll be able to buy himself a very nice present for his 108th birthday!)
Pickens wants to take the water from the Ogallala Aquifer and pump about 200,000 acre feet of groundwater annually to El Paso, Lubbock, San Antonio, or Dallas-Fort Worth – for a price, of course.
This price would depend on how far the water needs to go. El Paso would pay around $1,400 per acre foot, while Dallas would pay $800 and San Antonio more than $1,000.
Acre feet, by the way, is a common industry metric. Basically, an acre foot of water is the amount of water required to flood a plain of 1 acre to a depth of 1 foot. Generally speaking, 1 acre foot of water can support two families of four for one year.
Pickens has no qualms about charging people for water and has a ready quip for those who think it wrong to do so. “I know what people say – water’s a lot like air. Do you charge for air? ’Course not; you shouldn’t charge for water,” says he. “Well, OK, watch what happens. You won’t have any water.”
Of course, Pickens is right. Many others are coming to the realization that water is too cheap. Hence, water rights are a great buy today.
As an individual investor, you can’t trade water rights very easily. But you can invest in a company that owns almost as much water as Pickens does – and actually, the acre feet that this company owns are more valuable than what Pickens bought. MUCH more valuable…
I’m talking about PICO Holdings (PICO).
The Rio Grande isn’t as grande as it used to be, and the Colorado River now turns to dust before reaching the Gulf of California. The once-plentiful sources of water in the American West aren’t as plentiful as they used to be. So it’s little wonder that water rights are becoming a hot commodity.
I think the value of water rights in the West will continue to soar, which is why I’m fond of PICO Holdings (PICO). The company owns 134,130 acre feet of water rights in Nevada and Arizona, plus a small amount in Colorado. In the pipeline, so to speak, the company seeks approval for an additional 42,800 acre feet of water in its Nevada lands. The company is constantly looking to acquire new water rights. It does this by legally establishing water rights in property it already owns, or by purchasing outright already established legal water rights.
Of all the places to own water rights in this country, you could choose no better than Nevada and Arizona. That’s because these states have among the highest population growth rates in the country and, subsequently, also have among the highest new home construction – both are incredibly bullish for the value of water rights.
To give you some idea of the value, let’s look at recent transactions. Keep in mind, though, that like other types of real estate, these numbers are not comparable across the board. In other words, water rights closer to end-users are worth more than water rights that are far away. Also, senior water rights are the most valuable kind. In some cases, there are several water rights on the same water resource. In these cases, the most senior right is the most valuable – because in the event of drought, it’s the last water right to go.
With those caveats in mind, let’s look at a couple of transactions. In Nevada, Vidler and Lincoln County made a sale for 2,100 acre feet of water for a price of $7,500 per acre in October 2005. In Coyote Springs, also in Nevada, water rights sold for $6,050. In Arizona, Harquahala Valley water rights sold for $2,200 per acre foot.
That gives you a sense for the range. How high can prices go? Well, over the next few years, I wouldn’‘t be surprised to see water rights climb to $10,000 per acre foot in the arid states of Nevada, Arizona, and New Mexico.
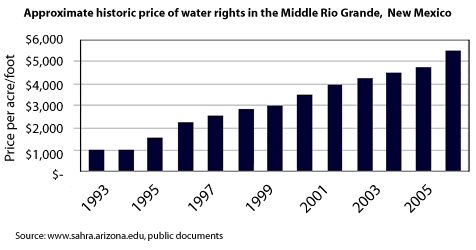
But before getting too far ahead of ourselves, let’s take a look at PICO’s current value. Assuming a value of $3,500 per acre foot for its water rights, times 134,130 acre feet, you get about $469 million, which is greater than PICO’s current enterprise value. But this figure does not include the 42,800 acre feet in Nevada that PICO expects to obtain.
Another point I should make is that PICO also owns a storage facility capable of storing up to 1 million acre feet of water. Currently, the company is buying water and storing it. The company has stored the equivalent of about 90,000 acre feet of water. I haven’t counted any of this, which could bolster the valuation even further.
And of course, I haven’t said anything about its investment portfolio or land and other interests. But you can see the margin of safety in this stock.
Now let’s go back to those water rights for a minute. Based only on PICO’s existing water rights of 134,130 (and ignoring any rights that it expects to obtain), every $119 per acre/foot increase in the value of its holdings would add $1 per share to the value of PICO stock.
So if you start to play around with projections and make some upward adjustments on the value of water rights over the years – well, you can really get some ridiculous numbers. At $10,000 per acre foot, for example, PICO’s existing water rights would be worth $84 a share!
T. Boone Pickens thinks he’ll earn $1 billion on his $76 million investment – or basically 13 times his money. PICO – already in this business, with substantial expertise and a portfolio of more valuable water rights – could do even better.
—————————————————
Looking at the chart of PICO, it looks like water rights investing is crossing the radar of more investors. The stock recently broke out from a one and a half year base to a new all time high. The break out was accompanied by very good volume, indcating good momentum and strong potential for future gains in the relative short term. However, I’m sure the positive Daily Wealth article had something to do with the recent surge. This is a thinly traded stock and prone to big movements following an article from a popular newsletter like Daily Wealth. What I’d do is look for the stock to digest these gains a bit and return closer to 36 – 37 before considering a position.
Where’s the Big Stock Market Money Flowing? A Look at My System For Tracking Sector/Industry Rotation
| Rank | 10 Day Performance | 20 Day Performance | 30 Day Performance |
| 1 |
Electronics Stores (0) |
||
|
2 |
Home Furnishings & Fixtures (0) |
Semiconductor – Memory Chips (0) |
Semiconductor – Memory Chips (0) |
|
3 |
Processing Systems & Products (0) |
Major Airlines (0) |
Networking & Communication Dev (0) |
| 4 |
Processing Systems & Products (0) |
Office Supplies (0) |
|
|
5 |
Residential Construction (0) |
Electronics Stores (0) |
Processing Systems & Products (0) |
|
6 |
|||
|
7 |
Appliances (0) |
Appliances (0) |
|
|
8 |
Food Wholesale (0) |
||
|
9 |
Toys & Games (0) |
||
|
10 |
Recreational Goods – Other (0) |
||
|
11 |
Food Wholesale (0) |
||
|
12 |
Major Airlines (0) |
Residential Construction (0) |
Drugs – Generic (0) |
|
13 |
Recreational Goods – Other (0) |
Food Wholesale (0) |
|
|
14 |
Home Health Care (0) |
||
|
15 |
Lodging (0) |
||
|
16 |
Specialty Eateries (0) |
||
|
17 |
Dairy Products (0) |
Electronics Stores (0) |
|
|
18 |
Application Software (3) |
||
|
19 |
Movie Production – Theaters (0) |
Networking & Communication Dev (0) |
Diversified Computer Systems (0) |
|
20 |
Home Improvement Stores (0) |
Broadcasting – Radio (0) |
Important Note: Industries in bold with a number next to them indicate that there are stocks in the SelfInvestors Breakout Tracker from that industry. The number indicates how many. Stocks in the Breakout Tracker are the fastest growing companies in the world that are near a breakout from a base or they have already broken out from a base.. These companies are the leaders of their industry. So this table provides a great way to find leading stocks of leading industries in just minutes each day. Very powerful indeed!
When I’m scanning this list, I’m looking for two things in particular – an overall theme and industries with lots of leaders. By theme I mean broader sector such as technology, medical, commodities or financial. What is the theme for this market currently? Well, it’s certainly not oil anymore! For the past couple years this top performing industries list was dominated by oil related industries, metals and heavy machinery. It was a commodity boom. A couple of months ago the commodity related industries slowly started disappearing from this list until eventually there were none. What I began to see was were more technology related names popping up.. something that had not been happening for a long time. It prompted me to bring it to the attention of my subscribers on August 20th, 2006 in the Weekly Market Report.
|
August 20th 2006
"The market has a way of pulling off surprises and a surprise is exactly what we got last week as inflation came in much cooler than expected which contributed to 5 straight days of market gains. Taking a look back, two big themes come to mind. First and foremost has been the lack of buy volume during the 2 days of big rallies.. it’s something I mentioned on a few occasions in the MidDay Market Updates last week. It looks like institutions are being very cautious here and rightly so. One good economic number doesn’t make a trend and by jumping in prematurely can be a recipe for disaster (remember, institutions can’t unload positions quickly like the small investor). The second big theme of the week was the shift of money from commodities to tech. Many tech companies began to emerge from the dead last week and may prove to be the backbone of any new rally. Pay close attention to technology shares in the coming weeks. It’s still too early to start seeing a barrage of high quality tech breakouts, but in a few weeks this may be where the big money is made. As far as economic numbers go, it’s going to be a light week but Iran’s formal response to the nuclear incentives package may be a market mover on Tuesday. I’d expect to see the market digest recent gains and possibly retrace the entire move. Look for decreasing selling volume on down days as a sign that the market continues to get more bullish." |
In order to find out where the big money is flowing I prefer to look at the 20 day time frame first and then branch out to the 10 and 30 day time frames to confirm. The 10 day is a bit short and may just indicate an oversold bounce while the 30 day may be a bit long and you may have missed the bulk of the move. So, the 20 day provides a nice starting point, then I can look at the 10 and 30 day performance to see if it’s performing well on those time frames too. If it is, even more reason to focus your attention on that particular industry/sector.
So in this example, looking at the 20 day performance I’m not seeing a dominant theme such as mostly retail or mostly technology, but there are areas of strength worth noting. Since nothing is really jumping out at me on the 20 day timeframe as far as an overall theme, I’ll scan the 10 and 30 day timeframes as well to help put together an idea of where money is flowing right now. Here are some notes I would be taking:
- There are two semis industries in the top 6 of the 20 day time frame – Memory Chips & Broadline. What really jumps out is that several semiconductor industries appear in the top performances over the past 30 days as well – Memory Chips, Integrated Circuit, Broadline, Equipment & Materials and Specialized. Clearly, semis are showing considerable strength, so I’d be looking for the leaders in this industry and putting money to work at some point. However, considering that many appear in the 30 day performance, may need to pull back some. The trend may be a bit overdone in the short term.
- There are quite a few retail, consumer related industries in the table. With commodity prices plunging, rate hikes on hold and evidence of a soft landing in the economy, the market probably feels that the housing downturn won’t destroy consumer purchasing power too much. In the Top 20 column I see Catalog & Mail Order Houses, Appliances, Toys & Games, Auto Parts Stores, Recreational Goods, Specialty Eateries, Apparel Footwear and Department Stores. This trend also appears on the 10 and 30 day time scales as well.
- Housing Related stocks are coming back. It’s very early in the trend, but housing is emerging as a sector of strength with Residential Construction making an appearance at position 12 in the 20 day time frame for the first time in probably a year. Notice in the 10 day time frame that Home Furnishing & Fixtures (2), Residential Construction (5) and Home Improvement Stores (20) appear. With 2 consecutive pauses in rate hikes, the market is putting some money to work in this sector. However, considering past leaders rarely lead a new market rally, this run is probably an oversold bounce and not sustainable over the long term.
- The Investment Brokerage industry contains 12 leading stocks that are near a breakout or have already broken out! It’s number 4 in the 10 day performance table but doesn’t appear anywhere else, so it’s an emerging trend that may be too early to jump into, but absolutely worth looking at. I’ll go ahead and do that now and see that it may not be too early to nibble a bit in this industry. The top rated stock in this industry is Blackrock (BLK) and it already broke out on September 13th and is pulling back into a buyable range. A couple others worth taking a look at include Knight Capital (NITE), TradeStation (TRAD) and Charles Schwab (SCHW). I’ll put these in a watch list and look for a good entry.
So in summary, based on the performance tables I’d be focusing on technology (particularly semis) and retail in my overall strategy for initiating long positions and nibble a bit in the leading brokerages.
Using ETF Analysis to Gauge Leading/Lagging Industries
Using pure price performance can no doubt be valuable as we’ve seen by the amount of information that can be gleaned from the simple table above. However, pure price performance doesn’t quite give the whole picture. Without studying the volume behind those price moves, we have no idea how much momentum is behind the move. This is extremely important because the amount of volume behind a price move validates the move in that an unusually large number of traders are willing to pay increasingly higher prices.
So how can we study the volume moves in an industry? Through the analysis of Exchange Traded Funds (ETFs) which trade like individual stocks and provide volume data throughout the day. Unless you are brand new to the investing world, you have no doubt seen the explosive popularity of this type of investment vehicle. Simply put, an ETF is like a mutual fund that can be traded on the open market throughout the trading day. By tracking the price AND trading volume movements of ETF’s that seek to emulate an industry or sector, I can get a decent picture of just where in the market the big money is flowing to. There wasn’t enough trading volume in these instruments for an accurate analysis just a couple years ago, but now they provide a good representation of the health of industries and sectors. By using a fairly simple formula (which I call the Demand Indicator) that awards points for high volume buying and low volume selling and subtracts points for high volume selling and low volume buying, I’m able to see where the money is flowing. Here at SelfInvestors.com I track this demand over 15 and 30 days which I believe provides a good time frame for tracking trends.
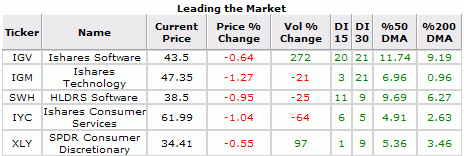
The screenshot below shows a portion of the Market Snapshot page (which will soon be available to all members of SelfInvestors.com) which shows the top 5 leading industries according to demand (measured through price and volume) over 15 and 30 days. Industries are ordered by the combined DI score over 15 AND 30 days (the higher the scores, the greater the demand). The table also shows the price % change and the volume % change from the average for today as well as the % from the 50 and 200 day moving averages. The table confirms what we saw in the price performances table above in that technology and consumer related industries are leading this market higher. While retail isn’t shown here, I have a suspicion that it’s ranked 6 or 7 (it has appeared on this list at times in the last couple weeks).
While this article focuses on finding industry strength for investing long in a bullish market, the lagging industries section provides a look at industries traders are dumping en masse which may provide fertile ground for short opportunities. Here’s a screenshot showing the lagging industries on September 21st:
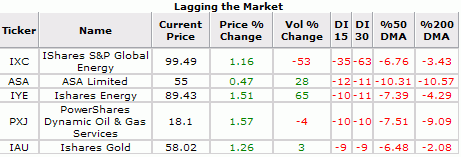
Not much surprise here. The oil and gold industries have been getting crushed and those industries have appeared in the lagging industries section long before the meltdown actually began. Yes, price and volume movements are a leading indicator! Notice the DI scores for the Ishares Global Energy. Typically, the DI scores will range between -20 and +20 so there is some mighty heavy selling going on. Granted it’s a thinly traded fund so is prone to more wild movements, but still a good indicator of the amount of money pouring out of oil stocks recently. It should be noted that here are strong technical support levels on the horizon and you have to believe that OPEC will step in at some point and do all it can to halt the plunge.
So there you have it.. my characteristically wordy (not in a nutshell) explanation of how I go about tracking industry and sector rotation. This is a process I’ve been honing for awhile now and believe it’s important for all traders to have their own "process" for researching the markets, but hopefully you can take away some ideas and hone your own for an even better tracking method 🙂
Oil Slick – Is the Worst Over?
As good as January was for the oils, February has been equally as bad. Corrections like this always bring on the "is the run over" questions, so lets take a look at what the charts are telling us to avoid any irrational conclusions. I’ve marked up a few ETF charts that I think are good representatives of the oil industry.
Below are the Energy Ishares ETF (IYE) and the Oil Services Holders Trust (OIH). The thing that stands out to me the most is the consistent pattern over the past year or so. You see a very consistent trend of a sustained rise followed by a fairly sharp sell off to support (which has been close to the 50 day moving average, but drawing an upward trend line off the lows looks like a stronger area of support). The sell off portion of the pattern is what we’re seeing now. Based on the previous pattern it stands to reason that the bulk of the sell off is complete with the potential for further downside risk in oil related issues of 3 – 5%.
The Oil Services Holders Trust (OIH) is holding up much better and was able to find support at the 50 day moving average on Friday. Whether it can hold there is anyone’s guess, but considering the tremendous move over the past few months and recent selling pressure, it wouldn’t at all be surprising to see it break that support eventually and test that trend line around 125.
The Energy Ishares ETF (IYE) is exhibiting more technical damage. The selling volume overshadows buying volume and it remains submerged below support of the 50 day moving average. Expect to see some oversold buying very soon, but I think ultimately it tests that trend line around 86 – 87.
The market is currently pricing in rising inventories in oil and natural gas as well as decreasing demand for ’06. The wild card is really the Iran situation which could go either way at this point. Certainly, oil will rise quickly if it appears that the situation is getting messy. However, if Iran cooperates (that may be the first time that Iran and cooperates was used in the same sentence), keep an eye on those trend lines for support.
Samsung providing the “flash” in Ipod nano?
Having just accidentally blitzed the detailed first version of this post, I’m in no mood to recreate it in detail, so I’ll be brief and to the point (which would be a first).
With the announcement of the Ipod nano, Flash memory is stepping to the forefront as a viable (OK, much better) alternative to the hard drive. Smaller, more efficient, no moving parts (less heat) and able to withstand rugged environments. As cost comes down and storage capacity increases, we’ll see Flash memory make its way into an increasingly large number of consumer products. Flash based laptops anyone?
So from an investment standpoint, how to profit? While there has been no official word on just who is supplying all that Flash memory to Apple, the persistent rumor is that Samsung is that supplier. There are reports from industry analysts that Samsung has been courting Apple and that Apple has purchased 40% of the NAND Flash inventory for the second half of the year. Of course, its possible that Apple has inked deals with more than one supplier to ensure supply for the Christmas season, but it seems more than reasonable that Samsung would be the major supplier. With profit margins the highest in the industry at 45%, its thought that the company has the wiggle room to provide steep discounts to Apple.. something other suppliers could not do.
Here are links to a few articles discussing the relationship:
http://news.yahoo.com/s/nm/20050831/tc_nm/asia_chips_dc
http://www.tomshardware.com/hardnews/20050907_145240.html
Unfortunately, there is no way for US investors to invest directly in Samsung. The best option that I can see is through the Ishares South Korea ETF (EWY), in which Samsung makes up 23%. It broke out from a nice looking base at the beginning of July and recently bounced off support of the 50 day moving average. It currently sits 10% above that support line.
Homebuilders Hanging On.. Barely
On February 23rd, Robert Toll, the CEO of Toll Brothers defiantly declared on CNBC after reporting blowout earnings that "shorts would get crushed" (it should be noted that the Robert cashed in 110 million just 2 days following – in fairness he cashed in the same amount two months earlier so could be part of a sell program). Since that day, shorts have been anything but crushed.. and are on the verge of racking up more gains if key support levels can’t hold. The stock has been digesting recent losses and consolidating in a tight pattern below support of the 50 day moving average. Based on the deteriorating technicals, its highly likely the consolidation will give way to more selling and and provide a clear short entry.
Taking a look at the Housing Index, it too is hanging on to the next level of support around 475 after slipping below the 50 day moving average. Its clearly finding resistance here and I wouldn’t expect 475 to hold either. Next stop – 450.
Stocks of a few other homebuilders show similar scenarios.. barely clinging to support. KB Homes still has support of the 50 day moving average, but I can’t imaging it hold there for much longer. Support levels on the way down tend to occur in 10’s and will provide clues to the health of the stock.
The chart of Hovanian looks almost identical to the chart of the housing index – below support of the 50 day moving average, but holding at previous areas of consolidation and psychological support at around 50. A drop below this support area would signal that it’s headed for 45, which is the next area of support to watch. Note the heavy institutional selling throughout 2005.