Category Archives: Blogroll

helpful stock trading insights and lessons

Bear Stock Market Strategies: Shorts, Gold, Bonds, Tips & Other "Options"


The following post is provided exclusively to readers of SelfInvestors, courtesy of TheCorrectCall.com.  Some great ideas for safer investing strategies in a bear stock market.  Previously, they recommended a gold trade which I agree with 100%.. I recently added a gold play in the Self Investors Model Portfolio which did quite well yesterday.

:::::::::::::::::::::::::::::::::::::::::::::::::::::::::::::::::::::::::::::::::::::::::::::::::::::::::::::::::::::::::::

"RBS issues global stock and credit crash alert"
"Morgan Stanley warns of ‘catastrophic event’ as ECB fights Federal Reserve"
"Everything seemingly is spinning out of control"

These are some of the alarming headlines that many of our readers and The Correct Call have read recently. Crashes, Catastrophes, Spinning Out of Control. are these Chicken Little warnings? or are dark clouds gathering and about to unleash a withering financial storm?

The truth is we don’t pretend to know one way or the other. It is vital to remain objective and take what the market gives you. The Correct Call takes a top-down approach and sees what the market is saying and invests accordingly. We are not afraid of negativity or overwhelmed by optimism. As a result, we believe there are always great opportunities out there no matter the environment.

That being said, many of our readers have asked us "what can I do to protect my portfolio in this market?" So we did our research looking for investments that have little, no, or negative correlation with US stocks; meaning, investments that don’t necessarily move in tandem with stocks. They have their own free will, so to speak.

We have identified 7 things you can do to protect your portfolio RIGHT NOW!

  1. CASH is KING:
      Don’t be afraid to move some money to the sidelines. Selling losers makes a lot of sense. It can take years for many of these companies to recover. We are still waiting for many of the tech darlings of the late 90’s and early 2000’s "to get back to what we paid for them." How long before Qualcomm gets back to $88, let alone $1000.
      Some of the things you should be looking at to determine which of your stocks are cash candidates include:

        Earnings Misses Bad News Management Shake-Ups Deteriorating Fundamentals Relative to its Peers Desperate for an Infusion of Cash

      Once you have decided which stocks make sense to sell, you might consider matching your loses with some of your gains. Don’t be greedy, eventually today’s winners will give way and be replaced by the next hot thing.
      When the markets – be it Real Estate or Stocks – hit rock bottom, you will need cash on hand to take advantage of these bargains. It is in these discarded investment misfits that triple digit returns will be found.

  2. BUY GOLD:
      Investors worried about mounting losses can possibly stem the tide by adding Gold to their portfolio. According to a study titled "Is Gold a Hedge or a Safe Haven? An Analysis of Stocks, Bonds and Gold" by Dirk G. Baur and Brian M. Lucey, gold is an "ideal venue to park money during periods of uncertainty."
      Their analysis found that in the US, Gold and stock returns are negatively correlated and that Gold acts as a hedge at all times. That means when stocks go down, Gold usually goes up.
      Conservative investors should buy iShares COMEX Gold Trust (IAU), streetTRACKS Gold Trust (GLD) or iShares Silver Trust (SLV). More aggressive investors might consider owning individual stocks or DB Gold Double Long ETN (DGP). DGP’s objective is to give its owners twice the return of Gold’s price changes. With DGP, if Gold moves up 5%, investors can expect see a return of 10%.
  3. INVEST IN TIPS:
      Worried about inflation? You should be, but inflation is negatively correlated to stock. When inflation is on the rise, stocks tend to fall. Here is how you can profit.
      Treasury Inflation-Protected Securities, or TIPS, provide protection against inflation. The principal of a TIPS increases with inflation and decreases with deflation, as measured by the Consumer Price Index. When a TIPS matures, you are paid the adjusted principal or original principal, whichever is greater.
      TIPS pay interest twice a year, at a fixed rate. The rate is applied to the adjusted principal; so, like the principal, interest payments rise with inflation and fall with deflation.
      One of easiest way to invest in TIPS is through iShares Lehman TIPS Bond Fund (TIP).
  4. NON-DOLLAR BONDS:
      Non-dollar denominated bond funds have little correlation with US stock prices. Again, the importance of this is that the performance of foreign currency based bond portfolios and US stocks are unlinked and move up and down for different reasons. International bond exposure should help limit your portfolio’s volatility and preserve purchasing power when the dollar is falling.
      One such no-load fund is the T.Rowe Price International Bond Fund (RPIBX) . The fund’s objective is to provide high current income and capital appreciation by investing primarily in high-quality, non-dollar-denominated bonds outside the U.S. Right now 91.2% of the fund is composed of foreign bonds with more than 80% rated "A" or better.
  5. MANAGED FUTURES:
      Managed Futures accounts are like mutual funds as they pool investors’ money into one portfolio. The portfolio managers have the discretion to invest long or short in futures contracts within equity indexes like the S&P, NASDAQ, & Dow, commodities like soy, corn, coffee, sugar., foreign currencies, and US government bond futures. Most of these accounts rely on proprietary quantitative models, more commonly known as "black box" strategies.
      One of the purported advantages of managed futures is that these accounts have historically exhibited low or even negative correlation with US stocks and are capable of producing gains under any market conditions.
      Some of the drawbacks of these portfolios have been:

        Large initial investment required. Limited liquidity as typically there is a minimum holding period before having the ability to withdraw funds. Very little in the way of information.

      Fortunately, Rydex Funds have solved many of these problems. Starting at just $25,000, investors can now own Rydex Managed Futures Strategy in 3 classes: A Shares (RYMTX), C Shares (RYMZX) and H Shares (RYMFX.)

  6. COVERED CALLS:
      Covered Calls are an options strategy whereby investors who own stock sell call options against that stock. For example, Joe Investor owns 1000 shares of IBM, he writes or sells another investor the right to acquire his shares at a set price, called the strike price, usually on, but sometimes before a specific date, otherwise known as the expiration date.
      For our example, the IBM July 125 Calls are trading at $2.90 per contract. Each contract represents or controls 100 shares of IBM, 10 contracts equals 1000 shares. As a covered call writer, you sell the calls and receive $2,900 (100 * $2.90 * 10 contracts). The $2,900 is deposited into your account.
      Two things can happen when the options expire in July:

        We will start with the worst case scenario. IBM stock goes higher than or equal to $125. In this case, the investor who owns the option will buy it from Joe at $125, but he gets to keep the $2,900. If Joe wants to keep the stock, he will have to buy the options back, known as covering a position. In most cases investors will have to pay more than the premium received when selling the options.
        In the 2nd scenario, IBM stays under $125 per share. In this situation Joe keeps his IBM shares and, if he likes, can sell more options and collect more money.
  7. SHORT ETFs:

    The objective of a short ETF is to go up in value when the underlying index goes down. For example, if the NASDAQ 100 index were to drop 10%, the short NASDAQ 100 ETF would rise 10% in value. Some of these funds offer leverage and produce twice the return of the index.
    ProShares offers a robust offering of both types of short ETFs. For a complete list visit http://www.proshares.com/funds?products=98616&fundType=
    . Keep in mind, when the markets go up, these ETFs WILL LOSE VALUE.

The Correct Call suggests that conservative investors commit up to 10% of their entire portfolio to a mix of these strategies. More aggressive types can allocate closer to 30% of their equity holdings into these hedges.

Future Profits Through Lessons of History

2DIME’S INVESTOR NOTES
Wednesday, November 21st, 2007
 
“On Average, History Will Repeat Itself.


Wow! What do you think about the recent moves in the Markets? Truly, the only constant is change. As for my personal efforts to stay ahead of the crowd, I’m about even with my trades for the past two weeks. Gains off setting give backs. The advantage of picking good stocks in good industries at good buy points, they weather the storms of market fluctuations nicely. Its great to even see some of them motoring onward and upward while "Rome burns."
 
During the first week of November, I was feeling some relief as the markets were recovering from the late October pullback. I pondered whether the expected last quarter rally was at hand and wondered if we would see new highs. I made a mental note that GOOG and AAPL looked a bit Over Bought…..with rising prices during the previous week BUT with declining Volume. Hmmm…..
 
I was trying to refresh my memory about the average price of stock during the last 52 years that has historically made the greatest run-up. I recollected it was around $48; but wanted to pin it down. I guess the need for precision is an old carry over from my days as a professional pilot.
 
 Where did I see that?  It was in William O’Neil’s book “The Successful Investor” ( pg.111)

As I was thumbing through the book, I noticed a chart of AOL from 1999 and thought….That sure looks like GOOG. It was talking about how to recognize tops and was using AOL as an example of an “Exhaustion Top.” I took another look at GOOG and noted on the chart:
 
“ Same Pattern as AOL 1999
1. 7-8th Base formation
2. Highest daily gain 19 on 10/30/07
3.Prices continuing to rise on declining daily volume
4. Exhaustion Gap 10/23 – 10/24?”
 
Later in the trading day, on November 5th,  I thought about how important studying past performance of individuals and stocks is to gaining an understanding of the markets and the trading craft. So.. I trimmed off a few profitable trades (Rule of thumb is to take ½ off when your gains hit 100%) and purchased high DELTA Puts on GOOG, AAPL, DIA and the QQQQ’s. With the uptick on the 6th , the little voice of greed in my head started chattering and vacillating and then became quiet on the 7th as the correction swooped in and gave the FED another opportunity to inject cash into the marketplace. (On Thursday November 15th they injected $47 billion in temporary reserves into the banking system, its biggest injection since September 2001.)
 
Granted Google is not AOL and 2007 is not 1999; but it sure is gratifying to see stuff happen after you think it might and take a few precautionary steps “just incase.”
 
The puts on GOOG, AAPL, DIA and QQQQ helped to blunt some of my less favorable plays. And yes, golly darn, I exited before I thought I should have. And now, a week later it is a moot point. Cause I’m all about Calls.
 
As I said, “The only constant is change;” but it sure is helpful when that change repeats itself. Now! Where’s the BULL?
 
Cheers, 2Dimes / Barry Brush (To contact me send an email. To support@selfinvestors.com and Tate will make sure I get it.)

Case Study: Trading Cardica (CRDC) For a 45% Profit

Extraordinary profits can be had in low priced momentum stocks and they aren’t too much riskier than any other stock if you’re sure to keep your losses small by dumping the position on any sign of weakness. Any increase in risk is certainly more than made up by the increase in profit potential.

I call these kinds of trades Quick Strike Profit (QSP) plays here at SelfInvestors.com but in general they are shorter term swing trades in high momentum, lower priced stocks. I use them when the time is right (in a strong market) to accelerate the returns of my portfolio. Gold and Platinum members are alerted to several of these every month when I initiate a trade in the Model Portfolio. One such trade in Cardica (CRDC), yielded a quick 45% profit in just a few hours of trading.

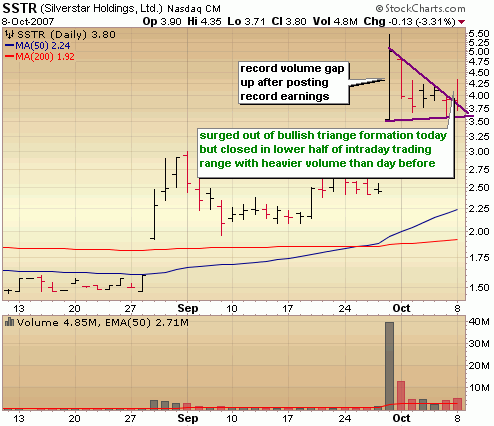
Before I go into the details of how I traded CRDC, I wanted to illustrate an example of how I minimize my losses in these kinds of trades by dumping the position quickly at the first sign of weakness. This was illustrated perfectly today in a QSP trade in Silverstar Holdings (SSTR), which I closed for a small loss.  This morning I issued the following alert on SSTR:

I’m initiating another QSP trade this morning, this time in SSTR.  The stock gapped up to a record high with record volume on Sept. 28th after posting an outstanding earnings report.  The stock has been digesting that gain and now looks poised to begin running again.  I’m in here with a very small $7500 position at 4.07. and am just looking for a quick 20 – 30% over the next several days.

Here’s a look at the chart which shows that the stock surged out of a bullish triangle formation with decent volume.  However, the stock kept pushing lower throughout the day and the selling picked up by the end of the day, sending the stock below $4/share.  When a stock closes in the lower half of the intraday range with above average volume, that is an indication of weakness.  This kind of action almost always results in me closing a QSP trade because it often results in further deterioration.  As I’ve said, I cut my losses quickly in these trades at the first sign of weakness.  When in doubt, get out.  I issued the following sell alert to members before the close today:

SSTR flashed all the signals of another run, but it’s proving to be a false alarm at least at this point. The stock is staging a significant reversal today indicating the stock isn’t quite yet ready to resume the run.  I’m going to go ahead and take the small loss and will look to try again if it flashes a buy signal in the coming days.  The key in playing these is to keep your losses very small and close the trade at the first sign of weakness to avoid large losses.  I’m out at 3.94.

The SSTR trade today shows that sometimes the trade doesn’t work out as you expect.  Take the small loss and move on knowing that another trade will prove to be highly profitable just as CRDC was (which I highlight below).

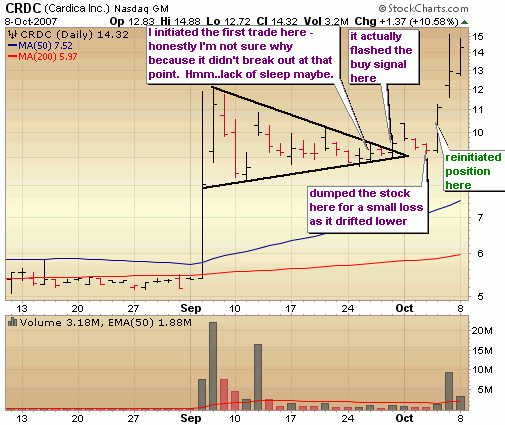
I began featuring CRDC in my #1 Longs List (a new feature of the Gold and Premium membership package) on September 14th as it began to carve out a picture perfect bullish triangle.  CRDC would appear on my #1 Longs List for the next couple weeks when it finally began to move on September 26th.  I issued the following alert:

I’m going to go ahead and play my hand in CRDC, a highly speculative company with a very bullish looking stock chart.  The stock has carved out a picture perfect bullish triangle formation and looks poised for a big move out of this pattern.  The stock has just begun moving with some good volume.  I’m in at 9.34 with a very small position of $7500.  The only reservations I have about this pattern is that it’s too perfect so may be watched by too many making it more prone to failure.  I definitely feel it’s worth the gamble and will have a tight stop in place.

Here’s the chart below.  Looking back on the trade I honestly don’t remember why I initiated the trade for the first time on the 26th because it hadn’t yet cleared the triangle formation yet 🙁 .  Call it over eager, call it lack of sleep but it was too soon to initiate.  As it turned out, I got in at a better price, but you really should wait for a breakout of the pattern.  Two days later, it did just that and looked as if it was ready for the big run, but on Oct 1st stalled out and closed at the low of the day.  Remember that I closed the SSTR trade following a high volume reversal.  CRDC reversed on Oct 1 and closed in the lower half of its intraday range, but it didn’t do so with big volume so I held on for a couple more days.  On Oct 3rd I decided to go ahead and dump the stock for a 1% loss.  I have seen too many trades like this stall out and just drift lower and lower with no real conviction.  I could always get back in if CRDC began to show some life again, so I dumped it and issued the following sell alert to members:

I’m closing my last QSP trade in the portfolio.. in CRDC.  It looked like a couple days ago it was going to bust out for good from its  very bullish looking triangle formation as the stock gapped up in the morning.  It proved to be a false alarm at least for now.  Since then, the stock has stalled and continues to meander lower.  As with all QSP trades, I’m quick to pull the sell trigger if the stock shows any kind of weakness.  No exception here.  I may get in again down the road, but for now it’s best for me to exit with a very small loss and look for stronger positions.  I’m out at 9.27

… and show some life it did!  At the end of the day the very next day, CRDC got a surge of buying and I issued another alert to members:

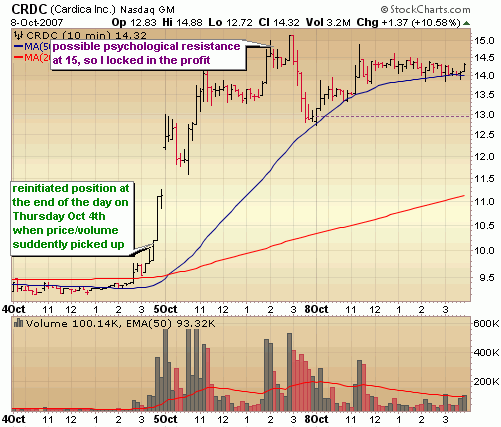
Cardica (CRDC), a QSP trade I exited just yesterday is finding some life here, so I’m going to try again and see if it can break out for good this time.. It looks good and is getting a ton of buying here at the end of the day and is on the verge of breaking big.  I’m in at 10.17 with a small $7500 position.

The chart below shows my entry and exit on the intraday chart.  Notice the big surge in buying at the end of the day on Oct 4th where I re-initiated the position.  Once the stock cleared resistance at 12 the following day, there was no overhead resistance in its path but I thought that a new source of resistance could be at the psychological level around 15 so I was looking to take profits up there.  I wasn’t about to get greedy.. a 45% profit in literally just a few hours of trading is an exceptional move that doesn’t come around everyday.  I issued the following sell alert to members:

It’s time to take the profit in CRDC.. what a 2 day run!  Up 45%.  These kinds of home runs don’t happen very often but the reason I play the QSP trades is because just one of these can really accelerate your returns.  By keeping losses small in these and hitting a home run every now and then you will do extremely well.  I’m out of CRDC at 14.77 and looking for another QSP trade

As the trades in SSTR and CRDC illustrate, trading isn’t always textbook, certainly isn’t always pretty and mistakes do occur.  Hopefully you’ve learned a bit from this case study just as I have.  It’s always a good idea to review all your trades (even your winners) to discover ways you can continue to improve.  Just remember, you can enjoy big gains in the market year after year if you exercise discipline and keep those losses small.

Also keep in mind that the run in CRDC could certainly continue up from there.  Look for some kind of bullish basing action (perhaps a flat base or another triangle formation) and a breakout from that base as an opportunity for another trade.

Swing Trade Case Study – China Precision Steel (CPSL)

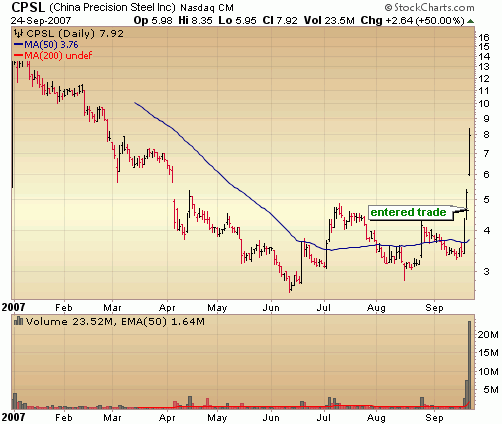
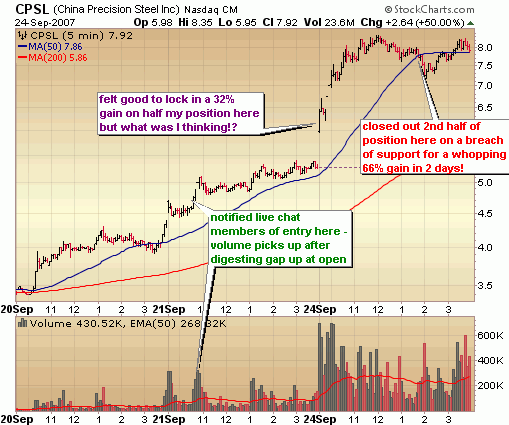
As you know, all of the top Chinese stocks have been on fire.  You can start with Baidu.com (BIDU) (which I featured as Stock of the Day after breaking out a few weeks ago) and go on down the list.  At this point, I’d say the space is getting a bit too frothy with the smaller, more speculative names soaring to massive gains in short periods.  Case in point – China Precision Steel (CPSL), a very small China steel play in a company with highly erratic growth.  It’s a stock that has been in my list of #1 Longs (a new biweekly watchlist highlighting the best trading opportunities that I send to Gold and Platinum members) and was mentioned in the Telechart Live Chat room on Friday as I initiated a position at 4.64.  Below is the daily chart which illustrates the tremendous move over the past 3 days with extraordinary volume.

I was alerted to the move in CPSL on Thursday as it surged above the 50 day moving average but chose to hold off on a purchase until it confirmed the move.  With a gap up on Friday clearing the August highs at 4.29, followed by  tight consolidation and renewed heavy buying in the stock, it was all I needed for an entry signal.  There was certainly enough strength to test the August highs at 4.86 and potentially test the next level of resistance at the top of the gap down way back in April around 5.68 (which also happened to be resistance around the 200 day moving average).  This morning, when the stock gapped up above that key resistance level too, I knew it was on. 

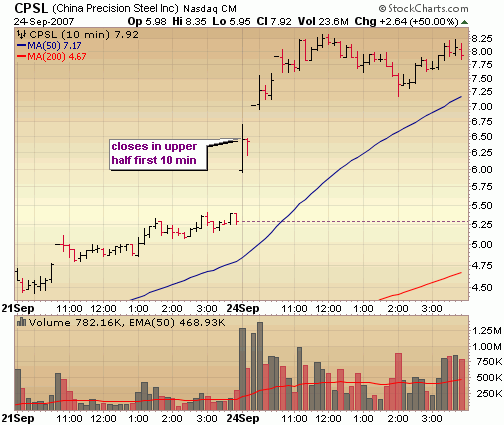
… BUT I made a big mistake!  Instead of sticking to my trading rules, I went with my intuition on this one and decided to lock in profits on half of my position at 6.16 right at the open.  I was the opposite of greedy – I wouldn’t call it fear, but I would call it being too cautious.  The rule that I typically use when deciding to lock in a gain on a gap up is whether the stock closes in the upper half of its range on the 10 minute intraday bar (as shown below). 

This morning, I didn’t let the trade develop at all and it cost me a big chunk of change.  I can’t be too discouraged because the total position was closed for a nearly 50% profit, but I think there are lessons to be learned in even successful  trades as I’ve shown here.  I closed out the last half of my position when it broke through the 50 day moving average on the 5 minute chart.  However, given the amount of volume behind the move today and the fact that it closed near the highs of the day once again, there is a very good chance it could run again at the open tomorrow.  If you’re holding a position overnight, consider not making the same mistake I made at the open today and let the stock complete that first 10 minute bar.  If it closes in the lower half of the bar, you might want to take the profits in this highly speculative stock.

Secondary Offerings & Valuation Downgrades May Offer Opportunity

Beating the market and making money trading stocks year after year is no easy task despite what many will have you believe.  It requires hard work, discipline, emotional control and organization.  It requires an edge.  There are thousands of strategies, chart patterns and tools out there to help you reach your investing goals and there are certainly more ways than one to consistently profit in the stock market.  The key is finding your own way, your own path.  Master the essentials, then over time come up with your own strategies.  Patterns will emerge that you can take advantage of. 

One such pattern that I have found is what I call a "red tag sale".  This happens ahead of the opening bell on news of a valuation downgrade in a top performing stock.  90% of the time, you can throw brokerage price targets and opinions out the window.  The edge and your opportunity comes from taking the opposite position.  A valuation downgrade in a top tier company is nothing more than a red tag sale in that the brokerage downgrades the stock based on valuation, the stock gaps down at the open and you get the opportunity to pick up shares in a high flying stock a bit cheaper.  When looking for these kinds of opportunities take a look at the chart to decide if it’s a good play.  Did the stock recently breakout?  Is buy volume spiking?  Is the stock at all time highs?  If a top rated company recently broke out with big volume and a valuation downgrade pushes the stock back to the breakout point, then that is an ideal situation to get in or add shares.  I wasn’t able to find a good recent example of this but you get the idea.

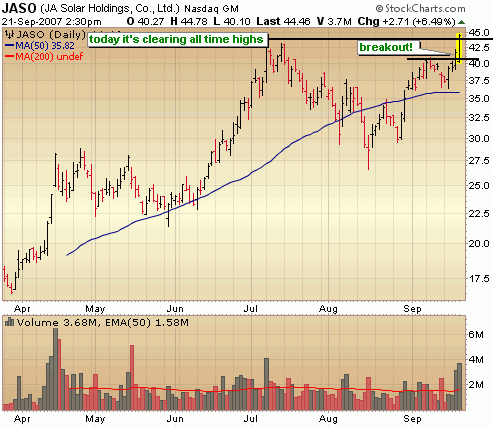
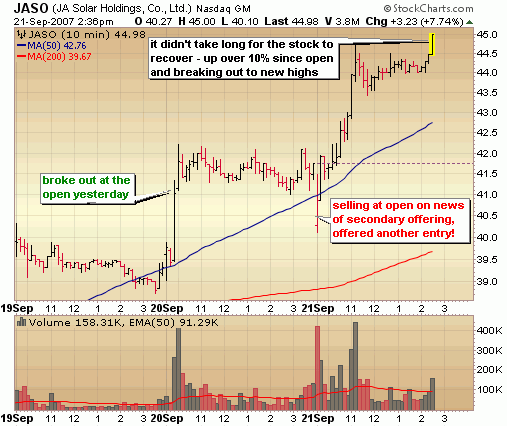
Another situation that I like to profit in involves a secondary offering announcement which occurs when the company offers additional shares for sale.  The dilutive effect of the increase in supply most often results in a sell off in the stock but again this is often temporary in the best companies because the demand is able to soak up the added supply.  This is another chance to pick up shares a bit cheaper.  Again, I look at the chart to see if this temporary dip offers a good entry point to initiate a position for add shares.  A perfect example of this occurred just this morning in JASO, a highly rated solar play.  Yesterday, the stock broke out of a cup with handle base with good volume, but announced last night a registration with the SEC to offer additional shares.  If you missed the breakout yesterday, this news offered a chance to get in near the breakout point!  At this open this morning I notified premium members of the entry point and we’re up over 10% just today as the stock breaks out to new all time highs.

Short Guide to Shorting Stocks

So how does shorting work?  Basically what you are doing is borrowing shares from your broker and selling them at current market price to another buyer in hopes of buying them back (or covering) at a discount in order to return the borrowed shares to the lender and keep the difference, which is your profit.  So, let’s say you short 100 shares of ABC at $10 a share.  So, you’ve borrowed 100 shares, sold them at the market price of $10 and your account would be credited $1000.  If the stock falls, you can buy the stock back at a cheaper price, repay the broker the shares you borrowed and pocket the difference.  So, let’s say the stock falls to $8/share and you buy the shares back (called "covering").  You pay the $800 dollars for the 100 shares, give them back to your broker and you get to the pocket the difference ($1000 – $800 = $200).  However, should you have to cover above $10/share, you will need to use additional funds in order to buy the shares back that you owe to your broker (you lose money!)  Here a few things to keep in mind when selling short:

** You must have a margin account to short stocks, for which you will be charged interest


** Avoid shorting stocks with large dividends or avoid shorting during the ex-dividend date – you pay the dividend


** Short stocks with good liquidity (at least a few hundred thousand shares)

** Avoid shorting stocks that are already heavily shorted to avoid being caught in a short squeeze.   A short squeeze happens when a large number of short traders attempt to cover their position at the same time, driving up the price of the stock quickly.  This is a another reason for sticking to stocks with good liquidity.  If caught in a short squeeze of a stock with poor liquidity, you could get slaughtered because there would be few shares available to purchase in order to cover your short position.  Usually, news in the market will trigger a short squeeze, but sometimes traders who notice a large number of shorts in a stock will attempt to induce one. The importance of liquidity can be felt here too, since the greater the number of shares traded in a stock, the less susceptible it is to manipulation by a single investor or small group of investors.  You can gauge the amount of short selling by checking the short interest in a stock which is expressed as a percentage of shares sold short (calculated by dividing the number of shares short by total shares outstanding).  Of course, the higher the percentage, the greater the short interest.  In addition, the short interest ratio, which is the number of shares sold short divided by average daily volume can indicate the amount of short selling in a stock.  This number is commonly expressed as "days to cover".  The higher the number of days to cover, the greater the likelihood of a short squeeze.  I have found www.shortsqueeze.com to be a good source for this information.

** Your broker may force you to cover the trade if it can no longer lend the shares to you (ie. the lender wants his shares back so that he can sell his position).  This is one big pitfall of short trading and can force you out of a trade long before you are ready and profitable!  If I were to take a guess this happens probably 10% of the time.

** I don’t buy the argument that shorting is extremely risky – it’s based on the notion that stocks can rise to infinite levels (meaning your losses could be infinite), whereas in a long trade your losses are limited because the stock can’t go lower than zero.  Sure, your losses can be endless in a short trade… if you let them!!  Just as with a long trade, it’s critical to practice sound money management by keeping losses small!

** Look for smaller profits in short trades (typically 10 – 20%), with the profit target near the next level of support.

In a future post I’ll have a look at the trade setups I use for shorting stocks.  You can certainly see the kinds of charts I look for in good shorting opportunities in past trades of the day, but I’ll go into a bit more detail.  If there is anything that I may have left out in this mini guide feel free to post a comment.

Getting A Better Entry In the Cup With Handle Base – NVE Corp (NVEC)

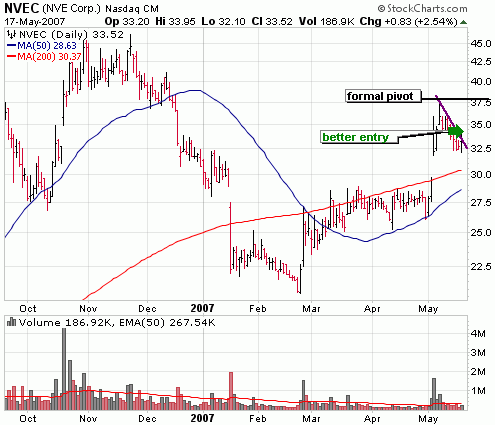
Earlier today, I notified premium members that I was watching NVE Corp (NVEC) for an entry.  The stock has carved out a deep base over the last several months, but is moving again in the right side with volume following their last earnings report.  The formation is what is often referred to as a cup with handle formation.  It’s currently forming the handle with the formal pivot being .10 above the highest point of the handle which in this case is 37.77.  I almost never buy a stock at the pivot point in cup with handle formations, but rather prefer to get in on the first big move out of consolidation from the handle formation.  This is a much lower risk entry as fewer people are initiating positions here. 

You can draw a short downward trend line (the line in purple in my chart below) across the high points of the handle to get an idea of where the stock needs to break from for an entry.  It nearly indicated an entry today after getting a bit of a pop late in the day, but it stalled out in the last hour or so and didn’t quite clear that resistance.  However, today’s move may be the beginning of a much larger move tomorrow and provide an entry.  We shall see.  Given the deep base, which is prone to failure, I’d be looking to exit my position near all time highs around 45.

nve corp nvec cup with handle

Live Trading Room Case Study: Day Trade in Force Protection (FRPT)

With the launch of the new site here at SelfInvestors.com came some new features and membership options, including the option to join me in a private live trading room via Worden’s Telechart service.  One thing I’m going to try and do more often is case studies of actual trades that I discuss with Platinum members in the live trading room.  For those new to trading stocks, many of the nuances of trading can be best understood through specific examples.  The best way to do this is with video and one day I’ll get that software figured out so I can start posting live video of actual trades.  Until then, I resort to the old fashioned way.

force protection frpt logo Today I wanted to highlight a successful day trade in Force Protection (FRPT) (yes, I will highlight some trades that don’t work out too!).. well, actually it was meant to be a 2 day swing trade but I decided to dump the stock given the big run up and the overall market weakness.  I’d much rather lock in a big gain and wait patiently for a pull back to the break out point for another low risk entry.  Force Protection (FRPT) is a stock that has been in my watchlist for some time and I had a real time alert set on it at 24.50 so I’d be alerted to any breakout move, which it got today:
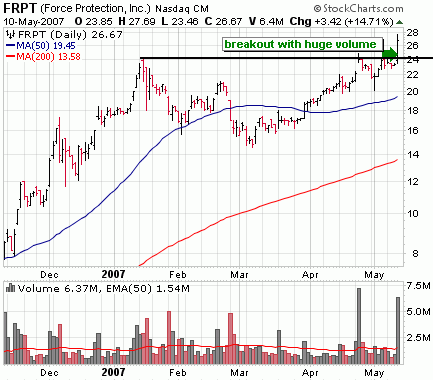
force protection (frpt) breakout daily

Although the stock was near the top of the SelfInvestors Breakout Tracker and in my Telechart watch list, I had forgotten about it.  I was reminded of it a couple days ago by one of my members and thought that given the recent moves in Armour Holdings (AH) and Spartan Motors (SPAR), it was probably just a matter of time before it broke to a new all time high.    Yesterday morning, while reading through the alerts at Fly On the Wall, I noticed an alert on FRPT indicating the following:

Unterberg highlights a story in Army Times that says the Army is expected to ask for $9B to purchase 9K MRAPs in FY08 and additional money to purchase 8.7K in FY09. CEUT believes this provides excellent visibility for FRPT through 2009 and they expect shares to trade higher. :theflyonthewall.com

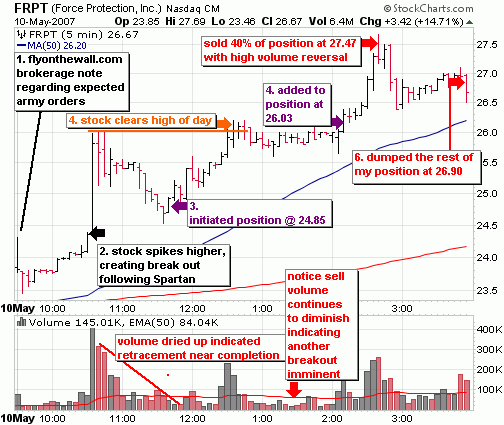
I thought that the Army Times story could move the stock so I double checked to make sure the alert was set up correctly in Telechart and went about my business.  It was about an hour later that the stock really began to move, surging about 10% in 5 minutes… but not on the Army Times story.  News was released that Spartan Motors (SPAR) received a large contract, a portion of it from FRPT.  That indicates business is booming for both companies and got ’em movin.  That triggered my alert, so I added the ticker to my brokerage real time watchlist/order screen and pulled up the real time 5 minute intraday chart of Force Protection (FRPT) in Telechart to prepare for a trade.  I NEVER chase a move like the one in FRPT at around 10:45AM EST.  Almost always the stock will digest the gain and retrace much of the move (sometimes all of the move, as was the case here).  Now is a good time to take a look at the 5 minute intraday chart to better explain how I played it.

force protection (frpt) day trade

You’ll see the 2nd point on the graph highlighting the initial surge and breakout.  From there, I was just looking for a decent entry and given the overbought market, I wasn’t about to chase anything.  The entry had to be perfect and that perfect opportunity arose.  One thing to remember is that intraday charts move just as they would on a daily.  That means that there are support/resistance levels and price/volume levels indicating shifting demand.  Just as I would on a daily chart, if I missed the initial break, then I wait for a light volume retracement.  This can be anywhere from 30% to 100% of the move.  The key to knowing when the retracement has completed is the dry up in selling volume and a subsequent shift to increasing buying demand.  Notice it continues to subside as the entire initial surge is retraced all the way to 24.50.  Now I’m looking for an entry.  Since sell volume has diminished and the entire move was retraced, I initiate my first position at 24.85 which is a low risk entry with support around 24.50 (which is where I’ll set a new alert).  Now I’m just holding looking for a breakout above the highs of the day around 26 (also set an alert here).  If the stock can clear the highs of the day with volume, I’m going to initiate another smaller position.  It does clear 26, but given the market weakness today I was fairly certain that the stock wasn’t going to clear that level and never look back.  So I waited for a convincing break and pull back.  Instead, it just kind of meandered sideways for an hour and a half as volume continued to diminish.  This kind of volume action usually indicates that a breakout move is imminent (most often in the direction of the preceding move).  I could have just watched the stock but had other things to do, so set another alert at 26.10.  It too trigged and buy volume picked up on the breakout from a cup with handle formation (yes, they can form on intraday charts too!)  I added to my position on a breakout from that formation at 26.03.  It didn’t take long for the stock to really move after clearing this resistance and I was sitting on some hefty profits.  However, with general market weakness and an overextended stock I wasn’t about to get greedy and hold on for more. I made the decision to dump 40% of the position at 27.47 after seeing the higher volume reversal at about 2:40PM EST.  The plan was to ride out the other 60% into the close because sometimes a stock can really see an acceleration of its gains in the final minutes of trading.  However, with a rapidly deteriorating market it wasn’t meant to be, so I unloaded the rest of the position at 26.90 with just a few minutes left in the trading day. 

To sum it up, I believe it pays to be flexible.  Sure mechanical rules are OK to some degree in order to keep the emotions out of trading particularly when starting out, but a multitude of trading conditions call for a multitude of strategies.  Had we been at the beginning of a bull market and FRPT not already run up over 700% in the last year I probably would have held the position for a few months rather than for a quick one day gain. It’s OK to be a buy and hold investor, a swing trader and/or day trader all at the same time depending on the circumstances

::::::::::::::

For the funds that you don’t use for trading you’re probably best served by keeping them in an internet bank. CDs are always a good option and internet banks tend to have the best CD rates. Something else to keep in mind is that there are often good banking deals that these banks will run to try to get your business. You can often get a $50-$100 sign up bonuses at a lot of quality banks.

Innovative Ways to Navigate the Maze of Stock Trading Info

I recently came across 2 interesting and innovative tools that help (..or maybe not) wade through the massive sea of investing/trading information out there.  The first site I came across which my brother mentioned to me is www.chacha.com.  I was intrigued by the idea of speaking to a person through instant messenger and wanted to see if they could deliver good results… so I ran a little test. 

I asked the guide to give me their results for "top stock market investing blogs".  Not too difficult for someone who is supposed to be considered an expert in the investing field right?  Heck, they probably have a list bookmarked on their desktop.  Wrong!  The first guide I spoke to came up with good results in the first 2 (see below).  [I say first guide because I was passed off not once but twice to another guide who "might be of more help"]  I would consider those first 2 resources in any top list.  Then it kind of falls apart.  I certainly wouldn’t consider the last 4 resources in the "top" category.  The Pokey Pine blog hasn’t been updated since Nov 2006, I haven’t heard of several of the top blogs that topblogsites lists, the college site looks fairly new and cxoadvisory? hmm…. you get the idea.  Not shown is one suggestion from the guide that led me to a site about finance, NOT stock market investing.   Clearly, ChaCha has a long way to go before Google should be worried.  If I were in charge I would fix one thing right off.  Guides who pass the query off aren’t rateable (if that’s a word).  The guide who clearly struggled in an area she was supposedly an expert in didn’t get the poor rating from me.  Your success at weeding out poor guides are greatly minimized this way.  Anyway, I wasn’t real impressed but I’ll give it a go again sometime with a different subject.  This is still in beta so it will be an interesting site to follow over the next year or so.  That is if they don’t burn through the cash employing all those guides.

Business > Financial Services

  1. The Stock Market Blogs Resource Page – SeekingAlpha
    The Stock Market Blogs Resource Page – SeekingAlpha
    http://seekingalpha.com/article/3033
  2. ChaCha Search – Search Results
    ChaCha Search – Search Results
    http://marketstockwatch.blogspot.com/2006/11/piranhas-top-10.html
  3. Blogs tagged as Stock Market – Blog Top Sites
    Blogs tagged as Stock Market – Blog Top Sites
    http://www.blogtopsites.com/tag/stock+market
  4. CXOAG Investing/Trading Insights – Stock Market Research Summaries, Analyses and Reviews
    CXOAG Investing/Trading Insights – Stock Market Research Summaries, Analyses and Reviews
    http://www.cxoadvisory.com/
  5. CollegeStock Investing Blog and Small Cap Stock News
    CollegeStock Investing Blog and Small Cap Stock News
    http://www.collegestock.com/investing-blog.php
  6. Pokeypine Stock Market Blog
    Pokeypine Stock Market Blog
    http://nwfolk.com/stox.php

Yesterday, I came across another innovative way to search the investing world.  TheLion, aggregates blog entries and a few top discussion boards (yahoo, raging bull, clearstation).  Just type in a ticker and lists all the entries for that company.  I’m not a fan of the discussion board boasting and bashing and the number of blogs they’re are aggregating appears to be fairly limited since it’s a new part of the service, but if you’re into the discussion boards and want some blog articles thrown in, it’s a useful service.