All posts by Tate Dwinnell

DXP Enterprises (DXPE), Portfolio Recovery (PRAA) & CH Robinson Worldwide (CHRW) All Break Out On Earnings

Today’s Growth Stock Big Earnings Movers: 

UP

• DXP Enterprises (DXPE) Industrial Equipment Wholesales, fundamental rank [27/30],  up 16%, big break out today

Portfolio Recovery Associates (PRAA) Business & Management Services, fundamental rank [27/30],  up 14%, broke out to new all time high today

• C.H. Robinson Worldwide (CHRW) Air Delivery & Freight Service, fundamental rank [24/30],  up 12%, breakout to all time highs

DOWN

• Datalink Corp (DTLK) Business Software & Services, fundamental rank [25/30],  down 24%, big cup base now broken for a very long time

• Travelzoo (TZOO) Internet Info Providers, fundamental rank [28/30],  down 24%, goodbye Travelzoo

• EZCorp (EZPW) Specialty Retail, fundamental rank [27/30],  down 8%, this ugly chart is still holding above the 200 day moving average for now

SEIC Investments (SEIC) Business & Management Services, fundamental rank [28/30],  down 5%, working on right side of base; holding above the 50 day moving average

Semiconductor ETF’s Breakout (SMH, IGW) – Trading Opportunities

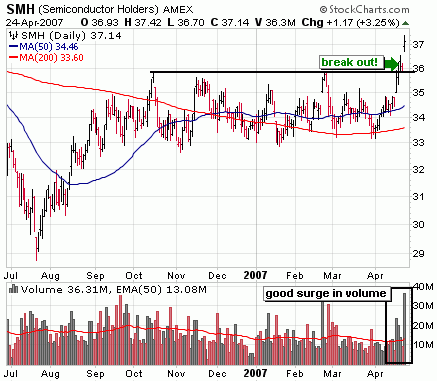
Semiconductors have broken out in recent days and that bodes well for the overall market.  We still need to come in a bit after a steep incline, but if the semis can stage a run here, that would lend good internal strength for the market to hold up at multi year highs.  The Semi Holders (SMH) is the strongest of the Semiconductor ETF’s with Texas Instruments (TXN), Intel (INTC) and Applied Materials (AMAT) making up a little more than 50% of the fund.  It got a big boost following Texas Instruments’ earnings report yesterday after the bell.


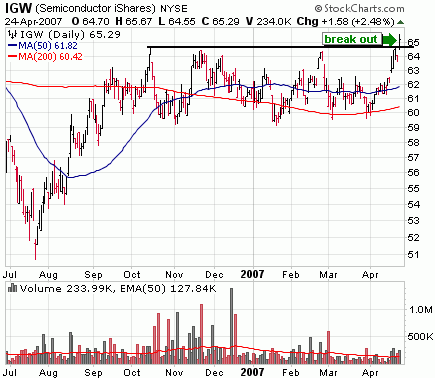
The Ishares Semis (IGW) broke out today, but volume hasn’t been impressive yet.  This is a much more diversified fund with no companies dominating in the allocation.


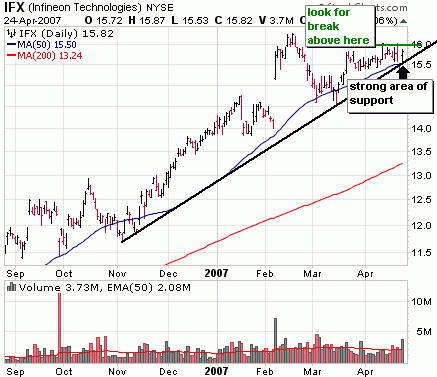
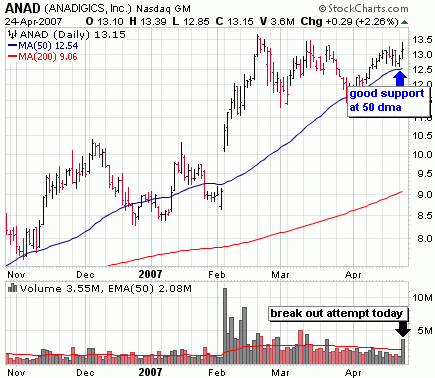
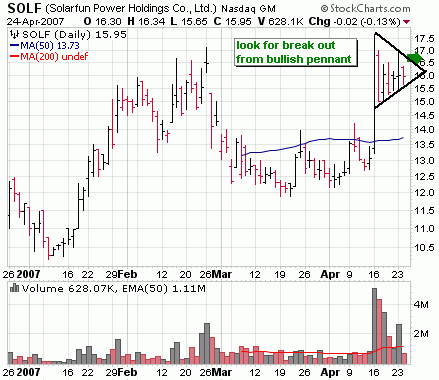
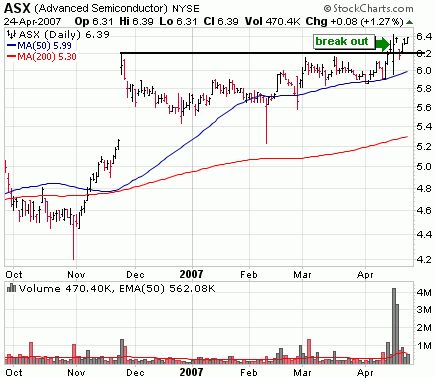
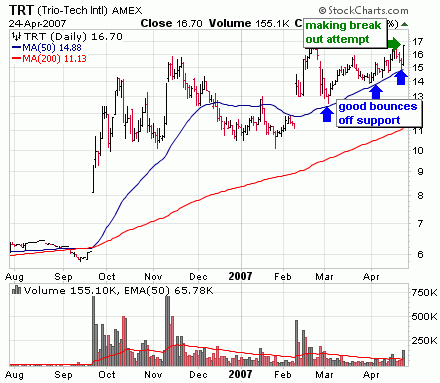
ETF’s are a good diversified way to play a break out in the semis, but I prefer to play invidual stocks which, while riskier, offer much greater reward.  I should mention I am only holding positions for a short period at this time, looking to capture quick profits over a couple days.  I’m waiting for the market to digest recent gains before initiating positions for the longer term.  Here’s a sampling of the bullish charts I’m seeing in the semiconductor space. 

Note: the companies highlighted are not necessarily good fundamentally, but all look great technically.  Do your own research on these and know when they report earnings. 


Disclaimer: I currently own positions in TRT and SOLF

Icon (ICLR) Breaks Out of Flat Base; Omnicell (OMCL) Adds to Recent Break Out

Today’s Earnings Movers: 

UP

• PACCAR (PCAR) Trucks & Other Vehicles, fundamental rank [25/30],  up 10%, adding much to a long uptrend and at all time highs

Anixter International (AXE) Electronics Wholesale, fundamental rank [25/30],  up 5%, adding to february’s break out; at all time highs

• Omnicell (OMCL) Computer Based Systems, fundamental rank [24/30],  up 4%, adding to Friday’s break out to a new all time high; looks outstanding

ICON (ICLR) Research Services, fundamental rank [24/30],  up 4%, breaking out of flat base to new all time highs

DOWN

Resmed (RMD) Medical Appliances & Equipment, fundamental rank [26/30],  down 10%, well off morning lows but should spend considerable time basing around 40

• Carlisle Companies (CSL) Rubber & Plastics, fundamental rank [23/30],  down 8%, took out support of both 50 and 200 day moving averages; February break out has failed

• Coach (COH) Apparel Stores, fundamental rank [27/30],  down 6%, on the verge of taking out support of the 50 day moving average; overdue for some kind of correction

Kinetic Concepts (KCI) Medical Appliances & Equip, fundamental rank [26/30],  down 4%, getting decent bounce off 50 day moving average

• Metalico (MEA) Steel & Iron, fundamental rank [23/30],  down 4%, some big buying in this "off the radar" steel play; still holding at all time highs despite today’s selling

Stock Chart Analysis – The Major Indices (S&P500, Dow, Nasdaq)


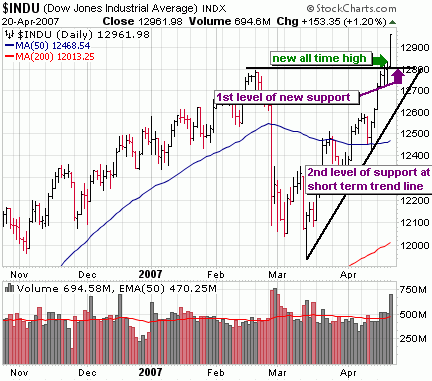
The most glaring thing I see in this chart is the severe V shaped base that has formed.  Based on that alone, this market is very much due for some kind of pull back, or at the very least, a lengthy consoliation sideways.  With the Dow breaking into new high territory we now have a new support level at the old highs around 12800.  If it can consolidate quietly from here and hold at those all time highs, that would be mighty bullish action.  I tend to think we’ll take out that support level at some point and test the short term upward trend line around 12700, possibly even the 50 day moving average around 125000.   I don’t think we’ll test the lows of the correction below 12,000.

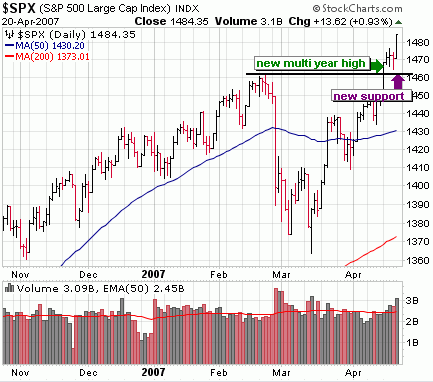
The S&P of course will look very similar to the Dow so not much to add here.  Notice too it has a new level of support at the old multi year highs set back at the end of February.  We’ll need to, at the very least, test that new level of support before heading higher.

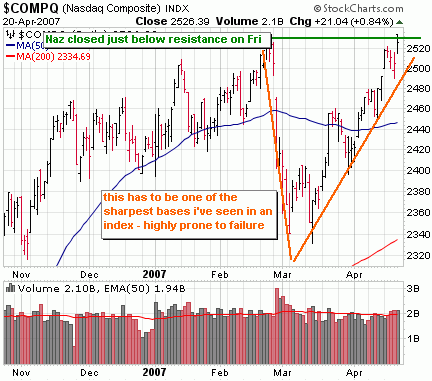
I’ve highlighted the sharp V base in the Nasdaq.  It is quite rare to see this kind of base in any chart, particularly a chart of the major indices.  The Naz isn’t as bullish looking as the Dow and S&P and has not cleared resistance of the February highs (although it briefly peaked above that level on Friday).   The Nasdaq is clearly due for some selling and retracing a large portion of this run up to around the 50 day moving average is not out of the question.

Dow and S&P500 Break Out; Homebuilders & Semiconductors Showing Life

How many predicted that the market would break out to new highs within 2 months of staging its worst sell off in several years?  Not many, if any and certainly not me.  The action has been unusual, but given that the market has a way of fooling the majority, not completely surprising.  Quite frankly, technicaly analysis hasn’t been a good predictor of late.  Usually a massive sell off takes time to repair itself (often times by retesting the lows), not indicate that another bull run is around the corner.  Does that mean it’s time to throw price/volume and support/resistance analysis out the window? Heck no!  Technical analys isn’t anywhere to close to 100% accurate, it just provides you with a reasonable probablity of a move in any direction.  It’s without a doubt right on more than dead wrong. 

So where the heck do we go from here?  Oh right, Dow 13,000 as all the headlines are predicting for Monday.  That’s a reasonable assumption, but lets take a step back for a bit and look at what has taken place in terms of the positve and negative.  Maybe then we can make some sense out of this schizo market.  On the positive side, we have break outs in the Dow to a new all time high and a break out in the S&P to a new multi year (and fast approaching its all time high).  This in and of itself is very bullish.  It doesn’t pay to fight it.  Just as you would with the break out of any stock, it’s important to take a look at the bases of the indices that resulted in the break out.  Is it healthy enough to provide a sustained move for the bulls?  The quick answer is no.  The base is V shaped with heavy volume in the left side and little buyer conviction in the right side.  Friday’s bust out move was impressive on the surface, but remember that options expiration and most likely short covering distorted it a bit.   Throw in the fact that the Dow has now risen in 21 of the past 26 days following that key reversal on March 14th and you have conditions that are very ripe for a pull back of some degree.   I have said before that we should expect  the market to test those February lows again before heading higher, but I no longer think that will be the case anytime soon.  A more likely scenario is coming back to test the 50 day moving average and at most the 200 day moving average.  That just might be enough for the market to repair the damage done on February 27th, not to mention provide a great entry point for increasing my exposure on the long side.

At this point, don’t chase the bull and if you have nice profits don’t be greedy.  Lock in some of that and wait for a better entry.

::: Model Portfolio Update :::

It’s been frustrating to continue to sit with half the portfolio in shorts and cash as the market breaks out to new highs, but I’m not going to chase this overbought market and will remain patient..  I’m waiting for the right time to get more aggressive on the long side and that time isn’t now.  I did make a couple transactions last week – I covered one of my shorts in FTEK for an 11% gain and initiated a position on the long side in a top breakout play.  For the week, the portfolio was off .9%, dropping the YTD performance to 6.7% but still ahead of the S&P500.  It continues to be led by my long term core holding in Google which got  a bump after an impressive earnings report on Thursday.  Current allocation is 50% long, 27% short and 23% cash.

::: Best/Worst Performers :::

– Top 10 Performing Industries For the Week –

1. Residential Construction: 9.25%
2. Mortgage Investment: 8.05%
3. Sporting Goods: 6.10%
4. Semiconductor – Broadline: 5.30%
5. Semiconductor Specialized: 5.00%
6. Industrial Equip Wholesale: 4.90%
7. Investment Brokerage – National:  4.80%
8. Farm & Construction Machinery: 4.75%
9. Surety & Title Insurance: 4.70%
10. Credit Services: 4.65%

– Top 10 Worst Performing Industries For the Week –

1. Music & Video Stores: -5.50%
2. Semiconductor – Memory Chips: -3.20%
3. Medical Practitioners: -3.20%
4. Internet Information Providers: -2.05%
5. Savings & Loans: -2.05%
6. Broadcasting – Radio: -1.85%
7. Specialized Health Services: -1.80%
8. Oil & Gas Equip and Services: -1.65%
9. Oil & Gas – Independent: -1.45%
10. Gold: -1.35%

– Top 5 Best Performing ETFs For the Week –
 
1. Ishares Home Construction (ITB)  7.50%
2. SPDR Homebuilders (XHB) 6.80%
3. HLDRS Semis (SMH) 5.10%
4. SPDR Financial (XLF) 4.00%
5. Ishares South Africa (EZA) 3.75%

– Worst 5 Performing ETF’s –

1. HLDRS Internet (HHH)  -4.20%
2. US Oil Fund (USO) -2.85%
3. Central Fund of Canada (CEF) -2.20%
4. Market Vectors Gold Miners (GDX) -2.10%
5. Templeton Russia & Eastern Europe (TRF) -1.90%

:::  IPO’s Worth Watching for This Week :::

1. EDENOR (EDN): Argentina’s largest public electric utility. Known as EDENOR, it distributes electricity on an exclusive basis to the northwestern zone of the greater Buenos Aires metropolitan area and the northern portion of the city. It services about 1 million people. Set to start trading on Wednesday.

::: Upcoming Economic Reports (4/23/07 – 4/27/07) :::

Monday:        None
Tuesday:       Consumer Confidence, Existing Home Sales
Wednesday:  Fed Beige Book, Durable Orders, New Home Sales, Crude Inventories
Thursday:      Initial Claims
Friday:           GDP (adv)

::: Notable Upcoming Earnings Reports I’ll Be Watching This Week :::

Monday:
Grant Prideco (GRP), Core Laboratories (CLB), Amgen (AMGN)

Tuesday:
ENSCO Intl (ESV), Icon (ICLR), Coach (COH), Anixter Intl (AXE), EZCORP (EZPW), Chicago Mercantile (CME), Travelzoo (TZOO), Amazon (AMZN)

Wednesday:
Smith International (SII), SEI Investments (SEIC), Apple Computer (AAPL), Akamai Technologies (AKAM), Allegheny Technologies (ATI), International Securities (ISE), UAL Corp (UAUA), RPC Inc (RES), Corning (GLW), Ryland Group (RYL)

Thursday:
NYSE Euronext (NYX), Microsoft (MSFT), Vasco Data Security (VDSI),  Falconstor Software (FALC), Psychiatric Solutions (PSYS), Silicon Motion Technology (SIMO), Silver Wheaton (SLW), Comcast (CMCSA), Monster (MNST), MEMC Electronic Materials (WFR), Cash America (CSH), TheStreet.com (TSCM), Sunpower Corp (SPWR), Life Time Fitness (LTM), Digital River (DRIV), 3M (MMM), CBOT Holdings (BOT), Beazer Homes (BZH)

Friday:     
National Oilwell (NOV), CTC Media (CTCM), Cameron International (CAM), Baidu.com (BIDU), Cameco (CCJ),
Google (GOOG), Intutive Surgical (ISRG) & Satyam (SAY) Approach All Time Highs

Today’s Earnings Movers: 

UP

• Saia Inc (SAIA) Trucking, fundamental rank [23/30],  up 19%, working on the right side of a base

Intuitive Surgical (ISRG) Medical Appliances & Equip, fundamental rank [24/30],  up 9%, adding to the break out in March and approaching all time highs

Satyam (SAY) Information Technology Service, fundamental rank [28/30],  up 7%, nearing a break out to all time highs

CyberSource Corp (CYBS) Business Software & Services, fundamental rank [26/30],  up 7%, the breakout back in January is holding up well; nice bounce off 50dma today

Caterpillar (CAT) Farm & Construction Machinery, fundamental rank [24/30],  up 5%, adding to Wednesday’s break out

Google (GOOG) Internet Info Providers, fundamental rank [27/30],  up 3%, carving out right side of base; approaching all time highs

DOWN

Robert Half International (RHI) Staffing & Outsourcing Services, fundamental rank [25/30],  down 10%,taking out 200 day moving average; next stop: 30

Nokia (NOK) Breaks Out to Multi Year High; Schering Plough (SGP) & Gilead Sciences (GILD) Soar to New Heights

Today’s Earnings Movers: 

UP

  • Schering Plough (SGP) Drug Manufacturer – Major, fundamental rank [26/30],  up 8%, soaring to new multi year highs
  • Gilead Sciences (GILD) Biotech, fundamental rank [27/30],  up 5%, just continues to march to new all time highs after breaking out at the end of January
  • Nokia (NOK) Communication Equipment, fundamental rank [24/30],  up 4%, breaking out of long one year base to new multi year high

DOWN

  • Wesco International (WCC) Electronics Wholesale, fundamental rank [26/30],  down 7%, took out support of 50 and 200 day moving averages.. will spend much more time basing
  • Alliance Data Systems (ADS) Information & Delivery Service, fundamental rank [26/30],  down 5%, possible failure of base in the making
  • United Health Care (UNH) Health Care Plans, fundamental rank [23/30],  down 4%, still has support of 200 day moving average but probably not going anywhere anytime soon

S&P Breaks Out But With Little Conviction; Stock of Day – Divx Inc. (DIVX)

::: Today’s Market Action :::

With traders growing concerned about the strength of the economy and declining earnings, positive news to the contrary (along with some M&A activity) sent markets surging higher today.  The S&P500 busted through resistance to a new multi year high with the last line of resistance at all time highs.  Both the Dow and the Nasdaq are nearing resistance of their February highs. 

On the surface it looked a huge day for the bulls, but volume levels revealed a different story – skepticism and hesitation on the part of institutions.  While volume edged up slightly from Friday in both the S&P and Dow, it was still below average.  I mentioned in the weekend report that the more this market moved up (particularly with below average volume), the greater the risk on the long side.  Considering today’s divergence of price and volume, I still feel that way despite the break out in the S&P.  It’s OK to continue dabbling on the long side, but to get aggressive is a mistake in my opinion.  With key economic reports tomorrow and some big name earnings after the bell, we’re approaching a critical area.  Consider locking in some profits where you have them.

Note: The stockcharts.com server is still down, so no annotated charts again this evening.  I’ll try and post them tomorrow.

::: Major Indices Performance – The Numbers :::

(Note: volume averages are based on the average over the past 50 days)
Data as of 4:00EST – End of Day April 16th 2007

Accumulation in the Dow and S&P.. just barely.

Nasdaq: UP 1.06% today with volume 18% BELOW  average
Nasdaq ETF (QQQQ) UP .92%, volume 42% BELOW average
Dow: UP .86%, volume 8% BELOW the average
Dow ETF (DIA): UP .71%, volume 12% BELOW the average
S&P ETF (SPY): UP .95%, volume 20% BELOW the average
Russell Small Cap ETF (IWM): UP  1.29%, volume 27% BELOW the average

::: SelflInvestors Leading Stocks :::

The Self Investors Leading Stocks Index is comprised of stocks in the Breakout Tracker, which is a database of the fastest growing companies near a breakout or having already broken out of a base.  Leading stocks performed well today in terms of price performance, but volume levels indicate that institutions were not pouring money in.  This confirms the lack of conviction in today’s move in the market.

Summary:

* Advancers led Decliners 357 to 67
* Advancers were up an average of 1.93% today, with volume 8% BELOW average
* Decliners were down an average of 1.39% with volume 17% ABOVE average
* The total SI Leading Stocks Index was UP  1.41% today with volume 4% BELOW the average

::: Where’s the Money Flowing :::

Many investing websites provide leading industries based on price performance alone. However, without accompanying volume levels, this can sometimes be misleading.  The only way that I know of to gauge industry/sector strength WITH volume levels is through the analysis of ETF’s.  A couple years ago this was not possible, but as more traders/investors use ETF’s they become a much better tool for guaging the health of the market and seeing where the money is flowing (or not flowing).  Using the proprietary SelfInvestors Demand Indicator score which measures price and volume movements, I’m able to quickly see which sectors/industries are seeing the greatest inflows of cash.  For a detailed look at how I go about gauging sector/industry strength please see the following post: http://selfinvestors.com/industry_tracking/

* Current Leading Sectors/Industries (over last 30 trading days): 
Utilities, Consumer Goods, Networking, Internet, Broker/Dealers, Pharma
                                              
* Current Lagging Sectors/Industries (over last 30 trading days): 
Agriculture, Home Builders

* Today’s Market Moving Industries/Sectors (UP):
Financials, Broker/Dealers, Nanotech, Home Construction, Gold

* Today’s Market Moving Industries/Sectors (DOWN):
None

::: Stocks :::

The stocks section will be an area where I highlight one stock selected from a group of stocks moving up with volume well above average and most likely breaking out of a base or consolidation.  There weren’t too many top rated stocks breaking out of bases today, so I chose one of the top IPO’s of last year that appears to be on the verge of breaking out –  Divx Inc. (DIVX). 

ABOUT:  DivX Inc. (DivX) creates products and services designed to improve the experience of media. The Company’s product offerings include a video compression-decompression software library (codec) and other consumer software, including the DivX Player application. It also licenses its technologies to consumer hardware device manufacturers and certifies their products to ensure the interoperable support of DivX-encoded content. DivX’s customers include major consumer video hardware original equipment manufacturers (OEMs), including Koninklijke Philips Electronics (Philips) and Samsung Electronics. In addition to technology licensing to consumer hardware device manufacturers, the Company generates revenue from software licensing, advertising and content distribution. In March 2006, DivX acquired all of the assets of Corporate Green, a general partnership that developed an online community platform.

FUNDAMENTALS: Aided by the booming popularity of online video, DIVX had a break out year in 2005 which saw the company swing to its first full year profit in company history.  2006 was even better, with earnings increasing 600% over ’05.  One key characteristic that I look for in top stocks is rising margins and return on equity.  Net margins (at 28%) are outstanding and rising quickly.  Return on equity isn’t exceptional, but very good at around 14%. 

TECHNICAL:  This is a stock that still needs to prove itself to a certain degree.  It’s just now making a move up in the right side of its first base since going public in September of last year.  With sell volume drying up at the bottom and a big gap up above resistance of the 50 day moving average following preliminary earnings guidance above previous estimates, I believe the stock won’t have any trouble breaking out and testing its all time high around 32 over the next few months.  A strong break out above the peak of a double bottom base at 24.21 and I will consider a position.

SELFINVESTORS RATING: With a total score of 51/60 (27/30 for fundamentals, 24/30 for technical), DIVX is a top break out candidate.

Full Disclosure/Disclaimer: The stock of the day is by no means a buy recommendation.  Please do your own research and make a personal decision based on your own tolerance for risk.  I currently do not own a position in Divx Inc (DIVX).

Bulls Resilient But Running Out of Gas; Earnings Kick Off & Important Data Tuesday

You have to hand it to the bulls who have shown remarkable resiliency to keep this market afloat.  Following the Fed minutes on Wednesday in which the Fed removed any possibility of a rate hike in the near future (which is what fueled the rally folllowing the Fed decision March 21st), the market sold with some intensity.  It set up the likelihood that, at the very least, the major indices would take out support of the 50 day moving averages.  But there were buyers again stepping in and taking the market higher Thursday and Friday, albeit with uninspiring volume. 

From what I’m seeing, as the market comes close to retesting its previous highs, many traders have all but forgotten the big sell off on February 27th.  What’s important to remember is that technical damage of that magnitude doesn’t just disappear.  It takes time to repair the damage – done with a lengthy sideways consolidation and/or a retest of those lows.  This hasn’t happened.  YET.  It will.  Maybe we continue push to the highs of February, but the closer we get to those highs, the greater the risk on the long side.  Play accordingly. 

Next week is a big week with earnings kicking off in full force.  With housing starts, building permits, CPI data and several earnings reports, Tuesday could provide an important clue as to where this market is headed.

I’ll post an analysis of the charts of the major indices tomorrow night.

::: Model Portfolio Update :::

It was another fairly quiet week for the Model Portfolio in this directionless market.  I’m not doing a whole lot on either side right now but did close out a few positions and replaced them with what should be stronger ones.  I closed out my TIE position for a small 5% gain and replaced it with a top Chinese play.  Also closed out were 3 Quick Strike Profit plays that while still fairly bullish, were showing enough weakness for me to cut and run.  With the market still needing to repair significant damage and likely to see further selling at some point, I’m moving on at any sign of weakness, however small.   Closed were JAV (+5%), TTG (-3%) and MFN (-2%).  These were replaced with 2 other QSP plays, both of which remain profitable.  For the week, the portfolio edged up just .1% and stands firm with a 7.6% YTD return.  Current allocation remains a bit on the bearish side with 40% long, 35% short and 25% in cash.

::: Best/Worst Performers :::

– Top 10 Performing Industries For the Week –

1. Railroads: 6.75%
2. Recreational Goods: 4.85%
3. Long Term Care Facilities: 4.50%
4. Technical Services : 4.45%
5. Heavy Construction: 4.35%
6. Copper: 4.25%
7. Silver:  4.15%
8. Nonmetallic Mineral Mining: 4.15%
9. Manufactured Housing: 3.85%
10. Oil & Gas Equipment & Services: 3.65%

– Top 10 Worst Performing Industries For the Week –

1. Advertising Agencies: -3.75%
2. Toy & Hobby Stores: -3.05%
3. General Entertainment: -2.60%
4. Auto Manufacturers: -2.20%
5. Pollution & Treatment Controls: -2.05%
6. Residential Construction: -1.85%
7. Diversified Computer Systems: -1.85%
8. Savings & Loans -1.80%
9. REIT – Hotel/Motel: -1.80%
10. REIT – Residential: -1.65%

– Top 5 Best Performing ETFs For the Week –
 
1. Morgan Stanley China (CAF)  5.20%
2. Central Europe and Russia Fund (CEE) 5.15%
3. Morgan Stanley India (IIF) 5.00%
4. Central Fund of Canada (CEF) 4.40%
5. India Fund (IFN) 3.80%

– Worst 5 Performing ETF’s –

1. Japan Small Cap (JOF)  -3.80%
2. Herzfeld Caribbean Basin (CUBA) -1.40%
3. Ishares Japan (EWJ) -1.15%
4. HLDRS Retail (RTH) -1.00%
5. US Oil Fund (USO) -.95%

:::  IPO’s Worth Watching for This Week :::

1. MetroPCS Communications (PCS): provider of wireless broadband personal communication services. The company offers service on the basis of no long-term contract, flat-rate, unlimited usage in selected major metropolitan markets in the United States. The company serves over 3 million customers in the San Francisco, Miami, Tampa/Sarasota/Orlando, Atlanta, Sacramento, Dallas/Ft. Worth, and Detroit metropolitan areas.  The company is profitable and will begin trading on Thursday.

2. Simcere Pharmaceutical Group (SCR): China-based manufacturer and supplier of branded generic pharmaceuticals in China. The company  manufactures and sells 35 pharmaceutical products, including antibiotics, an anti-cancer medication and an anti-stroke medication. Simcere also has 12 product candidates in various stages of development, including treatments for cancer, cerebrovascular diseases, infections, rheumatoid arthritis, nasal allergies, nausea and vomiting associated with chemotherapy.  Profits and sales have increased significantly over the past year.  Trading set to begin on Friday.

3.  Superior Offshore International (DEEP): provider of subsea construction and commercial diving services to the crude oil and natural gas exploration and production and gathering and transmission industries on the outer continental shelf of the Gulf of Mexico.  Profits and sales have more than tripled over the past year.  Trading set to begin on Friday.

::: Upcoming Economic Reports (4/16/07 – 4/20/07) :::

Monday:        Retail Sales; Business Inventories
Tuesday:       CPI; Housing Starts; Building Permits; Industrial Production, Capacity Utilization
Wednesday:  Crude Inventories
Thursday:      Leading Indicators, Initial Claims
Friday:           None

::: Notable Upcoming Earnings Reports I’ll Be Watching This Week :::

Monday:   None
Tuesday:  Steel Dynamics (STLD), EMC Corp (EMC)
Wednesday: Ebay (EBAY), Alliance Data Systems (ADS),
Thursday: Google (GOOG), Cybersource (CYBS), Schering Plough (SGP), United Health (UNH)
                   CBOT Holdings (BOT)
Friday: Schlumberger (SLB)