All posts by Tate Dwinnell

Big Demand for Interactive Brokers (IBKR) IPO

If the percentage of my traffic that comes from Google searches involving Interactive Brokers is any indication, Investors are clearly clamoring for shares of the Interactive Brokers (IBKR) IPO ahead of public trading this Friday.  Also, just today, underwriters have increased the size of the offering from 20 million shares to 34.5 million while increasing the expected pricing range from $23 – 27 to $27 – 31.  The company is giving Wall St the could shoulder and going Dutch just as Google (GOOG) did a couple years ago with the open auction using the services of WR Hambrecht (OpenIPO).  It levels the playing field between institutional and retail investors giving everyone a chance at a piece of the IPO pie.  From the WR Hambrecht website:

"The OpenIPO® auction, for example, levels the playing field in initial public offerings, allowing individuals and institutional investors to bid online for shares of an IPO. All investors end up paying the same price – a price determined by the auction. The OpenBook® auction for corporate bonds, is an online system that offers transparent, real-time price discovery. OpenFollowOn® auction extends the transparency and real-time price discovery of the OpenBook auction to follow-on equity offerings allowing interactive bidding and gives investors a view into the book as it builds.

I’ll be sitting this one out, but if you’re interested in bidding, Interactive Broker (IBKR) customers can do it easily from their account page or you can go through other participants.  Trader Narrative recently wrote up a nice summary about how the process works.

In my opinion, these shares are going to get priced way above a reasonable valuation due to it’s popularity.  That doesn’t mean it can’t spike significantly higher still after hitting the open the market, but I just prefer to wait a few days for the dust to settle.  At any rate, it will be an interesting to watch to for the rest of the year.  For an interesting post on coming up with a valuation for Interactive Brokers (IBKR) have a look at Frank’s post over at Technicator.net

Atheros Communications (ATHR) Touches All Time High After Earnings

Today’s Growth Stock Big Earnings Movers: 

UP

• Atheros Communications (ATHR) Semiconductor – Integrated Circuit, fundamental rank [26/30],  up 5%, briefly broke out to new all time high today, but is well off that level

Manitowoc (MTW) Farm & Construction Machinery, fundamental rank [25/30],  up 5%, another new all time high

DOWN

• Intervac (IVAC) Diversified Electronics, fundamental rank [24/30],  down 17%, took out support of 200 day moving average; done for quite some time

• RTI International Metals (RTI) Industrial Metals & Minerals, fundamental rank [28/30],  down 13%, took out support of 50 day moving average with record volume; some support around 80 but most likely headed to 200 day moving average

• Vulcan Materials  (VMC) General Building Materials, fundamental rank [25/30],  down 7%, base on verge of failure; trying to hold at 50 day moving average

Standard Microsystems (SMSC) Semiconductor – Integrated Circuit, fundamental rank [23/30],  down 5%, base still intact barely; trying to hold above 50 day moving average but probably won’t

Profit Taking Ends in Distribution for Dow and S&P500

There wasn’t anything in particular that threw the indices firmly in the red today.  Just call it good old fashioned profit taking after a record run as we head into what has historically been one of of the worst performing months for the market.  I’m sure the sell off of last May is still fresh in the minds who took a hit in their portfolios about this time last year. 

Now that the selling has begun, we turn our attention to the intensity of this selling and strength/weakness at key support levels.  Both the Dow and S&P chalked up a day of distribution while the Nasdaq narrowly averted the classification.  One or two of these over the next week or two is relatively harmless, so nothing to be alarmed about at this point.  In terms of key support levels, the Nasdaq was not able to hold above its multi year highs and is now sitting right on the upward trend line that began with the key reversal on March 14th.  There is a good chance it will wipe out that support level at some point tomorrow, creating the likelihood of a drop to the 50 day moving average at some point.  The Dow and S&P are in much better shape and haven’t touched their first lines of support.. in fact the Dow needs to drop about 265 points just to hit its first level of support.  That’s a good indication of just how overbought this market has become.  No change in strategy from the past couple weeks – lock in hard earned profit and sit flush with cash waiting for the next round of opportunity.

::: Major Indices Performance – The Numbers :::

(Note: volume averages are based on the average over the past 50 days)
Data as of 4:00EST – End of Day April 30th 2007

Distribution in the Dow and S&P500.

Nasdaq: DOWN 1.26% today with volume 6% BELOW  average
Nasdaq ETF (QQQQ) DOWN 1.31%, volume 23% BELOW average
Dow: DOWN .44%, volume 6% ABOVE the average
Dow ETF (DIA): DOWN .43%, volume 5% ABOVE the average
S&P ETF (SPY): DOWN .83%, volume 5% BELOW the average
Russell Small Cap ETF (IWM): DOWN  2.11%, volume 40% ABOVE the average

::: SelflInvestors Leading Stocks :::

The Self Investors Leading Stocks Index is comprised of stocks in the Breakout Tracker, which is a database of the fastest growing companies near a breakout or having already broken out of a base.  Leading stocks got hit fairly hard today – about in line with the Nasdaq but with heavier volume.

Summary:

* Decliners led Advancers 326 to 80
* Advancers were up an average of 2.14% today, with volume 69% ABOVE average
* Decliners were down an average of 2.21% with volume 14% ABOVE average
* The total SI Leading Stocks Index was DOWN  1.35% today with volume 25% ABOVE the average

::: Where’s the Money Flowing :::

Many investing websites provide leading industries based on price performance alone. However, without accompanying volume levels, this can sometimes be misleading.  The only way that I know of to gauge industry/sector strength WITH volume levels is through the analysis of ETF’s.  A couple years ago this was not possible, but as more traders/investors use ETF’s they become a much better tool for gauging the health of the market and seeing where the money is flowing (or not flowing).  Using the proprietary SelfInvestors Demand Indicator score which measures price and volume movements, I’m able to quickly see which sectors/industries are seeing the greatest inflows of cash.  For a detailed look at how I go about gauging sector/industry strength please see the following post: http://selfinvestors.com/si/industry_tracking/

* Current Leading Sectors/Industries (over last 30 trading days): 
Semiconductors, Networking, Biotech, Pharma, Financial
                                               
* Current Lagging Sectors/Industries (over last 30 trading days): 
Internet Infrastructure, Agriculture

* Today’s Market Moving Industries/Sectors (UP):
Bonds

* Today’s Market Moving Industries/Sectors (DOWN):
Clean Energy, Homebuilders, Oil Services, Semis, Retail, Transports

::: Stocks :::

The stocks section will be an area where I highlight one stock selected from a group of stocks moving up with volume well above average and most likely breaking out of a base or consolidation.  Sorry, no Stock of the Day today.  There just weren’t any high volume movers that piqued my interest.

Weak Economic Data May Take Center Stage; Hot IPO – Interactive Brokers (IBKR)

A bull mode market is characterized by a focus on the good news and shrugging off the bad.  This week was a great example of that as traders focused on strong earnings reports rather than weak economic data (GDP, Housing).  On Wednesday, awful new home sales figures weren’t enough to put a damper on blow out results from Amazon and then again on Friday, lower than expected GDP data sent the market gapping down at the open, but it wasn’t long before buyers stepped in again as the Dow rose for yet another day.  Friday was really a testament to the strength of the bulls right now.  Certainly, the character of this market has changed significantly in the past couple weeks.

Now that  key resistance areas have been taken out, we turn our attention to adding positions (or adding to positions) at drops to key support levels, rather than looking to dump positions or initiate shorts at key resistance levels.  That’s where we’re at now.  A complete reversal from just a few weeks ago.  Some healthy, consolidating action with light volume would go a long ways in confirming the strength of the bull and providing an entry point to get more aggressive on the long side.  With the big fellas mostly done reporting, any additional weak economic numbers next week may be enough to do just that.

::: Model Portfolio Update :::

Not much has changed in the Model Portfolio.  I’m slowly moving to a portfolio allocated more on the long side, but continue to wait for some consolidation/selling in this market to get more aggressive on the long side.  The portfolio has been weighed down a bit by a few short positions, two of which were exited during the week – a position in Nasdaq Ultra Short (QID) was covered for a 10% loss and a short position in Carter’s (CRI) was covered for a 7% loss.  On the long side, my NYX position got hit with a downgrade and I was forced out of the position ahead of earnings for an 8% loss.  There were a few bright spots.  One of my Quick Strike Profit plays in FALC was closed for a 7% gain and a new QSP position entered on Friday provided a quick gain of 8% and I’m holding for more.  All in all, the portfolio managed a small gain for the week and the YTD performance rose to a respectable 6.9% – still ahead of the S&P500 despite being on the wrong side of the market the past couple weeks.  The current allocation of the portfolio is beginning to lean towards the long side slowly but surely.  I’m now 50% long, 17% short and am sitting on a large cash position of 33% waiting to initiate more longs.

::: Best/Worst Performers :::

– Top 10 Performing Industries For the Week –

1. Catalog & Mail Order Houses: 11.75%
2. Trucks & Other Vehicles: 7.60%
3. Education & Training Services: 6.15%
4. Medical Practitioners: 5.85%
5. Appliances: 5.55%
6. Small Tools & Accessories: 5.45%
7. Waste Management:  5.30%
8. Personal Computers: 5.00%
9. Security Software & Services: 4.95%
10. Aluminum: 4.75%

– Top 10 Worst Performing Industries For the Week –

1. Major Airlines: -6.60%
2. Office Supplies: -4.90%
3. Building Materials Wholesale: -4.60%
4. Dairy Products: -4.60%
5. Drugs Wholesale: -4.05%
6. Home Improvement Stores: -3.30%
7. Regional Airlines: -3.30%
8. Specialty Retail: -3.20%
9. Recreational Goods: -2.90%
10. Silver: -2.85%

– Top 5 Best Performing ETFs For the Week –
 
1. HLDRS Internet (HHH)  7.50%
2. HLDRS Oil Service (OIH) 5.60%
3. PowerShares Dynamic Oil (PXJ) 4.70%
4. Morgan Stanley China (CAF) 3.80%
5. Herzfeld Caribbean Basin (CUBA) 3.75%

– Worst 5 Performing ETF’s –

1. HLDRS Internet Internet Infrastructure (IIH)  -4.80%
2. Ishares Spain (EWP) -3.90%
3. Mexico Fund (MXF) -3.15%
4. Templeton Russia & Eastern Europe (TRF) -2.95%
5. Ishares Silver (SLV) -2.75%

:::  IPO’s Worth Watching for This Week :::

1. Interactive Brokers (IBKR): automated global electronic market maker and a broker that specializes in routing orders and executing and processing trades in securities, futures, and foreign exchange instruments as a member of more than 60 electronic exchanges and trading venues around the world.  Trading set to begin on Friday.

2. Cavium Networks (CAVM): caters to clients whose networking equipment delivers "triple play" packages of voice, video, and data services at high speeds. Cavium is known for its fast and secure system-on-chip processors. Its customer list is a "Who’s Who" in tech with names such as Cisco, IBM, and Samsung.  Set to start trading on Wednesday.  The company isn’t yet profitable but rapidly moving that way.

3. Acorn International (ATV): Shanghai, China company that provides multi-platform marketing through direct TV sales and a nationwide distribution network. The company believes it operates the largest direct TV sales business in China. It also  believes it was one of the first companies in China to use direct TV sales programs, also known as TV infomercials.  Trading to begin on Thursday

4. Qiao Xing Mobile Communications (QXM): Beijing company that manufactures mobile phone handsets in China. The company’s mobile phone handsets are based primarily on GSM global cellular technologies. Qiao Xing focuses on higher-end and differentiated products. Trading set to begin on Thursday.

::: Upcoming Economic Reports (4/30/07 – 5/4/07) :::

Monday:        Personal Income, Personal Spending, Chicago PMI, Construction Spending
Tuesday:       ISM Index, Pending Home Sales, Auto Sales
Wednesday:  Factory Orders, Crude Inventories
Thursday:      Initial Claims, Productivity (prelim), ISM Services
Friday:           Hourly Earnings, Nonfarm Payrolls, Unemployment Rate

::: Notable Upcoming Earnings Reports I’ll Be Watching This Week :::

Monday: RTI International Metals (RTI), Pan American Silver (PAAS), BE Aerospace (BEAV)
               Atheros Communications (ATHR), Vulcan Materials (VMC), Manitowoc (MTW),
               Hercules Offshore (HERO), LHC Group (LHCG), TransDigm Group (TDG)

Tuesday: Hologic (HOLX), Chipotle Mexican Grill (CMG), NYMEX Holdings (NMX)
                Iconix Brands (ICON), DivX (DIVX), Vocus Inc (VOCS), Interactive Intelligence (ININ)

Wednesday: Superior Energy Services (SPN), TODCO (THE), Hecla Mining (HL),
                     NightHawk Radiology (NHWK), Dolby Laboratories (DLB)
                     Liquidity Services (LQDT), Radiation Therapy (RTSX), Ness Tech (NSTC)
                     Radvision (RVSN), Houston Wire & Cable (HWCC), Natco Group (NTG)
                     Garmin (GRMN), HealthSpring (HS), GFI Group (GFIG)
                     Intercontinental Exchange (ICE), Las Vegas Sands (LVS), Cognizant Tech (CTSH)
                    
Thursday: Northgate Minerals (NXG), Companhia Vale de Rio Doce (RIO), Morningstar (MORN)
                  Celgene (CELG), Strayer Education (STRA), Techwell (TWLL), Tower Group (TWGP)
                  Gildan Activewear (GIL), Gerdau (GGB), Big Band Networks (BBND)

Friday: Telenor ASA (TELN), Allis Chalmers (ALY), Tenaris (TS)

Baidu (BIDU) Catches a Bid; Digital River (DRIV) Breaks Out

Today’s High Growth Stock Big Earnings Movers: 

UP

• Baidu.com (BIDU) Internet Info Providers,  fundamental rank [29/30],  up 14%, carving out the right side of a base

Cummins (CMI) Diversified Machinery, fundamental rank [23/30],  up 12%, reversed sharply off the highs after a remarkable run in the past week

• Netgear (NTGR) Communication Equipment, fundamental rank [25/30],  up 11%, added to yesterday’s breakout

• The Ultimate Software Group (ULTI) Internet Software & Services, fundamental rank [25/30],  up 10%, breakout from base on base pattern

• Commscope (CTV) Communication Equipment, fundamental rank [24/30],  up 7%, continuing to add to a very nice February cup base breakout

• National Oilwell Varco (NOV) Industrial Equipment Wholesale, fundamental rank [25/30],  up 5%, adding to a March breakout

• Digital River (DRIV) Internet Software & Services, fundamental rank [26/30],  up 4%, a breakout!

• W-H Energy Services (WHQ) Communication Equipment, fundamental rank [26/30],  up 4%, adding to yesterday’s breakout rom a double bottom base

DOWN

MEMC Electronic Materials (WFR) Semiconductor – Integrated Circuit, fundamental rank [26/30],  down 14%, closed just below support of the 50 day moving average near the lows of the day, indicating further selling pressure ahead

Pericom Semiconductor (PSEM) Networking & Communication Devices, fundamental rank [24/30],  down 11%, carving out right side of base, but that may be failing; took out support of 200 day moving average today

Psychiatric Solutions (PSYS) Specialized Health Services, fundamental rank [25/30],  down 11%, testing support of 200 day moving average

Silicon Motion Technology (SIMO) Diversified Electronics, fundamental rank [28/30],  down 8%, a huge reversal off this morning’s gap up but still has support of 50 day moving average; most likely won’t hold there for very long

Falconstor Software (FALC) Business Software & Services, fundamental rank [23/30],  down 6%, still has support of 50 day moving average and chart still very much bullish; probably will test the 50 day moving average soon

Ceradyne (CRDN) Industrial Equipment & Components, fundamental rank [26/30],  down 6%, ultimately ended at the lows after a wild day of trading; still has support of 50 dma

Abaxis (ABAX) Diagnostic Substances, fundamental rank [23/30],  down 6%, working on right side of ugly base; took out support of 50 dma but still has support of 200dma

VistaPrint (VPRT) Business & Management Services, fundamental rank [27/30],  down 5%, closed well off the lows of the day and still has support of the 50 day moving average; working on right side of base

Local Sub Prime Lender Woes

We’ve all heard about the large, publicly traded sub prime lender meltdowns, but I thought I’d highlight a few significant local implosions that have happened in the past couple months.  The first high profile mortgage implosion in the Seattle area that I’m aware of happened at the end of last year with Merit Financial.  It was run by an ex UW Huskies football player, Scott Greenlaw.  During boom times, Merit Financial could be described as one big party where staff meetings turned into keg celebrations of their new found riches.  That was then.  Now, 400 employees are out of work and company executives are on the verge of bankruptcy, not to mention battling lawsuits left and right.  It’s an interesting read:
http://seattletimes.nwsource.com/html/businesstechnology/2003459108_merit03.html

Just two days ago, another private sub prime lender in the Seattle area, Mortgage Lending Associates, shut its doors abruptly, leaving 300 workers just minutes to pack their things.  Certainly, business isn’t good for lenders right now, but you have to believe that greed greatly contributed to the demise of these two companies.  Said one employee: "We would see things that shouldn’t have been happening," she said Monday. "When we pointed it out, instead of being grateful, they’d get mad at us."  The articles certainly alluded to some of the arrogance and greed of the founders of these two companies, who just so happened to win awards for excellence in business.  Hmm.. where have we seen all this before? 

Here’s the full article: http://wwww.examiner.com/a691341~Lauded_Mountlake_Terrace_subprime_mortgage_wholesaler_collapses.html

Apple Computer (AAPL) & Vasco Data Security (VDSI) Soar to New Heights

Today’s Growth Stock Big Earnings Movers: 

UP

• Vasco Data Security (VDSI) Vasco Data Security International,  fundamental rank [27/30],  up 26%, soared off the 50 day moving average today to new all time highs

F5 Networks (FFIV) Internet Software & Services, fundamental rank [25/30],  up 19%, nearing break out but probably needs to spend some time consolidating from here

• West Pharmaceutical Services (WST) Medical Instruments & Supplies, fundamental rank [24/30],  up 13%, breakout to new all time high, but never formed a right side of a base.. probably needs to digest these gains a bit

• Lincoln Electric Holdings (LECO) Machine Tools & Accessories, fundamental rank [25/30],  up 6%, one ugly chart.. not going anywhere anytime soon

• Apple Computer (AAPL) Personal Computers, fundamental rank [27/30],  up 5%, breakout to new all time high

• West Pharmaceutical Services (WST) Medical Instruments & Supplies, fundamental rank [24/30],  up 13%, breakout to new all time high, but never formed a right side of a base.. probably needs to digest these gains a bit

DOWN

Brush Engineered Material (BW) Industrial Metals & Minerals, fundamental rank [24/30],  down 15%, big drop to support of 50 day moving average; holding there

FormFactor Inc (FORM) Semiconductor – Broadline, fundamental rank [24/30],  down 5%, failed handle formation, needs to spend more time basing

Akamai Technologies (AKAM) Specialty Retail, fundamental rank [27/30],  down 4%, has now taken out two key support levels in the past 2 days

TheStreet.com (TSCM) Internet Info Providers, fundamental rank [27/30],  down 4%, handle formation of base beginning to fail; barely holding at the 200 day moving average

Historically, Streaking Dow Forecasting Further Gains; Resistance in the Way

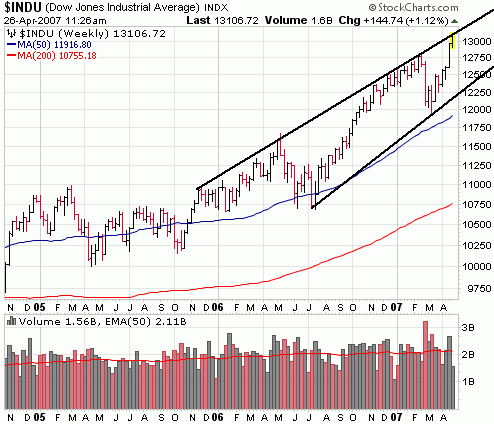
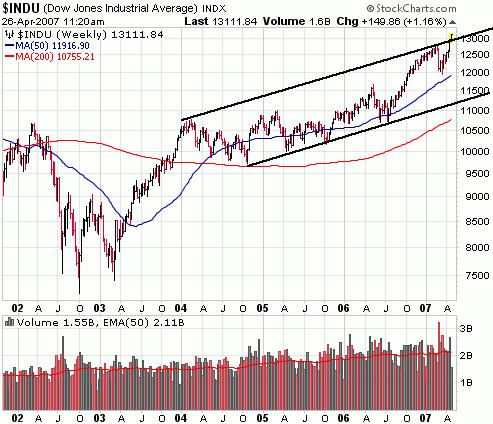
The following is an article from Daily Wealth, reprinted here with permission.  It’s an interesting article that takes a look at the Dow’s recent 8 day winning streak and how the Dow has performed following similar streaks in the past.  Based on historical trends, we can assume a better than 50/50 chance of further gains over varying time periods (chart below).  It should be noted that if not for a down day in the Dow on April 23rd, we’d be looking at an 11 day winning streak (assuming today closes in the green).  That has happened just 5 times.  The recent winning streak creates excitement, but as the chart of the Dow below indicates, there is reason for caution at these levels.  The Dow is hitting its upper trend line over a one year trend and above the upper trend line over a 3 year period.


        dow all time highs 13000

When The Stock Market Does a "Joe DiMaggio"
By Ian Davis
April 26, 2007

Joe DiMaggio is sitting in his clubhouse sipping coffee and smoking a cigarette. The Yankees are in Washington to play a double header against the Senators. While DiMaggio relaxes between games, someone sneaks into the visitors’ dugout and steals his favorite bat…

This petty theft nearly ruins one of the greatest feats in baseball history.

You see, the date is June 24, 1941, and Joe DiMaggio is sitting on a 41-game hitting streak. He’s one game short of beating the record George Sisler set in 1922.

It’s only a "piece of wood" says DiMaggio, but in the second game of the double-header, he hasn’t had a hit in his first three at-bats. Finally, on his final walk to the plate, Tommy Henrich offers him his bat, and DiMaggio accepts.

Red Anderson’s first pitch nearly hits DiMaggio, almost ending his hitting streak. Then, on the second pitch DiMaggio connects, slapping a changeup pitch, into left field. Sisler’s record falls, and DiMaggio goes on to rack up the longest hitting streak to this day, 56 games.

The Dow equivalent of DiMaggio’s record hitting streak was its January 1987 run when it traded higher for 13 consecutive trading sessions. This is the largest streak of up-days in the history of the Dow (since 1928).

Recently, the Dow achieved a rare eight-day streak (between March 29 and April 10, 2007). Let’s take a look at how the Dow performed after these market rarities and if there is any way to profit from investing following these events.

Since 1928, the Dow has rallied for eight or more days only 48 times. This is few enough to make it a rare event, but sufficient to draw some meaningful conclusions. The following chart shows the number of Dow "hitting streaks" that lasted more than four days.

Number of Dow ‘Hitting Streaks’ Since 1928

5 Consecutive Up Days:

374

6 Consecutive Up Days:

190

7 Consecutive Up Days:

85

8 Consecutive Up Days:

48

9 Consecutive Up Days:

25

10 Consecutive Up Days:

11

11 Consecutive Up Days:

5

12 Consecutive Up Days:

3

13 Consecutive Up Days:

1

Total Data Points:

19,717

After the 13-day streak back in 1987, the stock market continued to perform exceptionally well for nine months after the streak ended. However, if you look a year forward, you see the Black Monday stock market crash, which would have erased your returns in one fell swoop.

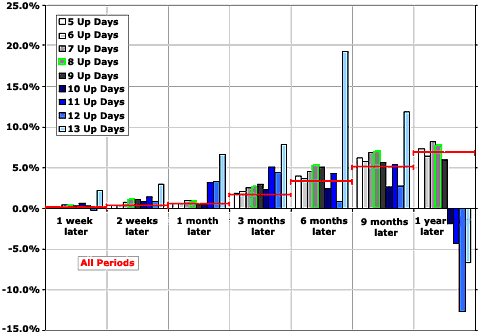
The following chart shows the average performance one week, two weeks, one month, three months, six months, nine months, and one year after each of these hitting streaks. For most of these hitting streaks, the market continues to perform better than or on par with its long-term average. The only exceptions are the 10, 11, 12, and 13-day streaks. These exceptionally long streaks tend to lead to a period of market underperformance in the following 6-12 months.

 Market Returns After Long Streches of Up Days

Since the Dow just underwent an eight-day hitting streak, let’s take a look at how the Dow may perform going forward by looking at past streaks.

The following table gives you a list of probabilities – based on previous occurrences – of the market posting a positive return and/or beating the market after a set period of time. I also tried to give you a sense of risk/reward by showing the ratio of the largest fall compared to the largest rally following these events.

Dow After 8 Consecutive Up Days
1 Week Later
2 Weeks Later
1 Month Later
3 Months Later
6 Months Later
9 Months Later
1 Year Later
% Of Occurrences With A  Positive Return:

58.3%

68.8%

66.7%

75.0%

79.2%

70.8%

70.8%

% of Occurrences That Beat the Average Market Return:

54.2%

66.7%

58.3%

70.8%

62.5%

58.3%

50.0%

Risk/Reward (Largest Loss/Largest Gain):

0.97

0.49

1.51

1.74

1.15

0.96

0.89

For example, if you’d bought following every eight-day up streak since 1928, and held for three months, you would have achieved above-average returns more than 70% of the time. However you also would have experienced the most risk (the largest loss following this strategy was 1.74 times the size of the largest gain).

In conclusion, our hearts tell us that a long stretch of up-days is the mark of an overheating market, and we start to expect a correction. The statistics show otherwise.

Whether you invest for a week or a year, you are more likely to achieve better-than-average market returns by investing following long streaks of up days. The large downside risk of being wrong, however, probably nullifies this strategy.

Nasdaq Joins the Party; Stock of Day – Internet Gold (IGLD)

The bullish fervor was in full force today, with a blow out quarter from Amazon fueling the fire.  Kind of takes you back to the hay day of the late 90’s when moves of $5 – $10 was the rule, rather than the exception.  Ok, not quite, but with new all time highs in the Dow, the S&P500 approaching all time highs and the Nasdaq breaking out with force today, there should be cause for some excitement.  The sell off of February 27th is long forgotten and new (much higher) support levels are in place.  At this point, those new support levels could provide a floor for the market to stage a summer rally.  However (at the risk of sounding like a broken record), keep in mind the parabolic rise over the last few weeks with absolutely no pause for a rest.  If you have some big gains avoid the greed and lock in some profit.  If you missed much of this move like I have, don’t chase it.  There are very few good entry points out there right now, particularly in the small to mid caps as this has been a predominantly large cap fueled rally.  They will emerge though.  Patience.

::: Major Indices Performance – The Numbers :::

(Note: volume averages are based on the average over the past 50 days)
Data as of 4:00EST – End of Day April 25th 2007

Accumulation in all indices.

Nasdaq: UP .92% today with volume 25% ABOVE  average
Nasdaq ETF (QQQQ) UP 1.33%, volume 13% BELOW average
Dow: UP 1.05%, volume 2% ABOVE the average
Dow ETF (DIA): UP .88%, volume 34% ABOVE the average
S&P ETF (SPY): UP .92%, volume 1% BELOW the average
Russell Small Cap ETF (IWM): UP  .29%, volume 17% BELOW the average

::: SelflInvestors Leading Stocks :::

The Self Investors Leading Stocks Index is comprised of stocks in the Breakout Tracker, which is a database of the fastest growing companies near a breakout or having already broken out of a base.  Leading stocks (smaller, high growth) just did OK today – they significantly lagged the performance of the major indices and the advancers over decliners ratio was just barely above 2:1 (not impressive on a big move today).

Summary:

* Advancers led Decliners 276 to 123
* Advancers were up an average of 1.69% today, with volume 9% ABOVE average
* Decliners were down an average of 1.66% with volume 49% ABOVE average
* The total SI Leading Stocks Index was UP  .65% today with volume 21% ABOVE the average

::: Where’s the Money Flowing :::

Many investing websites provide leading industries based on price performance alone. However, without accompanying volume levels, this can sometimes be misleading.  The only way that I know of to gauge industry/sector strength WITH volume levels is through the analysis of ETF’s.  A couple years ago this was not possible, but as more traders/investors use ETF’s they become a much better tool for gauging the health of the market and seeing where the money is flowing (or not flowing).  Using the proprietary SelfInvestors Demand Indicator score which measures price and volume movements, I’m able to quickly see which sectors/industries are seeing the greatest inflows of cash.  For a detailed look at how I go about gauging sector/industry strength please see the following post: http://selfinvestors.com/si/industry_tracking/

* Current Leading Sectors/Industries (over last 30 trading days): 
Semiconductors, Broadband, Biotech, Networking, Utilities
                                              
* Current Lagging Sectors/Industries (over last 30 trading days): 
Agriculture, Home Builders

* Today’s Market Moving Industries/Sectors (UP):
Oil Services, Internet, Networking, Transports, Energy

* Today’s Market Moving Industries/Sectors (DOWN):
Internet Infrastructure, Health Care Providers

::: Stocks :::

The stocks section will be an area where I highlight one stock selected from a group of stocks moving up with volume well above average and most likely breaking out of a base or consolidation.  Today’s stock is for the most part off the radar of Wall St. with just one analyst covering it, technically bullish and poised for a break out.

ABOUT:  Internet Gold Golden Lines Ltd. is a communications company that provides Internet access and related value-added services, international telephony, e-advertising, content and e-commerce services throughout Israel under the brand name smile. The Company launched its International Telephone Service (ITS) under the brand 015 in August 2004. The license to provide ITS was granted for 20 years. It has two focused businesses: Communication and Media. Communications provide Internet services and international telephony services, such as Internet Access, Value Added Services, International Telephony, and IT Integration businesses focus on the provision of services and support to individual and business end-users. Media provides Website content provision, portal operating, search engines, lead-generation, e-Commerce and Paid Content. In January 2007, the Company’s wholly owned subsidiary, Smile.Communications Ltd., completed the acquisition of 012 Golden Lines Ltd.

FUNDAMENTALS: Internet Gold (IGLD) is an Israeli company that appears to be on the verge of a major growth spurt.  While a small company that has been turning a profit for several years now, not until the last 3 quarters has the company shown explosive growth.  The growth at the end of 2006 was enough to help double their profits over the previous year.  2007 is expected to be even bigger with an earnings estimate calling for 130% growth.  I like the fact that management owns 70% of the company which indicates they have a strong vested interested in seeing the company succeed.  Net margins aren’t impressive at 7% but it is improving quickly.  Return on Equity is excellent at around 16%. 

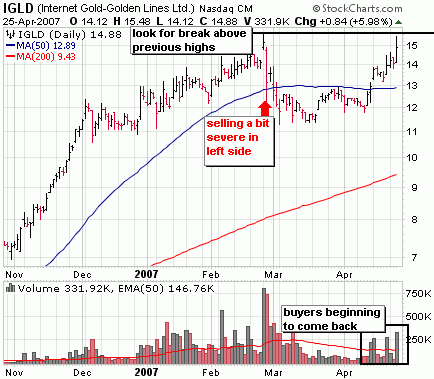
TECHNICAL:  IGLD is in the process of carving out the right side of a fairly short base, but one that is looking quite bullish.  Based on the big, high volume drop in the weekly chart at the beginning of March, the base is probably too short to work through that technical damage.  I’d be hesitant to initiate a position on a break out from this current base and would rather catch it on a pull back from any break out.  The company reports earnings on May 8th which could very well be the catalyst this stock needs to soar to new heights.  Put it on the radar.

        internet gold breakout stock

SELFINVESTORS RATING: With a total score of 50/60 (24/30 for fundamentals, 26/30 for technical), Internet Gold (IGLD) is a very good break out candidate.

Full Disclosure/Disclaimer: The stock of the day is by no means a buy recommendation.  Please do your own research and make a personal decision based on your own tolerance for risk.  I currently do not own a position in Internet Gold (IGLD).