All posts by Tate Dwinnell

Nasdaq Breaks Out of Range, S&P Reclaims Support But…

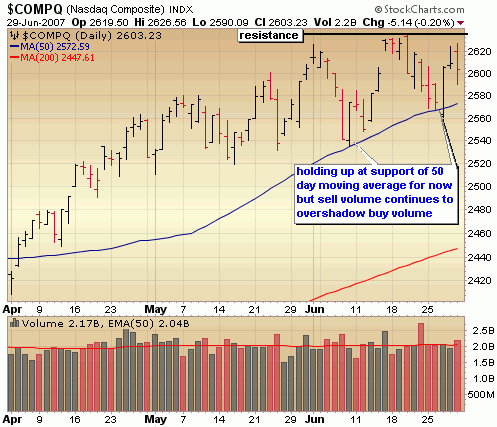
In a return to the trading action we’ve seen over the past few months, it seemed the market was going to find some kind of excuse to push higher.  The Nasdaq led the way and busted out of a trading range to a new multi year high.  The S&P reclaimed support of its 50 day moving.  This alone is very bullish action, but as I’ve been mentioning we can’t place too much importance on it due to the light holiday trading volume. 

At this point, until the bears can strike with significant technical damage, the bulls still have the upper hand.  As normal trading volume levels return next week, keep  an eye on the 50 day moving averages of the indices.  It’s an area that is shaping up as a key short term support level, particularly for the Dow and Nasdaq.

::: Model Portfolio Update :::

It was another week of relative inaction on my part, choosing to sit largely on the sidelines until holiday traders come back and we get some meaningful volume.  It was a good week for the market and even better for the SelfInvestors Model Portfolio which jumped 2.2%.  My strategy at this point is to remain leaning to the bullish side but initiating smaller postions and locking in profits quicker than I ordinarily would.  A good example of this was the sell of GMCR Friday morning.  The stock is still showing very bullish action and no signs of slowing down but considering I had a 30% gain in just a month I had no problems locking in the gain.  It had just come too far too fast in a market that is on a bit of shaky ground.  As it turns out the stock closed considerably higher by the end of the day but I don’t have an regrets.  The only other transactions that were made during the week were 2 small Quick Strike Profit long entries.  The current allocation of the portfolio is 55% long, 20% short and 25% cash.

::: Best/Worst Performers :::

– Top 10 Performing Industries For the Week –

1. Lodging: 10.35%
2. Diversified Electronics: 8.60%
3. Silver: 8.50%
4. REIT – Hotel/Motel: 8.00%
5. Heavy Construction: 7.85%
6. Copper: 7.60%
7. Gold:  7.55%
8. Aluminum: 7.35%
9. Shipping: 7.15%
10. Industrial Metals & Minerals: 6.90%

– Top 10 Worst Performing Industries For the Week –

1. Music & Video Stores: -2.95%
2. Sporting Goods: -1.60%
3. Investment Brokerage: -1.20%
4. Personal Service: -1.10%
5. Manufactured Housing: -1.00%
6. Movie Production – Theatres: -.90%
7. Long Term Care Facilities: -.90%
8. General Entertainment: -.90%
9. Printed Circuit Boards: -.90%
10. Air Delivery & Freight Service: -.80%

– Top 5 Best Performing ETFs For the Week –
 
1. Turkish Investment Fund (TKF)  8.25%
2. Ishares South Korea (EWY) 7.85%
3. Korea Fund (KF) 7.80%
4. Market Vectors Gold (GDX) 7.70%
5. Japan Small Cap (JOF) 7.20%

– Worst 5 Performing ETF’s –

1. Herzfeld Caribbean Basin (CUBA)  -4.20%
2. HLDRS Biotech (BBH) -.80%
3. HLDRS Internet Infrastructure (IIH) -.20%
4. Ishares Home Construction (ITB) -.05%
5. Powershares Dynamic Biotech (PBE) -.05

:::  IPO’s Worth Watching for This Week :::

No IPO’s worth watching again  this week- the summer slowdown is upon us.

::: Upcoming Economic Reports (7/9/07 – 7/13/07) :::

Monday:        Consumer Credit
Tuesday:       Wholesale Inventories
Wednesday:  Crude Inventories
Thursday:      Initial Claims, Trade Balance, Treasury Budget
Friday:           Export/Import Prices, Retail Sales, Business Inventories, Mich. Sentiment (prelim)

::: Notable Upcoming Earnings Reports I’ll Be Watching This Week :::

Tuesday: HDFC Bank (HDB)
Wednesday: Genentech (DNA), Acergy (ACGY)
Thursday: Fastenal (FAST)

Hang on to your hats.. earnings season begins to ramp up next week!

::: In Case You Missed It – SelfInvestors Blog Entries of the Past Week :::

1. Stocks Rocket, But With Little Sizzle; Stock of Day NVE Corp (NVEC)
https://selfinvestors.com/tradingstocks/weeklyafter-stock-market-review-archives/stocks-rocket-with-little-sizzle-stock-of-day-nve-corp-nvec/

2. Blackstone (BX) Buying the World, Adds Hilton (HLT)
https://selfinvestors.com/tradingstocks/news/blackstone-bx-buying-the-world-adds-hilton-hlt/

:::::::::::::::::::: Billboard ::::::::::::::::::::::::::::::::

Buying a home in the US is everyone’s dream. But without home mortgage refinancing you cannot afford to buy your dream house. If you had bad credit in your past then a bad credit loan can help you to sort out your problems. To protect your bad credit, insurance companies play vital roles in it. They give full cover insurance of your home mortgage. Because without insurance, you cannot afford to have a credit loan, for this you have to remove your bad credit loan history. This will also help to solve your credit debt problem.
The Real L A W of Commerce – Land – Air – Water

The following is republished with the permission of Gary Scott.  Gary, publishes one of the few newsletters I make a point to read every day and highly recommend it to my readers.  He also runs several seminars throughout the year in both Ecuador and North Carolina that cover everything from Spanish courses, holistic health, import/export, investing and real estate.  Be sure to check his site and sign up for his newsletter at http://www.garyascott.com/ !
—————————————————————————————

The Real L A W of Commerce – Land – Air – Water
 

by Gary Scott

The image problem of Chinese products has no real quick fix because a huge part of the problem goes beyond China. This is a global environmental concern.
 
Chinese fish is one example.  Seafood has always been treated as high-risk but the newer problem is that half the fish consumed in the U.S. is now farmed. This is due to the huge demand created by the ever growing global population.  Growing healthy fish requires plenty of land, lots of clean water and enough pure air.  Otherwise the fish get crowded. They become stressed and disease breaks out.  Chemicals and antibiotics become necessary to keep the fish alive and these become poison for the consumer.
 
Chinese problems are magnified because it has the largest population in the world and is going through an industrialization where everyone in the economy becomes materialistically wealthier and consumes more. The problems in China simply shine a bigger light on the tension created by increasing demand on finite resources.
 
The real LAW of the future global economy will be governed by availability of Land, Air and Water.
 
LAND
 
The demand for land is easy to see.  According to a Mercer Human Resource Consulting 2006 survey, eight of the most expensive cities in the world are already in Asia, two in China. This is because there are so many people who want to be in the Asian industrialized space.
 
March 2006 Rank City March 2005 Rank
1  Moscow, Russia 
2  Seoul, South Korea 
3  Tokyo, Japan 
4  Hong Kong, Hong Kong
5  London, United Kingdom 
6  Osaka, Japan 
7  Geneva, Switzerland 
8  Copenhagen, Denmark 
9  Zurich, Switzerland 
10 (tie)  Oslo, Norway 
10 (tie)  New York City, United States 
12  St. Petersburg, Russia 
13  Milan, Italy 
14  Beijing, People’s Republic of China 
15  Istanbul, Turkey 
16  Paris, France 
17  Singapore, Singapore 
18  Dublin, Ireland
19  Sydney, Australia 
20  Shanghai, People’s Republic of China
 
AIR
 
A reader recently sent me this note “Gary: Interesting that China has passed us as the top air polluters. Even so, according to Investor Business Daily they are adding a new coal fired power plant big enough to light San Diego every seven to ten days.”
 
The British newspaper, the Telegraph, recently reported: “China has surpassed the US as the world’s largest producer of carbon dioxide, the most important greenhouse gas. Surging demand for energy in the world’s most populous nation has led to a surge in construction of coal-fired power stations, pushing China’s production of CO2 to 6,200m tons of CO2 last year, compared with 5,800m tons from the US.  By comparison, the UK produced about 600m tons, according to research produced for the Dutch government.  The announcement that China tops the league of CO2 emissions by a clear eight per cent comes a number of years earlier than expected.”
 
This problem will not be solved soon. 
 
WATER
 
A reader sent me this note: “GaryI had no idea things were as bad as this extract from MONEY AND MARKETS appears to indicate that the United Nations says two-thirds of the planet could soon suffer a shortage of this amazingly precious natural resource. In China, an estimated 500 million people go without access to clean water every day. In India, the crisis is even worse. Over half the cities in India are suffering from a shortage of potable water. They have essentially become nothing more than cesspools, causing tens of thousands of men, women and children to die every year. Even Australia, a country loaded with natural resources, is being hit hard by water shortages. So much so that a 10-year, $10 billion national spending bill was introduced this year in Sydney. Globally, every 45 seconds of every hour … of every day …a child dies from lack of potable drinking water including adults, an estimated 1.1 BILLION people in the world now live without access to clean drinking water. According to the World Health Organization, more than 4 billion could be living under stressful water conditions by 2050.  This is a problem. A big one. So much so that Fortune magazine recently stated that "Water promises to be to the 21st century what oil was to the 20th century: The precious commodity that determines the wealth of nations. This article says that governments around the globe are about to spend nearly $1 TRILLON trying to solve the shortage. So they’re aware of the problem — acutely aware. That’s especially true in China, where hundreds of billions of dollars will be spent.  Looks as though you were right on the button with your ideas.  Best regards”
 
The water crisis is not going to be overcome in a short time either.  Regulators can make rules. Nations can create borders and barriers and tax.  Businesses can distort markets. Yet in the end the real LAW will prevail.
 
Invest in Land, Air and Water.  These are the biggest trends we will have seen in numerous decades.
 
Until next message, I hope your investments and business are supported by this LAW.
—————————————————–

Gary’s doesn’t mention this in this email but it brings up the important point again.  As the #1 polluter, why is China exempt from Kyoto?
The easiest way to invest in the water industry?  Take a look at the Powershares Water Resources Portfolio ETF (PHO) which I wrote about last summer over at my ETF portal.  It’s up 26% in that time.  I’d recommend getting in at pull backs to the 50 day moving average from this point on..  For a diversified way to play alternative energies, take a look at the PowerShares Clean Energy Portfolio ETF (PBW).  I first wrote about PBW over at my ETF portal a year and a half ago and continue to believe you should add on the dips. 
Disclaimer: I own shares of PHO and will continue adding shares.

Blackstone (BX) Buying the World, Adds Hilton (HLT)

Hours ago, Blackstone Group (BX) announced they were purchasing all outstanding shares of Hilton Hotels (HLT) for 47.50, a whopping 32% premium .  for around 26 billion (including debt) .  Wow!  This comes within a year of Blackstone buying out CarrAmerica Realty for 5.6 billion and most recently Equity Office Properties for (EOP) 36 billion.  The buyout of EOP was a bit questionable and came at what many consider a possible top of the REIT market.  Now the big Hilton buyout which undoubtedly makes Blackstone one of the (if not the largest) holders of real estate in the world (they now own 580,000 hotel rooms in 76 countries).  Wouldn’t a purchase like this with a large premium have made more sense a few years ago.. before global real estate prices went parabolic?  Perhaps this is more about greed, ego and power than doing what’s in the best of interest of shareholders.  After all, Schwartzman already made his money with the IPO. You’ve got one unhappy shareholder here – I bought a very small position today with expectations of some kind of snap back rally.  Those expectations are gone after tonight’s announcement.   I’ll take a hit on Thursday.

I wonder if a few folks didn’t catch wind of this deal going down at a few cocktail parties this weekend?  The stock was up 6% with volume more than twice the daily average… and with a pre-holiday half day of trading!  The rich get richer.  Surprise, surprise.  I look forward to reading all the commentary on this one. 

Stocks Rocket With Little Sizzle; Stock of Day – NVE Corp (NVEC)

A bit of a pre holiday pop today after another round of Monday merger mania and a positive ISM number which came in a bit above expectations.  It was a surprisingly strong day today and the Nasdaq came within inches of a new mutli year high, but you really can’t take away too much from it.  Trading volume was light ahead of the holiday and that should remain throughout the week.  We can’t place too much importance on market moves until probably early next week.

* This will be the last report from me until Thursday – have a great 4th!

::: Major Indices Performance – The Numbers :::

(Note: volume averages are based on the average over the past 50 days)
Data as of 4:00EST – End of Day July 2nd 2007

Nasdaq: UP 1.12% today with volume 11% BELOW  average
Nasdaq ETF (QQQQ) UP .86%, volume 34% BELOW average
Dow: UP .95%, with volume 14% BELOW the average
Dow ETF (DIA): UP .8%, volume 37% BELOW the average
S&P ETF (SPY): UP .9%, volume 24% BELOW the average
Russell Small Cap ETF (IWM): UP 1.24%, volume 28% BELOW the average

::: SelflInvestors Leading Stocks :::

The Self Investors Leading Stocks Index is comprised of stocks in the Breakout Tracker, which is a database of the fastest growing companies near a breakout or having already broken out of a base.  Leading stocks did extremely well today but the lack of volume behind the move wasn’t surprising given the holiday week.

Summary:

* Advancers led Decliners 313 to 61
* Advancers were up an average of 2.27% today, with volume 8% BELOW average
* Decliners were down an average of 1.04% with volume 4% ABOVE average
* The total SI Leading Stocks Index was UP 1.73% today with volume 5% BELOW average

::: Where’s the Money Flowing :::

Many investing websites provide leading industries based on price performance alone. However, without accompanying volume levels, this can sometimes be misleading.  The only way that I know of to gauge industry/sector strength WITH volume levels is through the analysis of ETF’s.  A couple years ago this was not possible, but as more traders/investors use ETF’s they become a much better tool for gauging the health of the market and seeing where the money is flowing (or not flowing).  Using the proprietary SelfInvestors Demand Indicator score which measures price and volume movements, I’m able to quickly see which sectors/industries are seeing the greatest inflows of cash.  For a detailed look at how I go about gauging sector/industry strength please see the following post: http://selfinvestors.com/si/industry_tracking/

* Current Leading Sectors/Industries (over last 30 trading days): 
Technology, Oil & Gas Services, Commodities, Semis
                                          
* Current Lagging Sectors/Industries (over last 30 trading days): 
Real Estate, Biotech, Regional Banks, Home Construction

* Today’s Market Moving Industries/Sectors (UP):
Realty, Real Estate, Clean Energy, REIT, Utilities, Telecom

* Today’s Market Moving Industries/Sectors (DOWN):
None

::: Stocks :::

The stocks section will be an area where I highlight one stock selected from a group of stocks moving up with volume well above average and most likely breaking out of a base or consolidation.  Today’s stock is a stock I highlighted to premium members on Friday and purchased for the SelfInvestors Model Portfolio.  Today, it followed through from Friday’s move and soared above the high of the handle formation of a large cup base.

ABOUT:  NVE Corporation (NVE) develops and sells devices using spintronics, a nanotechnology it helped pioneer, which utilizes electron spin rather than electron charge to acquire, store and transmit information. The Company is a licensor of spintronic magnetoresistive random access memory technology (MRAM), which has the potential to revolutionize electronic memory. NVE also manufactures spintronic products, including sensors and couplers that are used to acquire and transmit data. The Company’s designs use one of two nano-scale spintronic structures: giant magnetoresistors or spin-dependent tunnel junctions. Both structures produce a large change in electrical resistance depending on the electron spin orientation in a free layer. In giant magnetoresistance (GMR) devices, resistance changes due to conduction electrons scattering at interfaces within the devices. NVE operates through a single segment and has three product lines to offer: sensor products, coupler products and MRAM products.  The company provides its technology to Starkey Laboratories, which improve the user experience with its hearing aids, allowing for the automatic adjustment during a cell phone call as well as smaller hearing aid devices.  Another major customer is St Jude Medical, which uses NVEC technology in its pacemakers and implantable cardioverter defibrillators.

FUNDAMENTALS: NVEC is a very small company (15.4 million in sales in ’06) that experienced tremendous growth in 2003 when it posted its first profitable year and then again in 2004 when earnings more than doubled over ’03.  Then the company hit a bit of a snag and posted poor results over the next two years.  However, the good times are here again for NVEC.  Over the past year, the company has posted quarter over quarter earnings growth of 111%, 238%, 144% and 154% and sales growth has accelerated nearly every quarter over the past year.  2008 estimates call for a 30% increase in earnings over 2007, so it’s clear the company is finding additional customers and larger contracts for its technologies. .. and those companies are willing to pay a premium with pre tax margins of 44%.  Return on equity is equally impressive at around 25%.

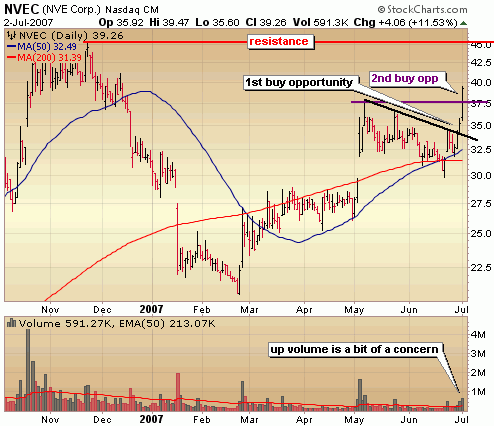
TECHNICAL:  On Friday, NVEC provided the first buy opportunity when it broke through the downward trend (by drawing a line across the highs) of the handle.  Today, it confirmed that move and provided a 2nd buy opportunity when it cleared the high of the handle formation above 37.67.  Over the past 2 days, the stock has vaulted nearly 20% but the volume behind the move is a bit of a concern.  Trading volume today was less than the volume during the move in early May as well as the move on February 26th.  That being said, I believe the stock has enough momentum to hit resistance around the November ’06 highs, but should not be chased at these levels.  If you missed the two buy opportunities wait for some kind of pull back to at least 37.67 and preferably to the area around 35.  I’m looking to take profits around the November highs due to the severity of this base which is too deep with sell volume too intense in the left side.  I believe the base is prone to failure after it hits 45 but would reconsider another position if it can surge above that level and hold for a few weeks.

nve corp nvec stock chart breakout

SELFINVESTORS RATING: With a total score of 49/60 (26/30 for fundamentals, 23/30 for technical), NVE Corp (NVEC) is a high quality breakout stock.

Full Disclosure/Disclaimer: The stock of the day is by no means a buy recommendation.  Please do your own research and make a personal decision based on your own tolerance for risk.  I currently DO own a position in NVEC.

Sub Prime Concerns Weigh on Market, But Holding Firm

With a slew of economic reports, a fed decision and end of quarter trading, it was expected to be a wild week of trading – which it was, with volatile intraday swings throughout the trading week.  However, bulls and bears just chased each other’s tails around and the net result was little change for the week. 

Sub prime concerns continue to crop up with news of a couple Bear Sterns hedge funds near collapse due to over exposure in the sup prime market.   Any additional news about the sub prime melt down spreading to the top of the food chain is a concern that will no doubt be watched closely.  My feeling is that it’s going to get much worse before it gets better.  Tempering the sub prime concerns this week was another decent inflation reading on Friday with the PCE core deflator rising just .1% in May bringing the year over year inflation reading to 1.9% which is at the top, but within the Fed comfort zone of 1 – 2%.  I just wonder when the Fed is going to place more importance on energy and food prices which have typically been excluded due to their volatility. 

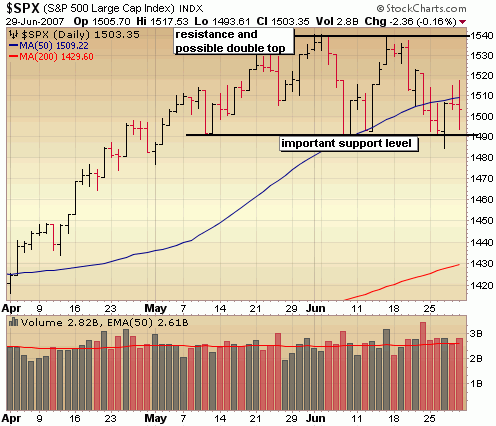
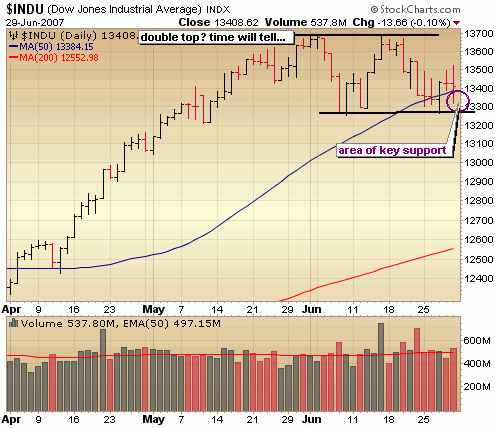
From a technical standpoint, I’d call the action of last week nearly neutral.  On the bearish side, four of five trading days resulted in a close near or at the lows of the day.  Several weeks ago,  traders were looking to buy the dips, but the theme now is that traders are looking to sell the rallies.  On the bullish side, the bears continue to have trouble exerting any kind sustained control as the Dow was able to reclaim support of its 50 day moving average and the Nasdaq continues to hold above that level.  All in all, the market seems a bit uncertain about which way it wants to go at this time and you know what that means for you the successful trader.. let it sort itself out without making large bets in either direction.  Next week is a holiday week, so don’t expect the market to reveal many clues as to its direction until the following week.  If you’re thinking of vacationing for a few weeks and watching the market from the sidelines, now is a great time 🙂  If you are more of an active trader like myself, consider locking in profits a bit earlier and be quicker to cut losses.

Market Action This Week: Neutral
Outlook for the Next Month: Leaning Bearish

nasdaq chart

s&p500 chart

dow jones chart

::: Model Portfolio Update :::

I’m continuing to remain quite cautious with the model portfolio right now with a sizable portion in cash and the portfolio relatively even in long and short positions.  Few transactions were made during the week with 3 positions closed and one new small long position initiated.  I closed out my FMCN position for a 17% gain.  I hate to close out positions after a big move like it had on Friday, but I did sell near Friday’s high and think it will have trouble getting much higher than that in the coming weeks.  FMCN is now trading just above the upward trend line which could indicate a parabolic move from here or indicate it’s overbought in the short term and needs to consolidate significantly.  Considering the market is a bit shaky right now and me having some trouble of late locking in some significant gains, I opted to lock in the profit and look for a better entry to reinitiate a trade.  On the losing side, I did close out 2 trades in BTJ (a short) and SYNL for losses of 9% and 10% respectively, but both were very small positions, so it didn’t hit the portfolio too hard.  The SYNL trade was particularly difficult to swallow because I had a decent gain on the stock before it turned a jeckyl and hyde on me and went from bullish breakout to nine straight days of declines!  I rode this one out thinking it would get a bounce at the 50 moving average, but that never materialized and found myself eating a loss.  Such is trading.  Sometimes the most bullish of charts don’t always act as they should.  The good news is that they work more often than not, so that if you keep your losses small enough you can make lots ‘o money over the long haul.  For the week, the portfolio was off a bit and the YTD stands at 4.3%, which is still a bit shy of the S&P500 YTD performance of 6%.  My goal is to stay close to even with the S&P through the summer, before really ramping up my performance in the last 3 months of the year, which is typically a bullish time of year.

::: Best/Worst Performers :::

– Top 10 Performing Industries For the Week –

1. Toy & Hobby Stores: 15.60%
2. Education & Training Services: 7.75%
3. Water Utilities: 6.45%
4. Reseach Services: 4.70%
5. Dairy Products: 4.35%
6. Tobacco Products: 4.20%
7. Diversified Communications:  4.00%
8. Sporting Goods Stores: 3.85%
9. Cigarettes: 3.75%
10. Auto Manufacturers: 2.65%

– Top 10 Worst Performing Industries For the Week –

1. Residential Construction: -4.35%
2. Printed Circuit Boards: -3.80%
3. Diversified Investments: -3.55%
4. Music & Video Stores: -3.40%
5. Mortage Investment: -3.20%
6. Oil & Gas Equipment & Servicese: -3.10%
7. Specialty Retail: -3.00%
8. Drug Manufacturers: -3.00%
9. Business/Management Services: -2.90%
10. Silver: -2.80%

– Top 5 Best Performing ETFs For the Week –
 
1. HLDRS Internet Infrastructure (IIH)  3.45%
2. India Fund (IFN) 2.90%
3. Central Europe and Russia Fund (CEE) 2.60%
4. HLDRS Telecom (TTH) 2.50%
5. Chile Fund (CH) 2.45%

– Worst 5 Performing ETF’s –

1. Latin America Discovery Fund (LDF)  -8.90%
2. Morgan Stanley China (CAF) -5.45%
3. Ishares Silver (SLV) -5.05%
4. Ishares Homebuilders (ITB) -4.90%
5. SPDR Homebuilders (XHB) -4.70

:::  IPO’s Worth Watching for This Week :::

No IPO’s worth watching for the next two weeks – the summer slowdown is upon us.

::: Upcoming Economic Reports (7/2/07 – 7/6/07) :::

Monday:        ISM Index
Tuesday:       Factory Orders, Pending Home Sales, Auto/Truck Sales
Wednesday:  None – Holiday
Thursday:      Initial Claims, ISM Services, Crude Inventories
Friday:           Nonfarm Payrolls, Unemployment Rate, Hourly Earnings

::: Notable Upcoming Earnings Reports I’ll Be Watching This Week :::

None for this week but we are fast approaching earnings season!

::: In Case You Missed It – SelfInvestors Blog Entries of the Past Week :::

1. 9 IPO’s to Consider Right Now
https://selfinvestors.com/tradingstocks/ipos/ipo-watch-list-top-9-ipos-to-consider-right-now/

Note: Be sure to the check out the latest addition of the Investors Blog Network Festival at BioHealthInvestor

IPO Watch List: Top 9 IPO’s to Consider Right Now

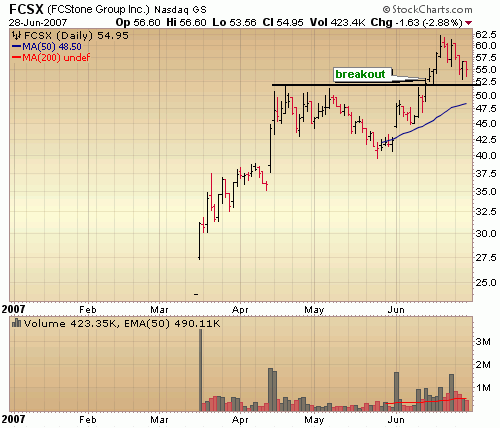
The following IPO’s combine both superior fundamentals and bullish trading action and are in a buyable range or close to it.  Many recent IPO’s are often off the radar of Wall St and the general public (with the exception of a few high profile ones such as Blackstone (BX) and Interactive Brokers (IBKR)), which can sometimes lead to explosive profits.  What I look for is a breakout  from the first area of consolidation or base to initiate an initial position.  Keep in mind that a few of the IPO’s below (such as FCSX) have already broken out but may pull back to a buyable range (near the breakout or pivot point).

FC Stone Group FCSX IPO chart

FCStone Group, Inc. (FCStone) is an integrated commodity risk management company providing risk management consulting and transaction execution services to commercial commodity intermediaries, end-users and producers. It assists primarily middle market customers. In addition, to its risk management consulting services, FCStone operates an independent clearing and execution platforms for exchange-traded futures and options contracts.  FCStone operates in four segments: commodity and risk management services (C&RM), clearing and execution services, financial services and grain merchandising.

The stock broke out in the middle of June with good volume and is in the process of returning to that point and may provide another opportunity to initiate a position.

:::::::::::::::::::::::::::::::::::::::::::::::::::::::::::::::::::::::::::::::::::::::::::::::::::::::::

Just Released!  You won’t find a better IPO Tracking system than the one I’ve just released here at SelfInvestors.com  – a sortable, dynamic database of only the best IPO’s of the past year.  You will never miss the next hot IPO again.  Sign up below for a limited introductory offer on the all new IPO Tracker as well as free tips and tricks for trading IPO’s.


First Name:   
Email:         


:::::::::::::::::::::::::::::::::::::::::::::::::::::::::::::::::::::::::::::::::::::::::::::::::::::::::

InnerWorkings INWK IPO chart

InnerWorkings, Inc. is a provider of print procurement solutions to corporate clients in the United States. The Company creates bid process to procure, purchase and deliver printed products as part of an outsourced enterprise solution and in individual transactions. Its applications and database, PPM4, creates an integrated solution that stores, analyzes and tracks the production capabilities of its supplier network, as well as quote and price data for each bid the Company receives and print job it executes. Through its network of over 5,000 suppliers, the Company offers a range of print, fulfillment and logistics services. InnerWorkings, Inc. procures printed products for clients across a range of industries, such as advertising, consumer products, publishing and retail.

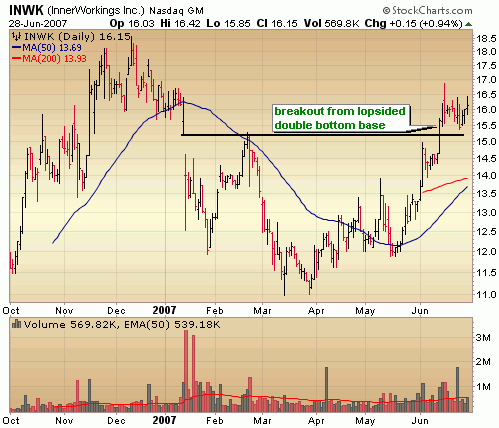
The stock broke out of a fairly sloppy double bottom base in early June and is now digesting gains after a more than 30% run in just a few weeks.  I’d want to see it spend a few more weeks consolidating and/or drop to around 15 to initiate a position. 

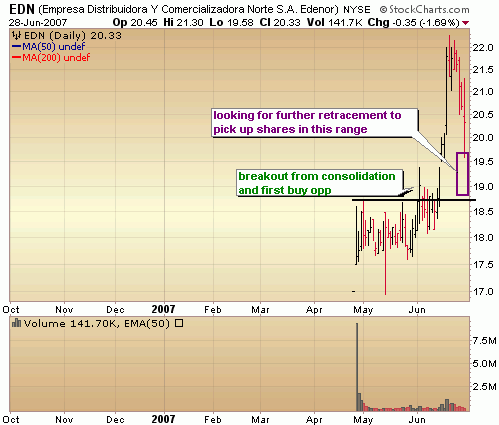
Empresa Distribuidora EDN ipo chart

Empresa Distribuidora y Comercializadora Norte S.A. (Edenor) is the largest electricity distribution company in Argentina in terms of number of customers and electricity sold (both in GWh and Pesos).  Through a concession, Edenor distributes electricity exclusively to the northwestern zone of the greater Buenos Aires metropolitan area and the northern part of the city of Buenos Aires, which has a population of approximately 7 million people and an area of 4,637 sq. km.

The stock broke out of a short flat base before taking off to a nearly 20% gain.  It’s now in the process of retracing that move and may offer a good reentry point.  I’m looking for an entry in the 18.75 – 19.75 area.  I think this one has the potential for tremendous gains over the next few years.

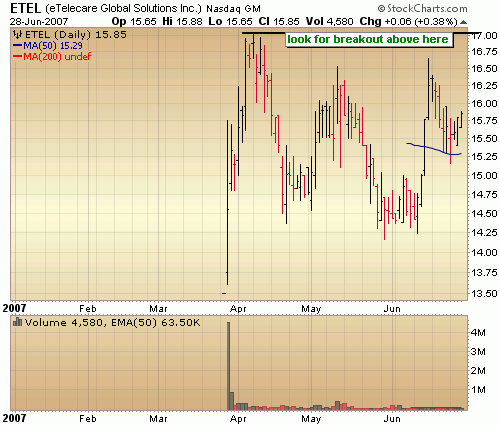
eTelecare Global Solutions ETEL ipo chart

eTelecare Global Solutions, Inc. (Telecare) is a provider of business process outsourcing (BPO) services focusing on the voice-based segment of customer care services delivered from both onshore and offshore locations. eTelecare provides a range of services, including technical support, financial advisory services, warranty support, customer service, sales, customer retention, and marketing surveys and research. Its services are delivered from four delivery centers in the Philippines and seven delivery centers in the United States.

Fairly simple here.. I’m just looking for a breakout from this base above 17 with some volume behind it.

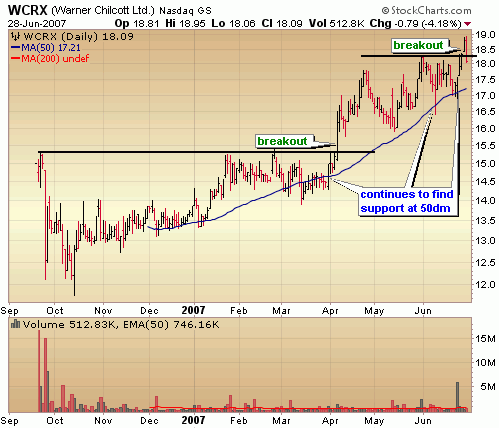
Warner Chilcott WCRX ipo chart

Warner Chilcott Limited (Warner Chilcott) is a specialty pharmaceutical company focused on segments of the United States pharmaceutical market, womenGÇÖs healthcare and dermatology.

The stock first broke out at the beginning of April, which offered an initial opportunity to get in.  Since then, it’s been trending nicely along the 50 day moving average and recently broke out of short consolidation.  I think it offers a good entry here, but the closer to the 50 day moving average, the better.

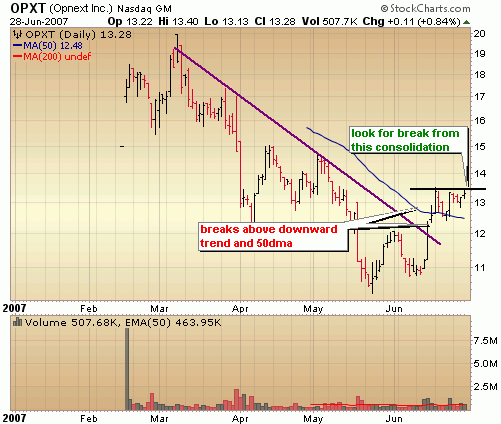
Opnext OPXT ipo chart

Opnext, Inc. is a designer and manufacturer of optical modules and components, which enable high-speed telecommunications and data communications networks globally.

After a long downtrend, the stock is beginning to turn the corner with a recent surge above resistance of the downward trend and the 50 day moving average.  I’m looking for an entry on a high volume break from this short consolidation area.

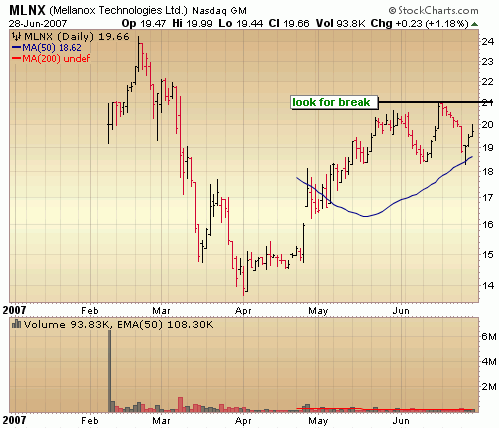
Mellanox Technologies MLNX ipo chart

Mellanox Technologies, Ltd. is a supplier of semiconductor-based interconnect products that facilitate data transmission between servers, communications infrastructure equipment and storage systems. The Company’s products is a part of a total solution focused on computing, storage and communication applications used in enterprise data centers, computing and embedded systems.

The stock is working on a big cup base (albeit a bit of steep one) and is carving out a handle formation.  I’m looking for a breakout from this consolidation with volume as an opportunity to initiate a position.

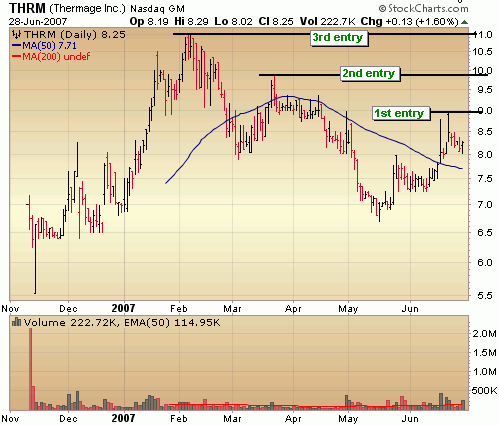
Thermage THRM ipo chart

Thermage, Inc. designs, develops, manufactures and markets medical devices for the non-invasive treatment of wrinkles. The Company’s Thermage procedure can be performed on any part of the body where treatment of wrinkles is desired. Its ThermaCool system uses monopolar radiofrequency (RF) energy to heat and shrink collagen and tighten dermis and subcutaneous tissue while simultaneously cooling and protecting the surface of the skin. The heating and shrinking of the collagen can cause a healing process to begin, which may further tighten the skin and reduce wrinkles over the next 2 to 6 months. The Thermage procedure is normally performed in a medical office setting as a single treatment that takes from 20 minutes to 2 hours, depending on the treatment area.

I’ve written before about how stocks offer multiple entry points and THRM illustrates this well.  A break from the first consolidation above the 50 day moving average is entry point 1.  A break above the middle peak of what could be described as a lopsided double bottom would provide a 2nd entry and of course a break to a new all time high would indicate entry 3.  A fast growing company in a hot industry.. certainly one to watch closely.

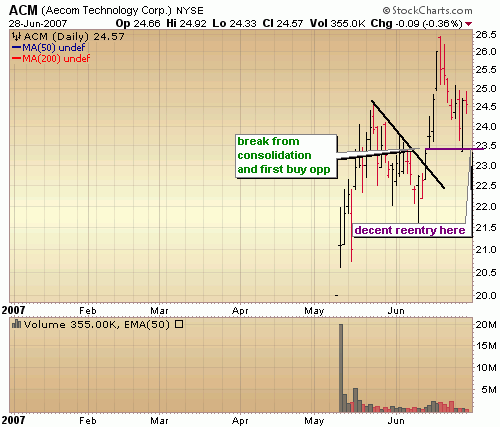
Aecom Technology ACM ipo chart

AECOM Technology Corporation (AECOM) is a global provider of professional technical and management support services to government and commercial clients on all seven continents. AECOM provides planning, consulting, architectural and engineering design, and program and construction management services for a range of projects, including highways, airports, bridges, mass transit systems, government and commercial buildings and water and wastewater facilities.

The stock broke from a short consolidation in June and is retracing that move.  I’m looking for a retest of what is shaping up as short term support around 23.50 as an opportunity to initiate a small position.

______________________

Disclaimer: I currently own a position in FC Stone Group (FCSX)

Bulls Losing Grip; Hot IPO – Spreadturn Communications (SPRD)

After a week of vacation, it’s going to take me a couple of days to get my head around this market so no detailed commentary for this week.  A quick look at the charts reveals a continuation of a dead cat bounce early in the week, followed by more big distribution (Wednesday & Friday).  Clearly, the big fellas are continuing to dump positions at these levels, but the technical damage has been relatively contained up to this point.  The S&P dipped below support of the 50 day moving average, but both the Dow and Nasdaq have retained their support levels… for now.  The downside momentum on Friday was significant, indicating further weakness ahead for the market.  I still believe that the S&P and Dow will test support of their February highs at some point.

::: Model Portfolio Update :::

I wasn’t actively trading the portfolio while on vacation this week, so just one transaction was made.  I locked in a 19% profit in my Mastercard (MA) position.  I’ve been mentioning that I hadn’t been in synch with the market during the April/May run and missed out on much of the opportunity.  However, I’m getting back in synch in the past couple weeks and the portfolio is getting in line with the performance of the overall market with a 5.2% YTD gain.  I remain confident that I can significantly outperform the S&P again this year despite the April/May set back.  Currently, the overall allocation remains a bit biased on the long side with 56% long, 24% short and 20% cash.

::: Best/Worst Performers :::

– Top 10 Performing Industries For the Week –

1. Industrial Equipment Wholesale: 5.40%
2. Internet Info Providers: 4.65%
3. Auto Dealerships: 3.25%
4. Agricultural Chemicals: 2.85%
5. Semiconductor – Memory Chips: 2.75%
6. Major Airlines: 2.35%
7. Printed Circuit Boards:  2.35%
8. Regional Airlines: 1.90%
9. Data Storage Devices: 1.75%
10. Oil & Gas Drilling & Exploration: 1.60%

– Top 10 Worst Performing Industries For the Week –

1. REIT – Retail: -5.80%
2. Drug Related Products: -5.60%
3. Investment Brokerage: -5.50%
4. Specialty Eateries: -5.30%
5. REIT – Healthcare Facilities: -5.20%
6. REIT – Diversified Industrial: -5.15%
7. Personal Service: -4.95%
8. General Contractors: -4.40%
9. REIT – Offices: -4.35%
10. Water Utilities: -4.35%

– Top 5 Best Performing ETFs For the Week –
 
1. Herzfeld Caribbean Basin (CUBA)  6.00%
2. Morgan Stanley China (CAF) 5.50%
3. Ishares China (FXI) 4.75%
4. Morgan Stanley India (IIF) 3.70%
5. Powershares China (PGJ) 3.25%

– Worst 5 Performing ETF’s –

1. Chile Fund (CH)  -7.00%
2. Ishares Realty (ICF) -4.65%
3. SPDR Utilities (XLU) -4.30%
4. Powershares Agriculture (DBA) -4.25%
5. Powershares Biotech (PBE) -4.20%

:::  IPO’s Worth Watching for This Week :::

Another hot China IPO hits the market this week – this time in wireless communications.

1. Spreadturn Communications (SPRD):  China-based fabless semiconductor company that designs baseband processor solutions for the wireless communications market. The company offers a portfolio of highly integrated baseband processor solutions that support a broad range of wireless communications standards, including GSM, GPRS and TD-SCDMA, an international 3G standard for wireless communications promoted by China.  Trading set to begin on Wednesday.

2. comScore (SCOR):  provider of digital marketing intelligence platforms. The company’s products enable its users to measure their Internet usage patterns, online and certain offline buying behavior and other activities, and it lets comScore project consumers’ online behavior.  Trading set to begin on Thursday.

3. ShoreTel (SHOR):  provider of Internet Protocol telecommunications systems. The company’s systems are based on its own distributed software architecture and switch-based hardware platform, which allows multi-site enterprises to be served by a single telecommunications system.  Trading set to begin on Thursday.

4. Data Domain (DDUP): provider of capacity-optimized storage appliances for disk-based backup and network-based disaster recovery. The company’s storage solutions address protection storage requirements with low operating costs, ease of use, high performance, reliability and compatibility with leading enterprise backup software using its Global Compression technology with industry standard components  The company is not yet profitable but growing quickly.  Trading set to begin on Wednesday.

5. PROS Holdings (PRO):  software provider of applications allowing companies to improve financial performance by enabling better pricing. PROS offers its software products to about 90 clients across five industries in 42 countries.  Trading set to begin on Thursday.

::: Upcoming Economic Reports (6/25/07 – 6/29/07) :::

Monday:        Existing Home Sales
Tuesday:       New Home Sales, Consumer Confidence
Wednesday:  Durable Orders, Crude Inventories
Thursday:      GDP (final), Initial Claims, FOMC Rate
Friday:           Personal Income, Personal Spending, Core PCE Inflation, Chicago PMI,
                      Construction Spending

::: Notable Upcoming Earnings Reports I’ll Be Watching This Week :::

Tuesday: Oracle (ORCL)
Thursday: Research in Motion (RIMM)

Forbes Pulls Guangzhou Global Telecom (GZGT) Ad, Investors Business Daily Responds

I just had to get this quick update out before I head to the airport this morning.  Davis Freeberg and I as you may know have been following this issue of major financial publications running full page ads for a penny stock – Global Telecom (GZGT).   Just the running of ads for penny stocks is bad enough, but considering the players involved in running GZGT have a bit of a shady past, it makes the running of these ads highly unethical.  Kiplinger’s originially broke  this story and I followed after seeing the ad in Investors Business Daily (note this is the online version of the ad, I first saw it in the Friday, June 1st edition of the newspaper).  This story has been getting more attention of late (hear Chuck Jaffe of MarketWatch’s Stupid Investment of the Week last week) and following an inquiry from Davis Freeberg, Forbes mentioned that the ads are being discontinued.  They stated:

“Thanks for your note- we obviously take this very seriously given our
reputation in the industry. Just so you know Forbes.com and Forbes
magazine are separate organizations with separate sales teams. I had
some people here at Forbes.com run a check and it appears that we’ve
never shown those ads online. I can confirm that there had been ads run
in the print mag in the past but from what I’m told those are going to
be discontinued.”

Thank you Forbes for doing the right thing!  How about you Investors Business Daily?  Here is  their response:

“Thank you for your email regarding the advertising from GrowthStockGuru. Investor’s Business Daily does have a policy in of rejecting display advertising that promotes penny stocks. Display advertising refers to the ads that are placed throughout the newspaper.

The ad you referred to ran in our Corporate News section. This is classified advertising section designed as a forum for public companies to increase awareness of their stock. Most of the ads that run in Corporate News are penny stocks. Many of our readers regularly read this advertising feature searching for new and interesting investment opportunities. The section is labeled as advertising and in no way is an endorsement by Investor’s Business Daily. We also run a small disclaimer in the section stating that we can not guarantee the accuracy of the information in the ads.

Thank you for taking the time to share your concerns with us. We value your input and take all suggestions and comments very seriously.”

It appears IBD doesn’t want to let go so easily of those penny stock promotion profits.. hmm.  They get around the issue by distinguishing between display ads and their Corporate News (er advertising), which is different.  Whether you call it Corporate News or whether it appears on one page or several pages, does it really matter?  An ad is and is an ad and it may hurt your readers financially not to mention your reputation and credibility.  Do the right thing IBD and quit providing an avenue for penny stock companies to pump and dump.  If you’re going to provide an avenue for companies to promote themselves, why not at least stick to companies listed on the major exchanges who must adhere to certain standards?

You can read the entire story about these responses to the GZGT stock scam over at Freeberg’s blog. 

What do you think?