All posts by Tate Dwinnell

Facebook IPO / Buyout Frenzy Builds

facebook ipoFirst there was the declined 1 billion dollar buyout offer from Yahoo and rumored 2 billion offer from Google.
 
Then the move to open Facebook to everyone (not just those with an .edu address),
 
According to AdRants, traffic has nearly doubled since opening it up to the masses and those over the age of 34 make up 40% of it’s user base.  
  
Most recently, a job posting on Facebook for a Stock Administration Manager:
 
Facebook is seeking an experienced Stock Administration Manager to join the Finance team. This is a full time position located in our Downtown Palo Alto office and will report to the Controller.

Responsibilities include (in part):
·        Manage the administration and compliance of all employee equity compensation programs such as Stock options, Restricted stock, RSUs, Warrants
·        Strong knowledge of SEC, FASB, and IRS rules and regulations relating to stock plans and insider trading (including SEC Section 16, SEC Rules 144, 145 and 701, FASB 123R, and IRC Sections 83, 409A, 421, 422 and 423)

Does it all add up to an  IPO filing?  The indications are there but the buyout rumors with Microsoft (who they currently have an agreement with) appear to be just as strong.  Now whether the company will IPO or agree to be bought out by Microsoft as recent rumors suggest, they will have to find a better way to generate income from its user base.   ValleyWag has been covering the ad issues with Facebook, which has struggled with low quality advertising and low click through rates.

Ashkan Karbasfrooshan outlines the current agreement with Microsoft and makes the case for a Facebook IPO in 2008 in great detail.  Great post Ashkan!

My personal feeling is that Facebook would NEVER sell out to Microsoft and risk pissing off it employees and user base but we shall see.

Market Breaks Out, S&P Clears All Time High; Hot IPO – Airvana (AIRV)

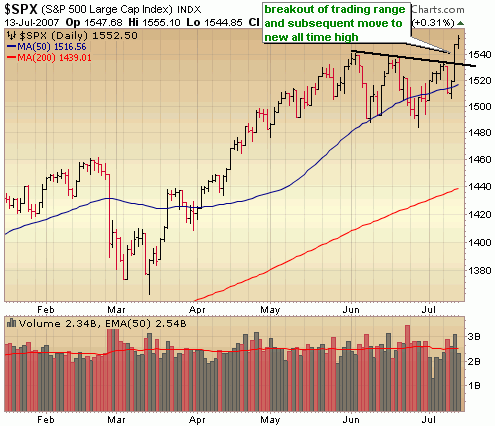
I have to admit, I didn’t see it coming.  That rally we had on Thursday.. the largest in a couple of years that led to breakouts of trading ranges in both the Dow and S&P500.  There must have been some kind of terrific news out right? A hint of a rate cut from the Fed, news that inflation doesn’t exist and never will, news that China is buying the US at a 50% premium.  No, it was just news that the typically volatile same store retail sales weren’t as bad as everyone had feared.  Walmart posted surprisingly upbeat results, which by the way, comes after struggling with same store sales for many weeks.  Was it just an aberration?  Never mind that the June same store sales growth was due in large part to grocery sales.  Grocery sales?  Oh and the daily dose of merger activity also provided a boost with news of a Rio Tinto takeover of Alcoa.  It all scared the shorts off shorts which further fueled the rally.   Hey, nobody ever said the market made any sense.  We’ve all heard the phrase "The market can stay irrational longer than you can stay solvent."  This doesn’t mean we should ignore the growing concerns in housing, food and energy inflation, etc. but until this market begins paying more attention to the negative news (ie. Friday’s poor retail results) rather than rallying on any nugget (however small) of positive news, it pays to ride the trend. 

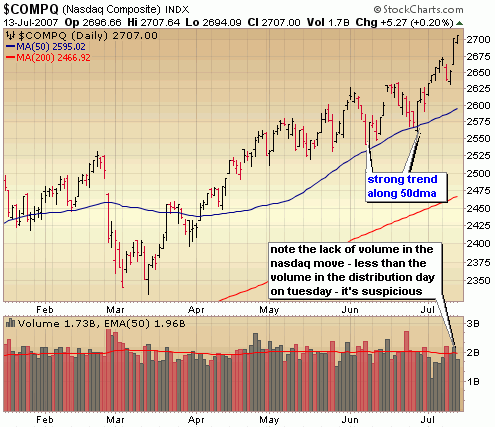
From a technical perspective, Thursday’s rally was significant.  Both the Dow and S&P broke out of trading ranges catapulting both indices to new all time highs (these former resistance levels will now act as key support).  One knock against Thursday’s rally was  the volume, which was lackluster for a move of this magnitude.  We’re certainly overbought in the near term, but any light volume pull backs from here would provide opportunities to initiate additional opportunities on the long side. 
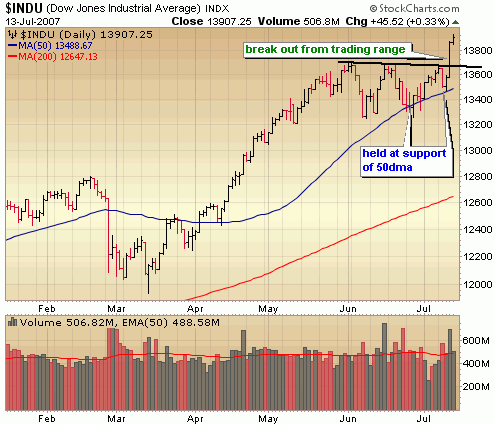
dow breakout stock chart

Looking ahead to next week, earnings (particularly in tech) kick off in full force with reports out of Intel, Yahoo, Google, Ebay which could set the stage for this market for the rest of the year.  Also on tap is inflation data and Fed minutes.  My feeling is if the market can hold its breakout on Thursday following all of the key reports, we could be in for another nice leg up. 

::: Model Portfolio Update :::

The model portfolio was positioned to take advantage of a market move either way with a bias to the long side, but with Thursday’s move that little lean to the bearish side was gone with the elimination of some hedging with DXD and QID positions which were closed for significant losses.  I still don’t regret the decision to hedge my bets with these Ultra Short ETF’s, despite te fact it hurt my performance considerably.  I have to trade what I see and what has worked well for me over the years.  From a technical perspective, my analysis was showing some trouble ahead.  It hasn’t panned out that way but I’m still in good position to beat the market by keeping pace during what has been a highly irrational (from a technical perspective) and volatile market.  During the week, despite losses in the hedge positions, the portfolio surged another 2% and closed the week with an 8.3% YTD gain.   With the market breaking out of a trading range the allocation of the portfolio has shifted more to the long side with 3 new long positions initiated.  A sizable portion remains in cash (30%) and just a small portion remains in short positions (5%).

::: Best/Worst Performers :::

– Top 10 Performing Industries For the Week –

1. Aluminum: 10.70%
2. Technical Services: 10.30%
3. Aerospace/Defense: 6.75%
4. Copper: 6.35%
5. Trucks & Other Vehicles: 5.75%
6. Diversified Investments: 5.20%
7. Semiconductor – Memory:  5.00%
8. Farm & Construction Machinery: 4.75%
9. Nonmetallic Mineral Mining: 4.50%
10. Semiconductor Specialized: 4.20%

– Top 10 Worst Performing Industries For the Week –

1. Long Distance Carriers: -4.85%
2. Auto Parts Stores: -4.40%
3. Sporting Activities: -3.30%
4. Electronic Stores: -3.15%
5. Office Supplies: -2.90%
6. Major Airlines: -2.75%
7. Publishing – Books: -2.70%
8. Surety & Title Insurance: -2.45%
9. Music & Video Stores: -2.45%
10. Auto Dealerships: -2.40%

– Top 5 Best Performing ETFs For the Week –
 
1. Morgan Stanley China (CAF)  8.15%
2. Wilshire Clean Energy (PBW) 5.80%
3. Ishares South Korea (EWY) 5.20%
4. Ishares Brazil (EWZ) 5.10%
5. Templeton Russia (TRF) 4.90%

– Worst 5 Performing ETF’s –

1. Chile Fund (CH)  -6.00%
2. Ishares Mexico (EWW) -1.05%
3. SPDR Retail (XRT) -.90%
4. HLDRS Oil Services (OIH) -.65%
5. SPDR REITs (RWR) -.55

:::  IPO’s Worth Watching for This Week :::

You won’t find Orbitz on the list this week.  You’d think this would be a hot IPO in a well recognized internet travel company growing by leaps and bounds, but this is a company that lost 146 million last year.  Giga Om calls it the worst IPO of 2007: http://gigaom.com/2007/05/11/orbitz-the-worst-ipo-of-2007/

1. Airvana (AIRV): The company makes mobile broadband infrastructure products for wireless carriers. Its products enable wireless networks to deliver broadband multimedia services — such as Internet access, e-mail, music downloads, and video streaming — to cell phones, laptops, and other mobile devices. Airvana sells its software and hardware to service providers such as Verizon Wireless in the US, TELUS in Canada, Telstra in Australia, Israel’s Pelephone, and Eurotel in the Czech Republic; however, most of its revenue (some 95% in 2006) is derived from Nortel Networks. Founded in 2000, Airvana operates offices in China, India, Japan, South Korea, the UK, and the US.  Trading set to begin on Friday.

2.  Limco-Piedmont (LIMC): wants to keep planes out of limbo while waiting for repairs. The company (formerly Limco-Airepair) performs aircraft component maintenance, repairs, and overhaul services for commercial and military planes as well as air cargo carriers. Most of its work is on heat transfer parts. Limco-Piedmont also makes heat transfer equipment used in airplanes and offers inventory management and parts procurement for airlines. Parts services account for about a quarter of the company’s business. Major customers include the US government, KLM Royal Dutch Airlines, Lufthansa, and Bell Helicopter. The company is a subsidiary of Israeli aircraft parts maker TAT Technologies (note: TAT is a growing company with a nice looking base – check it out ticker TATTF.  Trading set to begin on Friday.

3.  MF Global (MF):  MF Global isn’t just working Monday through Friday. The brokerage firm, one of the largest in the US, handles futures, options, foreign exchange products, and equity derivatives. It also acts as an intermediary in metals and energy markets. With more than $61 billion of funds under management, MF Global operates on about 15 exchanges including LIFFE and the Chicago Mercantile Exchange. About half its revenue comes from institutional investors, half from individuals. The company has a dozen offices in Asia, Africa, Europe, and North America. Hedge fund manager Man Group, which is spinning off its Man Financial as MF Global, dates to 1783 when James Man formed a sugar trading business.    Trading set to begin on Thursday.

4. Netezza (NZ): Netezza provides data warehouse appliances used to manage large databases. Targeted toward companies such as financial services companies and telecom service providers, Netezza’s appliance integrates database, server, and storage functions, allowing customers to quickly analyze huge amounts of data. Customers include Acxiom, Amazon.com, CNET Networks, ClarityBlue, Neiman Marcus, and Shoppers Drug Mart. The company established a Federal Systems division in 2005, aiming at federal government customers. "Netezza" is the Urdu word for "results." The company was founded in 2000 and filed to go public in 2007.  Trading set to begin on Thursday.

::: Upcoming Economic Reports (7/16/07 – 7/20/07) :::

Monday:        NY Empire State Index
Tuesday:       PPI, Net Foreign Purchases, Capacity Utilization, Industrial Production
Wednesday:  CPI, Housing Starts, Building Permits, Crude Inventories
Thursday:      Initial Claims, Leading Indicators, FOMC Minutes
Friday:           None

::: Notable Upcoming Earnings Reports I’ll Be Watching This Week :::

Earnings season kicks off in full force on Tuesday!

Tuesday: Intel (INTC), Yahoo (YHOO), Johnson & Johnson (JNJ), Healthcare Services (HCSG)

Wednesday: Noble Corp (NE), NVE Corp (NVEC), Acergy (ACGY), First Cash Financial (FCFS)
                      Altria Group (MO), Cavium Networks (CAVM), Ebay (EBAY)

Thursday: Google (GOOG), Sunpower (SPWR), Danaher (DHR), CyberSource (CYBS)
                  Gilead Sciences (GILD)

Friday: Caterpillar (CAT), Satyam Computer (SAY), Schlumberger (SLB), Citigroup (C)

::: In Case You Missed It – SelfInvestors Blog Entries of the Past Week :::

1. Trade of the Day – Daystar Technologies (DSTI) Attempting Breakout from Triangle
https://selfinvestors.com/tradingstocks/stock-trade-of-the-day/trade-of-the-day-daystar-technologies-dsti-attempting-breakout-from-triangle/

2. Gary Scott Highlights the Risks & Rewards of Leveraging
https://selfinvestors.com/tradingstocks/uncategorized/gary-scott-highlights-the-risks-rewards-of-leveraging/

3. Beware of Credit Card Fraud
https://selfinvestors.com/tradingstocks/credit-cards/beware-of-credit-card-fraud/

4. Trade of the Day – Banco Itau (ITU), Flat Base Break Out
https://selfinvestors.com/tradingstocks/stock-trade-of-the-day/trade-of-the-day-banco-itau-itu-flat-base-break-out/

5. Trade of the Day – Energizer Holdings (ENR) Flat Base Breakout
https://selfinvestors.com/tradingstocks/stock-trade-of-the-day/trade-of-the-day-energizer-holdings-enr-flat-base-breakout/

6. Market Distribution After Profit Warnings in Housing, Retail
https://selfinvestors.com/tradingstocks/weeklyafter-stock-market-review-archives/market-distribution-after-profit-warnings-in-housing-retail/

7. Trade of Day – Monolithic Power Systems (MPWR) – Flat Base Breakout
https://selfinvestors.com/tradingstocks/stock-trade-of-the-day/trade-of-the-day-monolithic-power-systems-mpwr-flat-base-breakout/

Trade of the Day – Daystar Technologies (DSTI) Attempting Breakout from Triangle

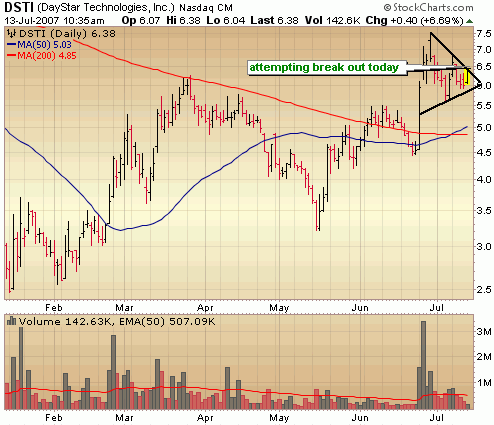
Unless you’ve been living where the sun don’t shine you’ve probably been aware of the surge in solar over the past year, particularly in the last few weeks.  Many have run up way past a buyable range but there are still trading opportunities out there in this space – one is in Daystar Technologies (DSTI).  No, this company is not a leader in the solar space and not meant for a longer term hold.  I’m just highlighting a trading opportunity which could potentially offer explosive profits over the next few weeks.  Let’s have a look at the chart:

daystar technologies dsti solar stock chart

I’ve been highlighting flat bases in past Trade of the Day posts but these bullish triangle formations probably come in at a close second on the favorite chart setups list.  As I write this DSTI is in the process of busting out of this formation with heavy volume.  It should be noted there is significant short term resistance around 7.50 so it may have trouble in this area.  If it can break through this level as well it could run awhile.

Gary Scott Highlights the Risks & Rewards of Leveraging

A recent article posted by Gary Scott about the Real Laws of Investing outlined that investing in environmental issues is a huge and long lasting trend. Gary has been proving this fact.  He developed with the Danish Jyske Bank a Green Portfolio last November 20076 and it has been rising steadily since.  By mid July 2007, eight months and ten days after this portfolio was created it had risen 201.14%.  $100,000 invested Nov. 1, 2006 was worth $301,148. 
 
To make matters better the worst performing of the five portfolios that Scott created with Jyske is up 38% in this same period.  The other three portfolios are up 38%, 45% and 62% in this time period.   Such high returns are possible when one uses intelligent leverage.
 
This makes a compelling investment story considering that an investor can create a portfolio like this at one of the world’s safest banks.
 
Yet Gary recently shared a really important point about the loss potential of leverage as well. He wrote:
 
“Last year our portfolios had great success also.  Our top portfolio (Asian Emerging Markets) rose 114.16% from November 2005 to November 2006.
 
“Yet when we started our five portfolios in November, 2006, we reduced, rather than increased the leverage we used.   This is because the 2006 emerging portfolios gave us great performance for the whole of the year, but they also had a severe dip in between
 
“Look at what this means so you can see both sides (the ups and downs) of leverage.
 
“The 2006 Asian Emerging Portfolio began October 21, 2005 and shot off like race horses bolting from the gate.
 
“Four months after it began, I wrote:
 
“After 20 weeks on March 5, 2006 the Asian Emerging Portfolio has risen +75.19%  
“I also added: “These results are especially pleasing since there have been several articles in newspapers that warn that Borrow Low systems of enhancing profits through leverage may be at an end due to sharp shifts in several currency parities”.
“The warnings were true.  Beginning in March 2006 the second worst emerging market plunge of the decade began.
 
“In July 2006, a portfolio update said: “The last month has seen a blood bath in emerging markets and currencies”. 
 
“The Emerging Asian Portfolio had dropped from being up 75.19% to being up +30.28%, a loss of nearly 44.91% in four months.
 
“If an investor, attracted by high returns, had jumped into that portfolio in March 2006, they were down …badly.  From March to July the portfolio was down 44.91%, but leverage made the los much worse!
 
“If $100,000 were invested in March 2006 and an additional $200,000 borrowed, the two times leverage meant that the investor lost $134,710. Those who jumped in at the early March top could have lost their entire investment, plus 34.71% more.  This it is why it is important to know not to invest more than one can afford to lose.
 
“If investors believed in the idea and could afford to hang on, or had a money management system in place to cut losses and then reinvest when the idea turned around, they were well rewarded. The Emerging Asian Portfolio rose 83.88% from July through October, 2006.  In three months, the $300,000 ($100,000 invested and $200,000 borrowed) portfolio gained $251,640, a 151.64% profit on the $100,000 base investment…in just three months! 
 
“Review what could have happened with the Emerging Asian Portfolio in just one year. 
 
“Investors who invested $100,000, borrowed $200,000 and held on through thick and thin for a year made 114.16%
On the $100,000 actually invested, they earned $114,160 in one year aand ended up with $214,160.   Not bad!
 
“Investors, caught in greed, who jumped in March 2006 and exited in fear in July of that year lost their entire $100,000 invested and could have lost $34,710 more!  That’s bad.
 
“These losses took place quickly, in just five months. Had the investor held their sandwich at Jyske Bank, the bank would have closed their position before it reached a negative position so their loss would have not been more than their original $100,000…probably even less.  That’s still bad.
 
“Had a really wise investor timed their investment right and invested $100,000 in July 2006 they would have earned
$151,640 on the $100,000 invested) in just three months.  That’s really good!
 
“Here are three important lessons:
 
“#1: Belief in the idea is vital.  Investors who believed in the idea and held on were well rewarded.
 
“#2:  Keep a good money management system.  Investors who had a money management system, set stops and exited before the March collapse and reentered in July made a huge annual return did the best of all (up to over 400% annual profit in a year).
 
“#3: Do not invest more than you can afford to lose!  In an utterly brilliant year (when viewed from the annual perspective), the seeds for incredible performance and total loss were in blossom.  
 
“Multicurrency investing is vital in this day and age.  There is no one currency that is totally trustworthy.  Multicurrency investing enhances safety. Leverage can make multicurrency investing even more profitable…yet every investor needs to question whether to use leverage or not. If they do, they must make sure the amount borrowed it is in tune with their goals and circumstances.   If they do the borrow low deposit high strategy to leverage multi currency investing can strengthens one’s financial security and profit potential as well.”
Gary Scott is an internationally recognized entrepreneur, author and investment advisor who offers seminars on investing with multi currencies. 

Beware of Credit Card Fraud

After 6 years and thousands of dollars of products purchased online on several dozen different websites, I now can join the ranks of credit card fraud victim.  Of course I never thought it would happen to me.  I’m careful with firewalls, anti keystroking software, virus protection …. I don’t have any idea how my credit card info was compromised and I may never know. Eleven charges on my credit card appeared from World Of Warcraft Cdke Velizy Fr, NC Soft and Blizzard-ent*elecupgrd for 27.82, 39.99 or 19.99.  It should be noted that since I have never done business with these companies, they aren’t the crooks. ..but why someone whould steal my CC info and use it to buy online gaming accounts is beyond me!  I just found these charges today so haven’t had time to look into it but do know there are many others out there that have seen the same charges appear on their credit cards in the past couple weeks.  Having to close my account is a headache but I suppose it could have been worse.  Just a heads up!  Always look at your credit card statement, only use one card for internet purchases and NEVER use your debit card.

I’m short on time tonight but will research this a bit more over the weekend and possibly post an update on the situation. 

::::::::::::: Billboard ::::::::::::::::::

Use credit repair companies to better your financial future and increase your credit score.

Trade of the Day – Banco Itau (ITU), Flat Base Break Out

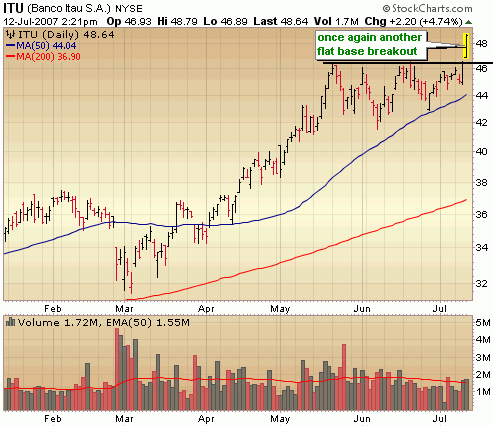
Another day, another flat base breakout!  You’ll see me feature these kinds of breakouts here quite a bit because in my opinion they are one of the best formations around – clearly defined support and resistance levels with a high success rate.  I featured flat base breakouts in MPWR and ENR in the past 2 days and today I highlight a breakout in Banco Itau (ITU).  Foreign banks have been moving of late and ITU is no exception.  Today, it breaks of a well formed flat base to a new all time high.  I do no own this stock currently but may consider a position on a bit of a pull back.  While at the top of a buyable range, I prefer to get into position very close to the breakout point.  Why not wait for perfect entries when there are so many great trade candidates?

Banco Itau ITU flat base break out


Trade of the Day – Energizer Holdings (ENR) Flat Base Breakout

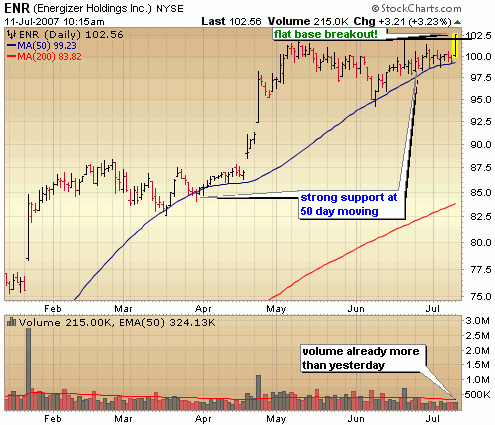
Today I highlight another flat base breakout to go along with yesterday’s Monolithic Power (MPWR) which continues to break out nicely.  The stock is Energizer Holdings (ENR) and it’s staging a big breakout off support of the 50 day moving average and above a well constructed flat base at 102.10 with a buyable range of 102.10 to 107.20.  I would look to get in at 104 or lower.  The stock has run up big as I write this and is due for some kind of pull back intraday.

energizer holdings enr flat base breakout stock chart

Market Distribution After Profit Warnings in Housing, Retail

In the first significant day of trading in over a week, bears came out of hiding after profit warnings left traders wondering just how upbeat earnings will be this quarter and provided an excuse to take some profits.  Warnings out of Home Depot (HD) and DR Horton (DHI) along with Standard & Poors cutting ratings on 12 billion of subprime mortgage bonds got the market off on the wrong foot, but it wasn’t until the end of Bernanke’s speech that the selling really accelerated.  Bernanke usuallly has a way of providing some pop to the market, but this time around didn’t say much of anything to alleviate concerns.  The robust consumer is showing signs of wavering recently with Walmart’s recent poor results and the warning out of Sears today.  As I’ve said before this will be a critical area to watch so keep an eye on the retail numbers due out this Friday. 

Technically, today’s action was obviously bearish but not disastrous.  Volume levels indicated distribution, but considering the market was pushing higher with diminishing volume, some significant selling shouldn’t be too much of a surprise.  While the S&P just barely took out support of the 50 day moving average it remains firmly in a supportive channel.  Both the Nasdaq and Dow still have support of their 50 day moving averages.  The selling today sets up further deterioration but it would take another few days of intense selling to cause significant technical damage to the indices.  It still pays to be quite cautious up here until we begin to get into the bulk of earnings season which kicks off next week.  Stay tuned, it should be a wild ride over the next few weeks!

::: Major Indices Performance – The Numbers :::

(Note: volume averages are based on the average over the past 50 days)
Data as of 4:00EST – End of Day July 10th 2007

Distribution across all indices.

Nasdaq: DOWN 1.16% today with volume 11% ABOVE average
Nasdaq ETF (QQQQ) DOWN .84%, volume 12% BELOW average
Dow: DOWN 1.09%, with volume 20% ABOVE the average
Dow ETF (DIA): DOWN 1.07%, volume 9% BELOW the average
S&P ETF (SPY): DOWN 1.36%, volume 36% ABOVe the average
Russell Small Cap ETF (IWM): DOWN 2.95%, volume 30% ABOVE the average

::: SelflInvestors Leading Stocks :::

The Self Investors Leading Stocks Index is comprised of stocks in the Breakout Tracker, which is a database of the fastest growing companies near a breakout or having already broken out of a base.  Leading stocks performed about in line with the rest of the market today.

Summary:

* Decliners led Advancers 324 to 61
* Advancers were up an average of 1.67% today, with volume 37% ABOVE average
* Decliners were down an average of 1.86% with volume 4% BELOW average
* The total SI Leading Stocks Index was DOWN 1.3% today with volume 2% ABOVE average

::: Where’s the Money Flowing :::

Many investing websites provide leading industries based on price performance alone. However, without accompanying volume levels, this can sometimes be misleading.  The only way that I know of to gauge industry/sector strength WITH volume levels is through the analysis of ETF’s.  A couple years ago this was not possible, but as more traders/investors use ETF’s they become a much better tool for gauging the health of the market and seeing where the money is flowing (or not flowing).  Using the proprietary SelfInvestors Demand Indicator score which measures price and volume movements, I’m able to quickly see which sectors/industries are seeing the greatest inflows of cash.  For a detailed look at how I go about gauging sector/industry strength please see the following post: http://selfinvestors.com/si/industry_tracking/

* Current Leading Sectors/Industries (over last 30 trading days): 
Clean Energy, Technology, Semis, Aerospace/Defense
                                          
* Current Lagging Sectors/Industries (over last 30 trading days): 
Bonds, Biotech, Home Construction, Banks, Financial

* Today’s Market Moving Industries/Sectors (UP with volume):
Agriculture

* Today’s Market Moving Industries/Sectors (DOWN with volume):
Home Construction, Broker Dealers, Retail, Telecom, Financial

::: Stocks :::

The stocks section will be an area where I highlight one stock selected from a group of stocks moving up with volume well above average and most likely breaking out of a base or consolidation. 

It’s been a long day and I’m short on time tonight so no Stock of the Day for today but you might like to have a look at these high quality companies moving with volume today – Perficient (PRFT), Allis Chalmers (ALY) and Visual Sciences (VSCN).

Disclaimer: I own a small position in Visual Sciences (VSCN)

Trade of the Day – Monolithic Power Systems (MPWR) Flat Base Breakout

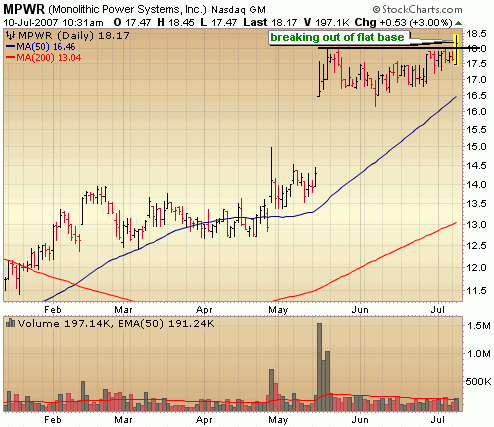
I’m adding a new feature here at the blog called Trade of the Day.  Every day I’ll try and post a trade of the day which will highlight a technical  trade (not necessarily a company with great fundamentals) which has the potential for an explosive move over a short time period.  Today’s stocks is Monolithic Power Systems (MPWR) which is breaking out from a flat base this morning.

monolithic power mpwr trade flat base breakout stock chart

Full Disclosure: I have purchased shares in this stock this morning.