All posts by Tate Dwinnell

Case Study: Trading Cardica (CRDC) For a 45% Profit

Extraordinary profits can be had in low priced momentum stocks and they aren’t too much riskier than any other stock if you’re sure to keep your losses small by dumping the position on any sign of weakness. Any increase in risk is certainly more than made up by the increase in profit potential.

I call these kinds of trades Quick Strike Profit (QSP) plays here at SelfInvestors.com but in general they are shorter term swing trades in high momentum, lower priced stocks. I use them when the time is right (in a strong market) to accelerate the returns of my portfolio. Gold and Platinum members are alerted to several of these every month when I initiate a trade in the Model Portfolio. One such trade in Cardica (CRDC), yielded a quick 45% profit in just a few hours of trading.

Before I go into the details of how I traded CRDC, I wanted to illustrate an example of how I minimize my losses in these kinds of trades by dumping the position quickly at the first sign of weakness. This was illustrated perfectly today in a QSP trade in Silverstar Holdings (SSTR), which I closed for a small loss.  This morning I issued the following alert on SSTR:

I’m initiating another QSP trade this morning, this time in SSTR.  The stock gapped up to a record high with record volume on Sept. 28th after posting an outstanding earnings report.  The stock has been digesting that gain and now looks poised to begin running again.  I’m in here with a very small $7500 position at 4.07. and am just looking for a quick 20 – 30% over the next several days.

Here’s a look at the chart which shows that the stock surged out of a bullish triangle formation with decent volume.  However, the stock kept pushing lower throughout the day and the selling picked up by the end of the day, sending the stock below $4/share.  When a stock closes in the lower half of the intraday range with above average volume, that is an indication of weakness.  This kind of action almost always results in me closing a QSP trade because it often results in further deterioration.  As I’ve said, I cut my losses quickly in these trades at the first sign of weakness.  When in doubt, get out.  I issued the following sell alert to members before the close today:

SSTR flashed all the signals of another run, but it’s proving to be a false alarm at least at this point. The stock is staging a significant reversal today indicating the stock isn’t quite yet ready to resume the run.  I’m going to go ahead and take the small loss and will look to try again if it flashes a buy signal in the coming days.  The key in playing these is to keep your losses very small and close the trade at the first sign of weakness to avoid large losses.  I’m out at 3.94.
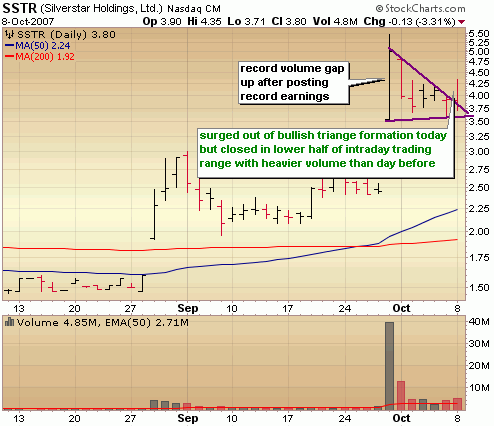
The SSTR trade today shows that sometimes the trade doesn’t work out as you expect.  Take the small loss and move on knowing that another trade will prove to be highly profitable just as CRDC was (which I highlight below).

I began featuring CRDC in my #1 Longs List (a new feature of the Gold and Premium membership package) on September 14th as it began to carve out a picture perfect bullish triangle.  CRDC would appear on my #1 Longs List for the next couple weeks when it finally began to move on September 26th.  I issued the following alert:

I’m going to go ahead and play my hand in CRDC, a highly speculative company with a very bullish looking stock chart.  The stock has carved out a picture perfect bullish triangle formation and looks poised for a big move out of this pattern.  The stock has just begun moving with some good volume.  I’m in at 9.34 with a very small position of $7500.  The only reservations I have about this pattern is that it’s too perfect so may be watched by too many making it more prone to failure.  I definitely feel it’s worth the gamble and will have a tight stop in place.

Here’s the chart below.  Looking back on the trade I honestly don’t remember why I initiated the trade for the first time on the 26th because it hadn’t yet cleared the triangle formation yet 🙁 .  Call it over eager, call it lack of sleep but it was too soon to initiate.  As it turned out, I got in at a better price, but you really should wait for a breakout of the pattern.  Two days later, it did just that and looked as if it was ready for the big run, but on Oct 1st stalled out and closed at the low of the day.  Remember that I closed the SSTR trade following a high volume reversal.  CRDC reversed on Oct 1 and closed in the lower half of its intraday range, but it didn’t do so with big volume so I held on for a couple more days.  On Oct 3rd I decided to go ahead and dump the stock for a 1% loss.  I have seen too many trades like this stall out and just drift lower and lower with no real conviction.  I could always get back in if CRDC began to show some life again, so I dumped it and issued the following sell alert to members:

I’m closing my last QSP trade in the portfolio.. in CRDC.  It looked like a couple days ago it was going to bust out for good from its  very bullish looking triangle formation as the stock gapped up in the morning.  It proved to be a false alarm at least for now.  Since then, the stock has stalled and continues to meander lower.  As with all QSP trades, I’m quick to pull the sell trigger if the stock shows any kind of weakness.  No exception here.  I may get in again down the road, but for now it’s best for me to exit with a very small loss and look for stronger positions.  I’m out at 9.27
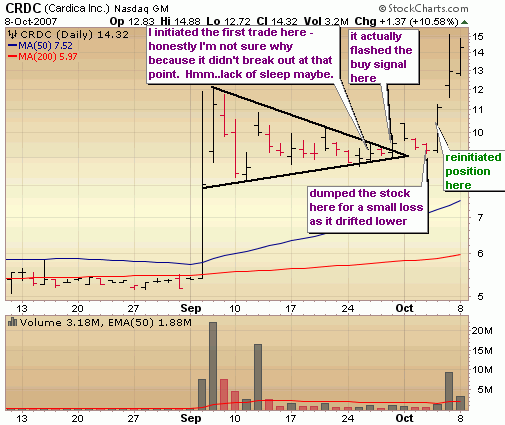
… and show some life it did!  At the end of the day the very next day, CRDC got a surge of buying and I issued another alert to members:

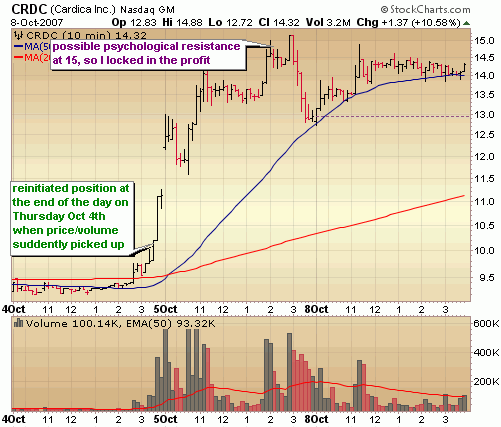
Cardica (CRDC), a QSP trade I exited just yesterday is finding some life here, so I’m going to try again and see if it can break out for good this time.. It looks good and is getting a ton of buying here at the end of the day and is on the verge of breaking big.  I’m in at 10.17 with a small $7500 position.

The chart below shows my entry and exit on the intraday chart.  Notice the big surge in buying at the end of the day on Oct 4th where I re-initiated the position.  Once the stock cleared resistance at 12 the following day, there was no overhead resistance in its path but I thought that a new source of resistance could be at the psychological level around 15 so I was looking to take profits up there.  I wasn’t about to get greedy.. a 45% profit in literally just a few hours of trading is an exceptional move that doesn’t come around everyday.  I issued the following sell alert to members:

It’s time to take the profit in CRDC.. what a 2 day run!  Up 45%.  These kinds of home runs don’t happen very often but the reason I play the QSP trades is because just one of these can really accelerate your returns.  By keeping losses small in these and hitting a home run every now and then you will do extremely well.  I’m out of CRDC at 14.77 and looking for another QSP trade
As the trades in SSTR and CRDC illustrate, trading isn’t always textbook, certainly isn’t always pretty and mistakes do occur.  Hopefully you’ve learned a bit from this case study just as I have.  It’s always a good idea to review all your trades (even your winners) to discover ways you can continue to improve.  Just remember, you can enjoy big gains in the market year after year if you exercise discipline and keep those losses small.

Also keep in mind that the run in CRDC could certainly continue up from there.  Look for some kind of bullish basing action (perhaps a flat base or another triangle formation) and a breakout from that base as an opportunity for another trade.
S&P Joins Breakout Party, Volume Recedes; Hot IPO: Compellent Technologies (CML)

At the top of the page in IBD it says "Friday’s stronger than expected jobs report show a recession is likely off the table, propelling stocks to record highs."  Maybe it’s just me but how can any assumptions be made about a jobs report?  Wasn’t it just one month ago after a horrible jobs report that recession talk was swirling in the air?  Oh, right, that was a mistake.  Actually, there was significant job growth in August.  A revision upward and all is good… and that September report just confirms that the August jobs report was inaccurate.  Rigghhhhtt.  Don’t even get me started on inflation.  Can’t we all just finally admit that the economic numbers released by the government are a bit of a joke at this point?  To me there are really only two things that matter – company sales growth (not as easily manipulated as earnings) and supply and demand in the stock market.  Since company sales growth is a LAGGING indicator (hey, sales growth is typically best at the TOP of the market and worst at the bottom), I’ll base my trading decisions on simple supply and demand of the stock market.  For that I turn to the charts.

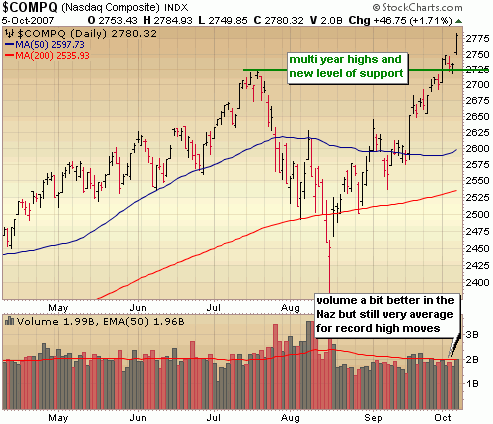
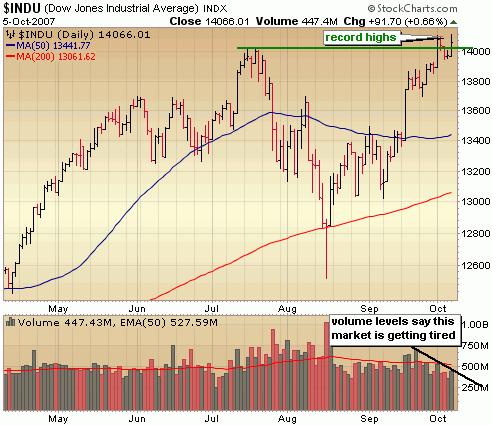
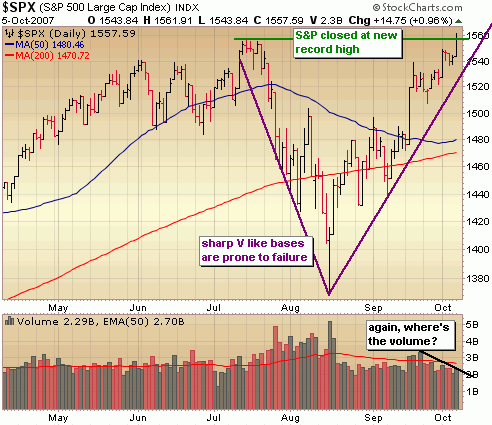
On Friday the S&P joined the Dow up in record high territory while the Nasdaq continues to push higher without pause.   That big August capitulation day has proved to be a much stronger springboard than I ever imagined.  If you told me a month ago that the market would shoot nearly straight up to record highs with little pause I wouldn’t have believed it.  The fact that the market has busted through to new highs is in and of itself very bullish action and makes for headlines.  This can bring in more retail money off the sidelines and push us higher.  However, until the institutional money starts pouring in, this market rise remains a house of cards. 

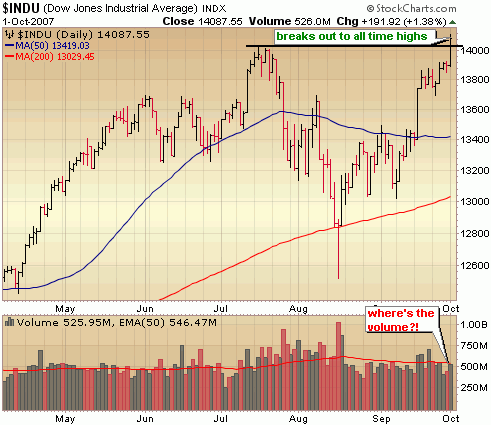
Notice how as the Dow pushes to record highs, but volume behind the move recedes.  The market looks tired up here and at the very least needs to take a breather and spend some time sideways.  At worst, this is the end of the road and marks a double top.  I don’t think that will happen, but it’s something to keep in mind.

The S&P  closed at a record high on Friday with volume higher than the day before.  Yes, technically it was a day of accumulation.  But again, look at the lack of institutional buying up here.  Volume levels were well below average and have been for a few weeks.  Throw in the steep rise over the past several weeks and I think you have a recipe for a significant pull back from here.  This market needs a rest so that it can coil the spring for another leg up.

The volume levels in the Nasdaq are a bit better and the move on Friday was impressive but expect the Nasdaq to come back and test the new level of support at those July highs at some point before heading higher.

The bottom line right now is that this market has risen fast and furious off that capitulation day, but is looking increasingly tired up here.  The market needs to rest and recoil the spring so that it can sustain another leg up.  Until then, I’ll continue to sit on a sizable cash position and look to trade shorter time frames. 

::: Model Portfolio Update :::

For a few months I hadn’t been playing too many of what I call QSP (quick strike profit) trades which are basically swing trades where I’m looking for big profits in momentum stocks in a very short time frame.  However, while the market has gained strength over the past several weeks I’ve begun to play these quite a bit more and this week the strategy paid off in a big way.  My strategy with them is to cut them loose at the first sign of stalling and/or weakness even if I have a gain in the stock.  Case in point – my trades in SCON and KONG.  Both stalled out after a breakout attempt so I dumped them for small gains of 3%.  Another great example is a trade in Cardica (CRDC) which I’ll highlight in a case study in another post soon.  CRDC is a stock I initiated a position in last Friday when it looked as if it was going to emerge from a very bullish looking triangle formation.  When it stalled on Monday and Tuesday, I dumped it for a small 1% loss.  If at first it doesn’t succeed.. TRY, TRY again.  I tried again on Thursday when the stock began to show new signs of life late in the trading day.  I initiated an entry at 10.17 and rode it up for much of the day on Friday and locked in a very quick 45% gain.  My only regret is initiating such a small position 🙁 The KEY: cut your losses quickly in these volatile plays and eventually that one big run will wipe out a few small losses and really accelerate your returns.  In addition to some nice gains in QSP trades recently, the portfolio continues to be led by Google (GOOG) a long term holding as well as IPO plays LULU and WX.  For the week, the portfolio surged to a 4.3% gain bringing the YTD gain to 15.6%.  Now that certainly isn’t world beating performance, but as I’ve said before, the market has been unusually difficult to read this year and I missed much of the move in the first half of the year.  I feel like now I’m catching up and in great position to at least double the return of the S&P by the end of the year just as I did last year.  I’m still carrying a decent cash position at 32% and probably won’t move too much more to the long side until we get some kind of pullback/consolidation. 

::: Best/Worst Performers :::

– Top 10 Performing Industries For the Week –

1. Manufactured Housing: 12.55%
2. Residential Construction: 11.85%
3. Toy & Hobby Stores: 10.00%
4. Long Distance Carriers: 9.80%
5. REIT – Office: 9.20%
6. Recreational Vehicles: 8.90%
7. Marketing Services:  8.40%
8. Department Stores: 8.30%
9. Major Airlines: 8.15%
10. Water Utilities: 7.65%

– Top 10 Worst Performing Industries For the Week –

1. Drug Stores: -5.55%
2. Consumer Services: -5.40%
3. Information Technology: -4.70%
4. Semiconductor – Memory: -1.50%
5. Semiconductor – Broadline: -1.25%
6. Aerospace/Defense: -1.25%
7. Cigarettes: -1.15%
8. Printed Circuit Boards: -1.00%
9. Nonmetallic Mineral & Mining: -.85%
10. Paper & Paper Products: -.75%

– Top 5 Best Performing ETFs For the Week –
 
1. Ishares Home Construction (ITB)  14.65%
2. SPDR Homebuilders (XHB) 9.20%
3. Indonesia Fund (IF) 8.25%
4. Ishares South Africa (EZA) 7.60%
5. Ishares Cohen & Steers Realty (ICF) 6.75%

– Worst 5 Performing ETF’s –

1. PowerShares Agriculture  (DBA)  -3.65%
2. Thai Fund (TTF) -2.70%
3. Ishares Silver (SLV)  -2.65%
4. Ishares Commodity (KRE) -1.45%
5. PowerShares Commodity (DBC)  -1.30%

:::  IPO’s Worth Watching for This Week :::

The highest profile company to go public this week is Virgin Mobile (VM), but this company has started bleeding red.. no gushing red is more like it.   Just one compelling IPO this week.  Compellent is fast growing but not yet profitable.

1. Compellant Technologies (CML): a leading provider of enterprise-class network storage solutions that are highly scalable, feature rich and designed to be easy to use and cost effective. Compellent’s Storage Center is a Storage Area Network (SAN) that is designed to significantly lower storage and infrastructure capital expenditures, reduce the skill level and number of personnel required to manage information and enable continuous data availability and storage virtualization.  Trading set to begin on Thursday.

::: Upcoming Economic Reports (10/8/07 – 10/12/07) :::

Monday:         None
Tuesday:       FOMC Minutes
Wednesday: Wholesale Inventories, Crude Inventories
Thursday:      Export/Import Prices, Initial Claims, Trade Balance
Friday:            Retail Sales, PPI, Business Inventories

::: Upcoming Notable Earnings Reports :::

Wednesday: Lam Research (LRCX), Premier Exhibitions (PRXI)

Thursday: Fastenal (FAST)

Friday: HDFC Bank (HDB)

::: In Case You Missed It – SelfInvestors Blog Entries of the Past Week :::

1. IPO Stocks Portal and IPO Tracking Service!

2. 2 Shippers, 2 Record Breakouts: Diana Shipping (DSX), Quintana Maritime (QMAR)

3. Breakout Stocks Review: Top Pick IPO Shoretel (SHOR)

4. IDow to Record Highs, But Reasons For Skepticism; Stock of Day – First Solar (FSLR)

IPO Stocks Portal and IPO Tracking Service!

The New IPO Tracker service has just launched!  You won’t find a better tracking system for trading IPO’s anywhere.  For a limited time introductory offer as well as IPO trading tips and tricks sign up below.  Talk  to you soon!

First Name:   
Email:         
                  

::::::::::::::::::::::::::::::::::::::::::::::::::::::::::::::::::::::::::::::::::::::::::

If you’ve been reading this blog for some time you know I’m a big fan of IPO’s and am actively looking to trade the best IPO’s everyday.  Recent IPO’s I’ve been trading include 3SBio (SSRX), Simcere Pharma (SCR), WuXi Pharma  (WX), Lululemon (LULU) and VMWare (VMW).  All are highly rated and all have produced outstanding returns over the past few weeks. 

In the past I had trouble keeping tabs on the best IPO’s coming to market.  I found that I wasn’t keeping up with them and it wasn’t until several weeks down the road after they had already run up big that I was discovering them.  I looked high and low for a  good tracking service.  A sortable, dynamic database that I could look at a couple times a day and discover the highest rated IPO’s that were moving and moving with volume.  There wasn’t anything available, so I did something about it!

I introduce to you the all the new IPO Stocks Portal page, which features my top ranked IPO’s (IPO’s rated a 27/30 or higher), IPO’s moving with volume during the trading day, news, the latest blog entries, recommended reading and a list of resources. 

In conjunction with the new portal page, I’m also releasing a new product – the IPO Tracker.  This was previously only available as part of the Gold and Platinum member packages, but due to significant interest I’ve decided to offer it as a stand alone service.

Breakout Stocks Review: Top Pick IPO Shoretel (SHOR)

The Breakout Tracker has been the cornerstone of the premium service since day 1 and is a database comprised of the best companies in the world that are near a breakout or have broken out of a base (ie. cup with handle, flat, base on base, ascending, etc).  All stocks are analyzed and ranked by me before they ever make it to the database, guaranteeing only a database of the best.   The Breakout Tracker combines the power of the human element of stock research with the updating, sorting and filtering capabilities of a dynamic database, alerting members to buying opportunities in the highest quality stocks with very little research.

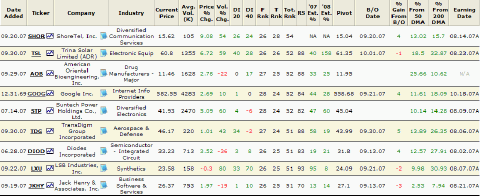
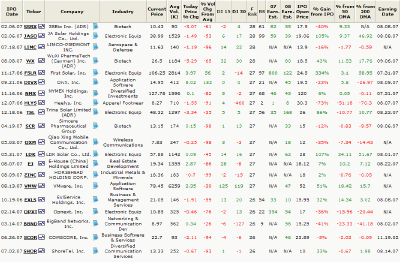
The following list is a screenshot of the Breakout Watch filter which spits out a list of the highest ranked stocks that are near a breakout or within 5% of the pivot (or breakout) point. Only the top 9 are shown in the image below.  Note: Fundamental Rank (F Rank) and Technical Rank (T Rank) are ranked from 0 – 30, 30 being the best. 

Click on the image below for a larger image.

One other important thing to point out are the DI Scores, which are proprietary indicators of SelfInvestors that basically measure the demand in a stock using price and volume data over 20 and 40 days.  The higher the score, the greater the demand.  Here’s a detailed look at all the Breakout Tracker data.

At the top of the list this time around is ShoreTel (SHOR) a highly rated VOIP provider that recently IPO’d.  The stock just broke out of its first base since going public and based on my analysis of past highly rated IPO’s that break out, the odds are definitely in favor of more upside from here.  Note in the chart of SHOR below that the stock did take out support of the pivot point with heavy volume on Friday.  It was able to recoup all of those gains yesterday, but not with good volume.  I’d give this one a few days to sort itself out and see if the high volume drop on Friday was just an aberration.

Next on the top breakouts list is Trina Solar (TSL).  Keep in mind that while the stock triggered a breakout in my system yesterday, it could still continue forming a handle considering this consolidation has just been a few days.  If it can’t clear yesterday’s highs and hold there, I will probably reset the pivot point on this one.

Not surprising, Google (GOOG) is right up there as well after having busted out of a cup with NO handle base.  I really thought it would digest gains a bit more and retest the area around 550 before moving higher, but based on yesterday’s move, it may not do any "resting" for some time!  I continue to hold my long term position in Google and looking to add shares on a decent pullback.

Stocks that have yet to breakout on the list include two highly rated Chinese companies – American Oriental Bioeng (AOB), the Chinese provider of plant based pharmaceuticals and Suntech Power Holdings (STP).  Considering the overall momentum in Chinese stocks, it may be just a matter of time before these highly rated companies bust out of their bases.

:::::::::::::::::::::::::::::::::::::::::::::::::::::::::::::::::::::::::::::::::::::::::::::::::::::::::


Keep tabs on all of the highest rated breakout stocks with the Breakout Tracker by signing up for SelfInvestors Gold Membership today!  You’ll also receive the IPO Tracker, the ETF Tracker and Model Portfolio buy/sell alerts.

Dow to Record Highs, But Reasons For Skepticism; Stock of Day – First Solar (FSLR)

In my weekly report yesterday I mentioned I was waiting for a low volume move down to key support levels OR a big breakout to new highs to get more aggressive on the long side.   I was not expecting a breakout move to happen so soon especially with the news out of Citigroup in the morning but today we got the big breakout.. or did we?  Apparently traders feel the credit crunch will be a fairly isolated event (even Citigroup said earnings would be back to normal in the 4th quarter after a 3rd quarter hit) and with the Fed there to brace the fall every step of the way.. why not bid up up the market!  The price was there and the Dow and Nasdaq broke out from key resistance levels to new record highs.  BUT WHERE WAS THE VOLUME??  Since volume levels were higher than Friday, today’s move was technically a day of accumulation.  However, considering volume levels were below average across the board it’s clear that institutions didn’t do a whole of participating in today’s rally.  It seemed to be more of a case of the retail side fearing missing the next move up and some short covering.  Considering that the market is being led by commodities (no, Gold shouldn’t lead the way in a bull market) along with overbought conditions quite frankly I’m becoming skeptical of this rally.  I’m continuing to play it with small long positions and added a couple more today but I’ll be vigilant about looking for more warning signs and even more vigilant about protecting my profits.

 
::: Major Indices Performance – The Numbers :::

(Note: volume averages are based on the average over the past 50 days)
Data as of 4:00EST – End of Day October 1st 2007

Nasdaq: UP 1.46% today with volume 5% BELOW  average
Nasdaq ETF (QQQQ) UP 1.15%, volume 32% BELOW average
Dow: UP 1.38%, with volume 4% BELOW the average
Dow ETF (DIA): UP 1.22%, volume 47% BELOW the average
S&P ETF (SPY): UP 1.13%, volume 36% BELOW the average
Russell Small Cap ETF (IWM): UP 2.49%, volume 20% BELOW the average

::: SelflInvestors Leading Stocks :::

The Self Investors Leading Stocks Index is comprised of stocks in the Breakout Tracker, which is a database of the fastest growing companies near a breakout or having already broken out of a base.  Small to mid cap leading stocks led the way today as the Russell 2000 and the Self Investors Leading Stocks index greatly outperformed the major indices.

Summary:

* Advancers led Decliners 284 to 50
* Advancers were up an average of 2.71% today, with volume 2% ABOVE average
* Decliners were down an average of 2.05% with volume 59% ABOVE average
* The total SI Leading Stocks Index was UP 1.99% today with volume 10% ABOVE average

::: Where’s the Money Flowing :::

Many investing websites provide leading industries based on price performance alone. However, without accompanying volume levels, this can sometimes be misleading.  The only way that I know of to gauge industry/sector strength WITH volume levels is through the analysis of ETF’s.  A couple years ago this was not possible, but as more traders/investors use ETF’s they become a much better tool for gauging the health of the market and seeing where the money is flowing (or not flowing).  Using the proprietary SelfInvestors Demand Indicator score which measures price and volume movements, I’m able to quickly see which sectors/industries are seeing the greatest inflows of cash.  For a detailed look at how I go about gauging sector/industry strength please see the following post: http://selfinvestors.com/si/industry_tracking/

* Current Leading Sectors/Industries (over last 30 trading days):  
Gold, Gold Miners, Agriculture, Software, Technology
                                          
* Current Lagging Sectors/Industries (over last 30 trading days): 
Retail, Homebuilders

* Today’s Market Moving Industries/Sectors (UP):
Home Construction, Semis, REIT, Nanotech, Transports, Pharma

* Today’s Market Moving Industries/Sectors (DOWN):
Commodities

::: Stocks :::

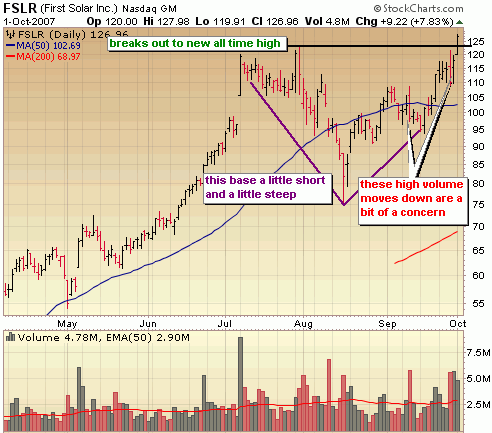
The stocks section will be an area where I highlight one stock selected from a group of stocks moving up with volume well above average and most likely breaking out of a base or consolidation.  Today’s stock is First Solar (FSLR), a top solar play which broke out of its first significant base since going public.  Yeah, it’s hard to believe a stock could run more than 500% without carving out a significant base along the way, but that’s been the case with many solar stocks.  For this reason I DO NOT adhere to the rule that says you should wait to initiate a position in an IPO until it carves out its first base.  The best IPO’s often don’t carve out a decent base until AFTER they have run up 50-100..-500%!

ABOUT: 

First Solar, Inc. (First Solar) designs and manufactures solar modules using a thin film semiconductor technology. The Company manufactures its solar modules on high-throughput production lines. Its solar modules employ a thin layer of cadmium telluride semiconductor material to convert sunlight into electricity. In August 2006, First Solar completed its Ohio expansion, adding two 25 megawatt production lines to its existing 25 megawatt base plant. The Company describes its production capacity with a nameplate rating, which means minimum expected annual production. It assigns each production line a 25 megawatt nameplate rating. With the completion of its Ohio expansion, First Solar has an annual manufacturing capacity of 75 megawatt. The Company is also building a four line 100 megawatt plant in Germany. During the fiscal year ended December 30, 2006, First Solar entered into long-term solar module supply contracts with six European project developers and system integrators.

FUNDAMENTALS: 

Like all solar companies, First Solar (FSLR) has been posting extraordinary sales and profits over the past several quarters and posted its first full year profit last year.  This year profit growth is expected to explode nearly 1000% over 2006.  No wonder the stock has soared over 500% since going public just over a year ago.  Net margins are excellent at around 26% but Return on Equity is disappointing at around 2%.  Not what you want to see in a leading company.  While First Solar (FSLR) isn’t currently the strongest solar company fundamentally, it’s often touted as the one with the greatest potential.  First Solar (FSLR) should certainly be near the top of any breakout watch list right now.

TECHNICAL:  

Following a huge run like FSLR has had I like to see a much larger, smoother base form than the one that FSLR has formed over the past few months.  However, given the industry it’s in (solar is still hot) and the growth, today’s breakout should not be ignored.  What I would do to decrease the risk of an entry is avoid initiating a position on the breakout and see how the stock performs over the next several days.  Does it continue spiking higher with heavy volume, then pull back to near the breakout point (at 123.31 with light selling volume)?  This is an indication that the breakout is strong and will undoubtedly hold up.  You can bet I’ll be initiating a position of my own in this case. 

SELFINVESTORS RATING: With a total score of 50/60 (26/30 for fundamentals, 24/30 for technical), First Solar (FSLR) is a very good SelfInvestors breakout candidate.

Full Disclosure/Disclaimer: The stock of the day is by no means a buy recommendation.  Please do your own research and make a personal decision based on your own tolerance for risk.  I currently do not own a position in FSLR.

Awaiting Earnings & Breakout Confirmation; Hot IPO: China Digital TV (STV)

 It was a fairly ho hum week with light trading volume as the market awaits the kick off of earnings season in a couple weeks but market reactions to news events suggest the bulls still remain in control as key technical resistance levels at the July highs come into play.  Retail warnings from Target and Lowe’s, weaker than expected housing numbers, a big drop in consumer confidence and record high oil was tempered by tame inflation (at least according to the government) and strong manufacturing data.  Clearly, the market focused on the good news last week and that is characteristic of any bull market.  However, I think most traders are waiting for some kind of big confirmation move after the Fed induced surge nearly two weeks ago before getting aggressive on the long side.  My own strategy hasn’t changed from last week.  I want to see a confirmation breakout move above the July highs OR some significant light volume selling to support levels before moving more cash to the long side.

 ::: Model Portfolio Update :::
While I did add a couple more small long positions and one short position I continue to remain fairly tentative as the market meanders with little volume ahead of earnings season.  As I said last week, I want to see either a few percentage points to the downside with light selling volume OR a confirmation breakout with volume before I’m willing to get more aggressive on the long side.  If we continue to push higher with light volume I may even be tempted to add another short position or two.  For the week, the Model Portfolio edged up a bit by .4% to a YTD gain of 11.3%.   I continue to hold a significant 45% cash position with 50% on the long side and 5% of the portfolio short.

::: Best/Worst Performers :::

– Top 10 Performing Industries For the Week –

1. Data Storage Devices: 5.10%
2. Industrial Metals & Minerals: 4.75%
3. Diversified Investments: 4.55%
4. Steel & Iron: 4.10%
5. Telecom Services – Foreign: 4.10%
6. Aluminum: 4.00%
7. Computer Peripherals:  3.90%
8. Life Insurance: 3.75%
9. Beverages – Soft Drinks: 3.75%
10. Farm & Construction Machinery: 3.60%

– Top 10 Worst Performing Industries For the Week –

1. Building Materials Wholesale: -9.45%
2. Residential Construction: -8.35%
3. Home Improvement Stores: -7.40%
4. Sporting Goods Stores: -5.10%
5. Banks – SE: -4.80%
6. Medical Practitioners: -4.10%
7. Water Utilities: -4.00%
8. Staffing & Outsourcing: -3.80%
9. Printed Circuit Boards: -3.55%
10. Hospitals: -3.20%

– Top 5 Best Performing ETFs For the Week –
 
1. Thai Fund (TTF)  12.30%
2. Claymore BRIC (EEB) 7.65%
3. Ishares China (FXI) 6.85%
4. India Fund (IFN) 6.75%
5. Powershares Golden Dragon (PGJ) 6.55%

– Worst 5 Performing ETF’s –

1. Herzfeld Caribbean Basin  (CUBA)  -12.50%
2. Dow Jones Home Construction (ITB) -11.30%
3. SPDR Homebuilders (XHB)  -8.05%
4. KBW Banking (KRE) -2.70%
5. PowerShares Dynamic Enegy Exploration (PXE)  -2.40%

:::  IPO’s Worth Watching for This Week :::

1. China Digital TV (STV): provides digital TV network operators with products and services that allow them control access to their content. The company’s subsidiary, Super TV, sells the set-top boxes and smart cards that allow subscribers to access channels or programs on a digital TV network. Super TV also provides the software on the network end that controls the content distribution, offers systems intergration services for network operators, and licenses it’s set top box design to manufacturers. Smart cards account for more than 85% the company’s sales.  Trading set to begin on Friday.

::: Upcoming Economic Reports (10/1/07 – 10/5/07) :::

Monday:         ISM Index, Auto/Truck Sales
Tuesday:       Pending Home Sales
Wednesday: ISM Services, Crude Inventories
Thursday:      Initial Claims, Factory Orders
Friday:            Average Workweek, Hourly Earnings, Nonfarm Payrolls, Unemployment Rate, Consumer Credit

::: Upcoming Notable Earnings Reports :::

Wednesday: Immucor (BLUD)

Thursday: Research In Motion (RIMM)

::: In Case You Missed It – SelfInvestors Blog Entries of the Past Week :::

1. Swing Trade Case Study – China Precision Steel (CPSL)

2. Halo 3 Launches Amid Rave Reviews

3. Stock Trade of Day – FalconStor Software (FALC) Cup With Handle Breakout

4. IPO Tracker ..Video Style

5. Trade of the Day – Cogent Systems (COGT) Breaks Out

Trade of the Day – Cogent Systems (COGT) Breaks Out

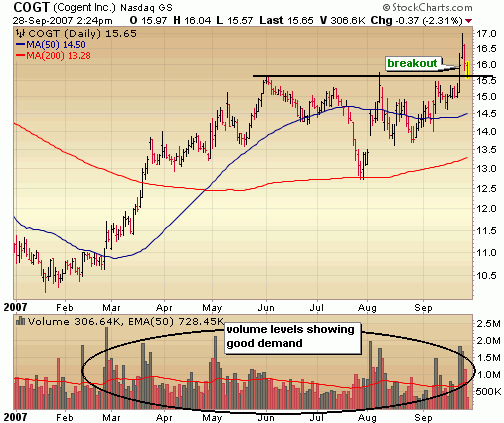
Today’s trade features a former high flying IPO that shot up out of gates over 100% after going public in 2004 but has been mired in a long downtrend over the past few years.  That downtrend is over and the automated fingerprinting company appears ready to get back on the growth track.  The stock broke out of a base a couple days ago with good volume and has pulled back to the breakout point offering another chance at an entry.  I think the stock has an excellent chance of running to the next level of resistance around 19 – 20.

IPO Tracker ..Video Style

I’ve been wanting to play around with video for a looonnnnggg time.  Well, this is my first foray into a video presentation and I gotta say.. i’ve got some work to do.  BUT, I’m excited about using video more extensively not only for highlighting my tracking systems but discussing the market and specific stocks.  One thing is for sure – they will get better as time goes on. 

Anyway, the first video presentation is of the IPO Tracker, a system I developed a few months ago to keep tabs on the best IPO’s every trading day.  After recording this I realized I forgot to demonstrate the sortable columns and the notes sections, but hey it’s late and I’m too tired to do another one. 

Note:  I did record this at full size so you will need a hi res "17 or larger monitor to view the video.  Just click on the image below and the video will load.

Interested in hearing more about IPO’s, free tips and tricks as well as a limited introductory price on the #1 IPO Tracking solution available anywhere?  Submit your name and email address below and I’ll send over the info shortly!