All posts by Tate Dwinnell

SalesForce.com (CRM) Surges, China Stocks Still Getting Hit On Earnings

Today’s SelfInvestors Leading Stocks Moving on Earnings

UP

• SalesForce.com (CRM )  Internet Software & Services, fundamental rank [22/30],  up 10%, holding up above 50 day moving average after recent breakout

DOWN

• Qiao Xing Mobile Communications (QXM) Diversified Communication Services, fundamental rank [26/30],  down 14%, testing the lows since going public in May.. I think it provides a buy opportunity soon.  Way oversold.

Breakout Stocks Review: Capital Preservation Key In Down Market

One thing I try and do here at SelfInvestors is preach risk control and capital preservation during unusual volatility or down markets like we’ve seen recently.  The reason for this is because 3 out of 4 stocks will move with the market, so a fully invested strategy in high growth stocks like the ones that I focus on can lead to disaster if you’re not careful.  How to protect yourself?  The easy answer is to move significantly to cash as I’ve been recommending now for a couple months.  However, if you are playing breakout stocks I highly recommend scaling into positions.  That is initiating a purchase with a much smaller amount and only adding more to it if market conditions improve and the breakout continues to look bullish.  Combine that with a mantra of KEEPING LOSSES SMALL and you should weather the storm just fine.

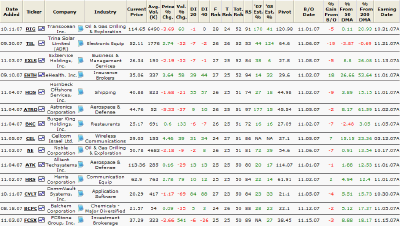
With that said I’d like to take a look at the top breakouts tracked by SelfInvestors.com over the past two weeks with a rating of 50/60 or better.  What you’ll find is a much much lower success rate than what you’d find in a strong or even flat market.  I know, no surprise there but it’s a good reminder how even the very best companies can falter in a down market.  I had a member the other day email me upset their stock took a bit of a beating.  The stock was TSL, one of the highest rated stocks.  They couldn’t understand how a stock that was supposed to be so highly rated could sell off so hard.   Well, most stocks fall in a down market with the smaller, high growth stocks often getting hit the hardest.  There are tremendous premiums built into these stocks and their runs can be further fueled by momentum players, so once things begin to unravel it’s important to protect yourself and avoid too much risk as they are much more vulnerable to large losses.

As always, please click on the image below for an enhanced "eyeball ready" version of the breakouts list.  If you’re at all curious about how the Breakout Tracker was put together and what all that data means here’s a good resource: A detailed look at all the Breakout Tracker data.

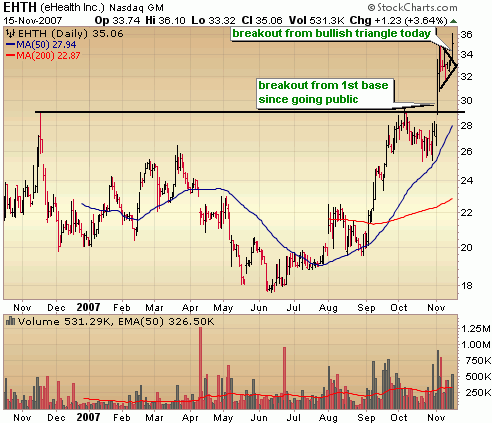
Taking a look at the data of the past two weeks, there were 20 breakouts tracked by SelfInvestors.com with only 5 finishing the two week period with a gain and 15 finishing with a loss.  On the bright side, only one stock, Trina Solar (TSL) would have stopped you out with a loss and was the biggest loser with a 19% loss.  Expeditors International (EXPD) would have too, but it didn’t confirm a breakout due to a lack of volume on the breakout move, so it should not have been purchased.  The biggest winner award belongs to eHealth (EHTH) which has vaulted 18% since breaking out and actually broke from another bullish formation (triangle pattern) today for further gains.  This is a stock I was focusing on in the live chat room today and picked up some nice profits in an otherwise dismal day. 

The stock broke out of a long, deep base above 29.50 on Nov 2nd and has not looked back.  This is the first base breakout of the stock since going public late last year.  Today, the stock surged again out of a bullish triangle formation and is up about 20% from the original breakout point.  I personally put on a swing trade in EHTH today and am looking for a bit more profit tomorrow.  I don’t recommend getting in on it up at these levels, it’s much too extended now.

Full Disclosure/Disclaimer: The stock of the day is by no means a buy recommendation.  Please do your own research and make a personal decision based on your own tolerance for risk.  I currently do own a position in eHealth (EHTH)

Solar Still Shines – Suntech Power (STP) Surges After Earnings

Today’s SelfInvestors Leading Stocks Moving on Earnings

UP

• Suntech Power (STP)  Electronic Equipment, fundamental rank [28/30],  up 6%, still  tacking on gains after a big recent breakout but that high volume reversal on Nov 8 is a concern


DOWN

• Lifeway Foods (LWAY) Dairy Products, fundamental rank [25/30],  down 25%, good bye for a long long time

• Green Mountain Coffee Roasters (GMCR)  Processed & Packaged Goods, fundamental rank [24/30],  down 9%, in process of carving out new base

• Sina Corp (SINA) Internet Software & Services, fundamental rank [23/30],  down 6%, has pulled back significantly in past several days to previous breakout point, but probably tests the 200 day moving average at some point

Three S Bio (SSRX) Still Looking Bullish After Earnings

Today’s SelfInvestors Leading Stocks Moving on Earnings

UP

• 3S BIO (SSRX) Biotech, fundamental rank [27/30],  up 16%, reclaimed support of 50 day moving average to retain bullish chart

DOWN

• KHD Humboldt (KHD) Heavy Construction, fundamental rank [23/30],  down 9%, taking out support of 50 day moving average but holding near previous pivot point.. could be a good buy soon.  Decent quarter.

• Diana Shipping (DSX) Shipping, fundamental rank [25/30],  down 4%, high volume reversal today sets up further deterioration but in my opinion that will offer a great buy opportunity!

This Dead Cat Made of Rubber From China; Stock of Day – Cellcom Israel (CEL)

Meow! Screech!! The cat bounced today with jet propulsion force from well oversold conditions.  That’s not much of a surprise.  Bull markets die hard and this one will too.  We got a short term capitulation day last Thursday followed by some light volume selling the following two days and a touch of key support levels, so the dead cat was approaching the launch pad.  Throw in positive comments from Walmart (hey, the biggest discount retailer is doing well it’s great! or is it?), some reassuring comments regarding the subprime mess over at the Merrill Lynch Conference and you have a recipe for a short covering fueled rally.  The price action was mighty impressive I must admit.  I was a bit surprised at the magnitude of today’s rise but volume levels were not a surprise.  There wasn’t much conviction behind the move today so a classic dead cat bounce it was.  That’s not to say there isn’t room to run.  Both the Dow and Nasdaq probably have enough juice to run up and kiss their 50 day moving averages and the S&P might just have the gusto to get above the 200 day moving average.  All in all though, you should be using this rise as an opportunity to limit your exposure on the long side if you haven’t already done so.  For you day and swing traders there will continue to be trading opportunities on both sides but for most this is just an opportunity to reduce exposure on the long side and maybe initiate a short or two.

::: Major Indices Performance – The Numbers :::

(Note: volume averages are based on the average over the past 50 days)
Data as of 4:00EST – End of Day November 13th 2007

Nasdaq: UP 3.46% today with volume 19% ABOVE average
Nasdaq ETF (QQQQ) UP 4.12%, volume 76% ABOVE average
Dow: UP 2.46%, with volume 17% ABOVE the average
Dow ETF (DIA): UP 2.6%, with volume 9% ABOVE the average
S&P ETF (SPY): UP 3.05%,  with volume 5% ABOVE the average
Russell Small Cap ETF (IWM): UP 3.09%, with volume 22% ABOVE the average

::: SelflInvestors Leading Stocks :::

The Self Investors Leading Stocks Index is comprised of stocks in the Breakout Tracker, which is a database of the fastest growing companies near a breakout or having already broken out of a base. 

Summary:

* Advancers led Decliners 325 to 48
* Advancers were up an average of 4.41% today, with volume 28% ABOVE average
* Decliners were down an average of 1.82% with volume 57% ABOVE average
* The total SI Leading Stocks Index was UP 3.61% today with volume 32% ABOVE average

::: Where’s the Money Flowing :::

Many investing websites provide leading industries based on price performance alone. However, without accompanying volume levels, this can sometimes be misleading.  The only way that I know of to gauge industry/sector strength WITH volume levels is through the analysis of ETF’s.  A couple years ago this was not possible, but as more traders/investors use ETF’s they become a much better tool for gauging the health of the market and seeing where the money is flowing (or not flowing).  Using the proprietary SelfInvestors Demand Indicator score which measures price and volume movements, I’m able to quickly see which sectors/industries are seeing the greatest inflows of cash.  For a detailed look at how I go about gauging sector/industry strength please see the following post: http://selfinvestors.com/si/industry_tracking/

* Current Leading Sectors/Industries (over last 30 trading days):  
Internet Infrastructure, US Oil, Commodities, Agriculture, Pharma
                                          
* Current Lagging Sectors/Industries (over last 30 trading days): 
Semis, Retail, Internet

* Today’s Market Moving Industries/Sectors (UP):
Broker/Dealers, Retail, Clean Energy, Networking, Banks, Financial

* Today’s Market Moving Industries/Sectors (DOWN):
US Oil, Commodities

::: Stocks :::

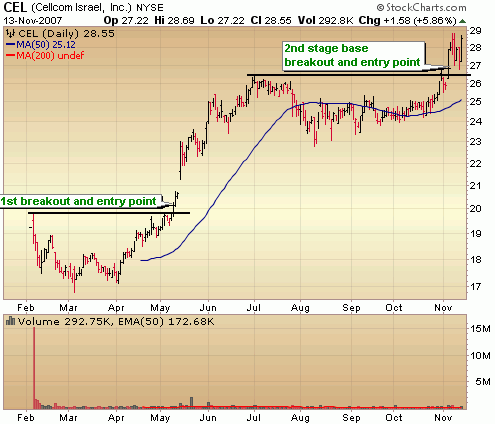
The stocks section will be an area where I highlight one stock selected from a group of stocks moving up with volume well above average and most likely breaking out of a base or consolidation.  Today’s stock is Cellcom Israel (CEL), a recent IPO that broke out of a 2nd stage base a few days ago.

ABOUT: 

Cellcom Israel Ltd. (Cellcom) is a provider of cellular communications services in Israel. The Company offers a range of cellular services through its cellular networks. These services include basic and advanced cellular telephone services, text and multimedia messaging services, and advanced cellular content and data services. As of December 31, 2006, Cellcom also offered international roaming services in 171 countries. It offers its subscribers a selection of handsets from various global manufacturers, as well as extended warranty and repair and replacement services. It also offers landline transmission and data services to business customers and telecommunications operators. Since July 2006, Cellcom began offering landline telephony services to selected businesses. As of December 31, 2006, the Company provided cellular communications services to approximately 2.884 million subscribers, including basic cellular telephony services and value-added services, as well as handset sales.

FUNDAMENTALS: 

Cellcom Israel is a company that posts a profit every year but struggles with consistency from year to year.  That may be changing with 4 straight quarters of excellent quarter over quarter earnings growth of 107%, 59%, 55% and 61%.  Sales growth could be a bit stronger but is solid with quarter over quarter growth of 23%, 21%, 10% and 15% over the past year.  Following year over year earnings growth of 18% in ’06, the company is expected to post growth of 54% here in 2007 with estimates of 12%  growth in ’08.  Those kinds of growth numbers aren’t world beating like some of the other companies I’ve posted here in the Stock of the Day section but they are good and represent greater consistency in growth than in years past.  Where the company really shines is in Return on Equity which has spiked to 150% recently and indicates a strong management team.  Net margins are good at 14% and have also spiked in the past year.  Overall, this is a company with strong fundamentals.

TECHNICAL:  

CEL is a stock that IPO’d back in February of this year and didn’t take much time to break out from its first base just a couple months later.  It ran up roughly 30% before falling into another shallow base with tight price action.  Both characteristics of bullish action.  I’d have to say that this is one of the best looking base formations and resulting breakouts out there right now.  Following today’s move it’s a bit extended from a proper buy point, but any kind of minor pullback from here might offer a great spot to play it.

SELFINVESTORS RATING: With a total score of 51/60 (24/30 for fundamentals, 27/30 for technical), Cellcom Israel (CEL) is a top 15 Self Investors breakout stock.

Full Disclosure/Disclaimer: The stock of the day is by no means a buy recommendation.  Please do your own research and make a personal decision based on your own tolerance for risk.  I currently do not own a position in Cellcom (CEL).

Cramer Has a Credibility Problem

I’ve avoided Jim Cramer bashing here on this blog because he gets it from all sides elsewhere but I wanted to post this video from Don Harrold.  Don is a colorful guy and he puts together some great videos that I’ve enjoyed watching over the past several months.  In this video he once again highlights Jim Cramer’s flip flopping recommendation on how to play the market.  I personally don’t have a problem with Jim making a bad call.  When you make that many calls and all eyes are on you, you’re going to have some big misses.  That’s fine, we all make bad calls.  What I do have a problem with is, as Don points out so well, is the constant change of viewpoints.  When the market is rallying and at all time highs he continued to pound the table to buy stocks rather than urging some caution.  Understand Jim you have lots of new investors hanging on your every word.  Be responsible.  Then don’t completely reverse your recommendation after a market selloff.  You’ve lost any credibility you had left.


Bull Market At the Brink But Not Dead; Hot IPO – Internet Brands (INET)

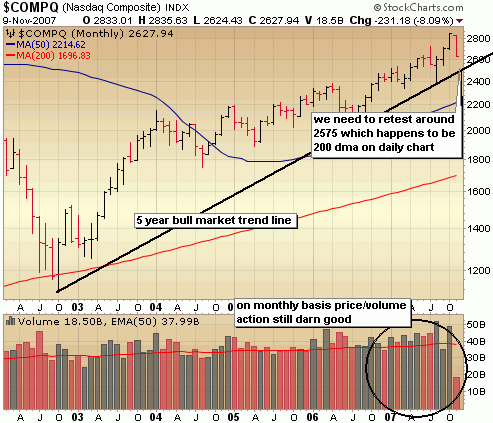
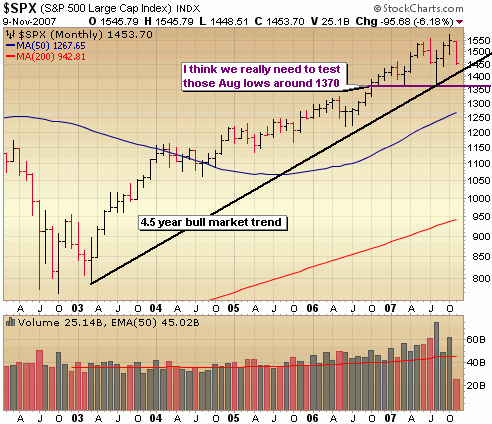
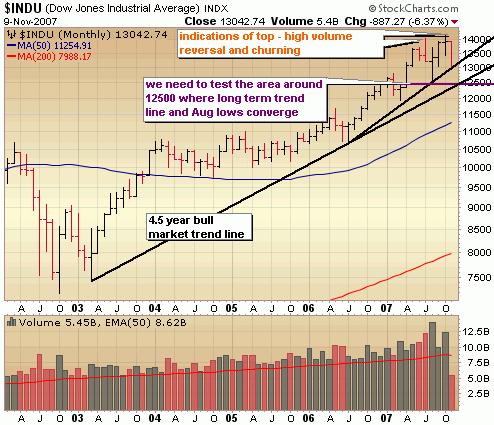
There’s quite a bit of doom and gloom out there right now and to a certain degree it’s warranted but tonight I wanted to just throw up the long term monthly charts of the major indices which reveal that this bull market is still intact with a bit of room left to the down side before these long term critical support levels come into play.  It’s conceivable that we test these trend lines and continue the bull run but given the length of the run (about 5 years) we have to continue to play defensively up here and remain in capital preservation mode until the market can show that the selling intensity has subsided and buyers are stepping in with some aggression.  Perhaps the market is washing out a bit here to prepare for yet another holiday rally but let’s not make big bets on that just yet.

Inthe Nasdaq chart below I’ve drawn out the long term upward trend beginning off the 2003 lows and the start of a new bull market.  After a 5 year running of the bulls, the market is no doubt tired but it’s important to note the trend line is still intact.  We have about another 50 points to go before the Nasdaq tests this support area around 2575.  Despite the pain of the past couple weeks, the bull run is still alive and well but on shaky legs.

Given that the S&P is littered with financial stocks, I think ultimately it could break through that upward trend line which defines the bull market run as more CEO’s are forced to reveal the true nature of the hit they have taken.  Those August lows are the next critical area of support.  If we break through that level, we could be in for a long bear market.

The Dow is testing a steeper upward trend that began last year but has room to run before testing the 4.5 year bull market trend line around 12500.  Considering this area also happens to coincide with the August lows, it’s a very strong area of support.  If we take out this level I think it’s safe to say the bull market is dead.  Note the indications of topping in the Dow in July (high volume reversal) and last month (churning, which is a higher volume move with little to no price appreciation)

::: Model Portfolio Update :::

For the first time in several weeks, the Self Investors Model Portfolio finished the week with a loss (down 3.7%) which was  in line with what the S&P did at 3.7% but year to date is now nearly 10x the performance of the S&P with a gain of 23.9%.  Closing out my QID position after the Fed cut rally was probably one of the biggest mistakes I’ve made this year.  Knowing that the first Fed cut move is very often a false move, I’m not sure why I didn’t trust that and hold the QID position a few more days.  Mistakes happen but hopefully not very often!  I continue to tread fairly lightly not making big bets either way although of course I wish I can put on a few more short trades.  The decline over the week was so sharp, there just weren’t any good shortable bounces.  I did close out one short trade in BTH for a 7% gain but that was tempered by sizable losses in China Digital (STV) and Cynosure (CYNO).  I did initiate 3 new small long positions in high quality companies.. I just couldn’t resist dabbling after some of these were thrown out with the rest of the market.   The portfolio is currently split equally with 50% long and 50% cash.   

::: Best/Worst Performers :::

– Top 10 Performing Industries For the Week –

1. Internet Service Providers: 14.15%
2. Surety & Title Insurance: 8.20%
3. Hospitals: 4.10%
4. Home Furnishing Stores: 3.15%
5. Farm Products: 2.90%
6. Industrial Equipment & Components: 2.70%
7. Oil & Gas Drilling & Exploration:  2.65%
8. Cleaning Product: 2.30%
9. REIT – Healthcare Facilities: 2.15%
10. Dairy Products: 2.00%

– Top 10 Worst Performing Industries For the Week –

1. Toy & Hobby Stores: -14.55%
2. Major Airlines: -12.95%
3. Data Storage Devices: -12.45%
4. Networking & Comm Devices: -11.95%
5. Recreational Goods: -11.15%
6. Security Software & Services: -10.45%
7. Regional Airlines: -10.40%
8. Personal Computers: -10.35%
9. Wholesale Other: -10.25%
10. Internet Info Providers: -9.95%

– Top 5 Best Performing ETFs For the Week –
 
1. Ishares Silver (SLV)  5.25%
2. Ishares Gold (IAU) 3.10%
3. Central Fund of Canada (CEF) 3.10%
4. SPDR Gold (GLD) 2.95%
5. KBW Banking (KRE) 2.00%

– Worst 5 Performing ETF’s –

1. Morgan Stanley China (CAF) -14.85%
2. India Fund (IFN)  -13.45%
3. PowerShares Global Dragon (PGJ)  -12.60%
4. Ishares China (FXI)  -12.50%
5. Morgan Stanley India (IIF)  -11.40%

:::  IPO’s Worth Watching for This Week :::

The first week in many with no China IPO’s!!  I particularly like Internet Brands and the MCSI this week.

1.  Internet Brands (INET):  helps customers research and purchase, online or at an actual location, big ticket items, such as cars, real estate, mortgages, and travel. Its 40-plus Web sites include those for automobiles (Autos.com, CarsDirect.com), homes and mortgages (LoanApp.com), and vacation rental properties (BBOnline.com, VacationHomes.com). The company offers financing and mortgages through various banks. More than 3,000 local car dealers have joined its nationwide network and it has alliances with Penske Automotive Group (formerly United Auto Group) Trading set to begin on Thursday.

2. MSCI (MXB) formerly Morgan Stanley Capital International, creates equity, fixed income, and hedge fund indices as well as risk management and portfolio analysis tools used by 24 of the 25 largest asset management firms. Its most well known products are MSCI World and EAFE indices to watch global funds and BarraOne for Web-based risk analysis. The latest entry is MSCI Global Islamic Indices, which incorporate allowances for Sharia or Islamic law. MSCI operates from about 20 offices worldwide serving nearly 3,000 customers in more than 60 nations. Financial services powerhouse Morgan Stanley owns the company.   Trading set to begin on Thursday.

3.  Stewart & Stevenson (SSC):  company is a leading supplier of equipment used in oilfield services. Stewart & Stevenson operates three divisions: Equipment (oil well stimulation, coil tubing, engines, and material handling equipment), Aftermarket Parts and Service (parts and service for customers in oil and gas, marine, power generation, mining, and construction industries), and Rental (rental of generators, material handling equipment, and air compressors). Customers in the oil and gas services industry such as Schlumberger, Weatherford International, and BJ Services account for about 60% of sales.    Trading set to begin Friday.

4. Navios Maritime Partners (NMM) international owner and operator of dry bulk carriers (merchant ships used to transport unpackaged bulk commodities) — formed in 2007 by leading seaborne shipping company Navios Maritime Holdings (NMH) — plans to leverage NMH’s more than 50 years of experience to pursue growth opportunities and expand its fleet. NMP’s initial active fleet consists of six Panamax vessels and one Capesize vessel; it also has two vessels under contract for delivery.  Trading set to begin on Monday.

5. Och-Ziff Capital (OZM):  provides a variety of alternative asset management services for more than 700 fund investors through five locations in the US, Europe, and Asia. Och-Ziff Capital Management Group’s investment strategies include private equity, real estate, and equity restructuring, among others. With nearly $27 billion in assets under management, the company invests more than 50% of its assets in foreign markets. The hedge fund firm, which has some 130 investment professionals including some 20 partners, commenced operations in 1994.  Trading set to begin on Wednesday.

6.  EnergySolutions (ES): provides nuclear waste management services, primarily to the US Department of Energy, including nuclear facility decommissioning and decontamination, spent fuel handling, and waste disposal. Three nuclear waste services companies — Envirocare of Utah, Scientech D&D, and BNG America — combined to form EnergySolutions.   Trading set to begin on Thursday.

::: Upcoming Economic Reports (11/12/07 – 11/16/07) :::

Monday:         None
Tuesday:       Pending Home Sales, Treasury Budget
Wednesday: Retail Sales, PPI, Business Inventories, Crude Inventories
Thursday:      CPI, Initial Claims, Philly Fed
Friday:            Industrial Production, Cap. Utilization

::: Upcoming Notable Earnings Reports :::

Monday:  Companhia Paranaense de Energia (ELP), 51job (JOBS)

Tuesday:  ExlService (EXLS), Fossil (FOSL), 3SBio (SSRX)

Wednesday: Sina (SINA), Meridian Bioscience (VIVO), GigaMedia (GIGM), KHD Humboldt (KHD), Diana Shipping (DSX)

Thursday: Suntech Power (STP), Green Mountain Coffee Roasters (GMCR), Autodesk (ADSK), Global Sources (GSOL), FCStone (FCSX), Mobile Telesystems (MBT)

::: In Case You Missed It – SelfInvestors Blog Entries of the Past Week :::

1. Dolby Labs (DLB) To the Moon On Earnings

2. Role Reversal: Dow and S&P Capitulate, Tech Wrecked; Stock of Day – ExlService (EXLS)

3. Brazilian Homebuilder Gafisa (GFA) & Top Solar Play First Solar (FSLR) Spike On Earnings

4. Expert Insight Into the Oil/Gas Engineering Industry

5.  October Highs Most Likely A Long Term Top

6.  Foster Wheeler (FWLT) The Lone Bright Spot

7. TheStreet.com (TSCM), Quintana Maritime (QMAR) & WMS Industries (WMS) Poised to Hit All Time Highs

7.  Flowserve (FLS), HMS (HMSY), Stanley (SXE), eHealth (EHTH), Open Text (OTEX) & GFI Group (GFIG) All Soar to New Heights
Dolby Labs (DLB) To the Moon On Earnings

Today’s SelfInvestors Leading Stocks Moving on Earnings

UP

• Dolby Laboratories (DLB) Diversified Electronics, fundamental rank [27/30],  up 14%, adding to gains after October breakout from base

• Middleby Corp (MIDD) Diversified Machinery, fundamental rank [25/30],  up 14%, reclaims support of both 50 and 200 day moving averages and working on a new base

• Perini Corp (PCR) Heavy Construction, fundamental rank [24/30],  up 7%, found support at 200 day moving average and working on a double bottom base

• Darling International (DAR) Cleaning Products, fundamental rank [23/30],  up 5%, recent breakout was on verge of failure but making a come back and may carve out base on base pattern

DOWN

• Gmarket (GMKT) Catalog & Mail Order Houses, fundamental rank [26/30],  down 13%, trying to hold at 200 day moving average and keep recent breakout intact

• Comtech Group (COG)) Diversified Communication Services, fundamental rank [26/30],  down 12%, bullish triangle formation broken but holding above 200 day moving average

• JA Solar (JASO) Electronic Equipment, fundamental rank [28/30],  down 12%, good recovery from morning lows and holding above 20 dma.. still looking very bullish

• Integra LifeSciences (IART) Biotech, fundamental rank [26/30],  down 10%, any chance of carving out a shallow, healthy base gone, next support around 40

• Perfect World (PWRD) Gaming Activities, fundamental rank [23/30],  down 10%, good recovery from morning lows and holding above 20 dma.. still looking very bullish

Role Reversal: Dow and S&P Capitulate, Tech Wrecked; Stock of Day – ExlService (EXLS)

It certainly didn’t take long for the market to test critical support levels that I discussed in my weekend report.  Surprisingly, the indices held up quite well at the open despite yesterday’s downward momentum and a Cisco selloff but it didn’t take long for the market to resume the red.  Poor same store sales results got it started and less than positive remarks out of Bernanke sent the market into a tailspin.  The selling intensity was fierce  .. watching a stock like TSL drop 10 bucks in 2 hours was unbelievable.  When you see high quality stocks selling off like that you know that the selling is a bit irrational at least on an intraday basis.  I jumped in to a few positions personally at this point to take advantage of great stocks being thrown out with the bathwater.  This kind of volatility is a day trading dream but it wasn’t without the Tums close by! 

The selling intensity ultimately gave way to what was probably a healthy round of short covering as shorts locked in profits in many of the financial names.  It was a remarkable recovery in both the Dow and S&P which resulted in a short term capitulation day and potentially marks a bottom in the short term which just may be the floor for another holiday market run.  However, the Nasdaq didn’t fare so well.  It did finish well off the lows, but not enough to signal that a bottom is in place over the short term.  Key support of the July highs and the 50 day moving average were both taken out today with all time record volume levels so obviously the dichotomy that existed between the Dow/S&P and Nasdaq is closing a bit. 

This market looks tradeable here on the long side but still on a shorter term basis.  For most, it will probably best to continue to sit on the sidelines until some of the volatility subsides and the market steadies a bit.

::: Major Indices Performance – The Numbers :::

(Note: volume averages are based on the average over the past 50 days)
Data as of 4:00EST – End of Day November 8th 2007

Nasdaq: DOWN 1.92% today with volume 58% ABOVE average
Nasdaq ETF (QQQQ) DOWN 3.04%, volume 188% ABOVE average
Dow: DOWN .25%, with volume 66% ABOVE the average
Dow ETF (DIA): DOWN .67%, with volume 196% ABOVE the average
S&P ETF (SPY): DOWN .51%,  with volume 113% ABOVE the average
Russell Small Cap ETF (IWM): UP .30%, with volume 45% ABOVE the average

::: SelflInvestors Leading Stocks :::

The Self Investors Leading Stocks Index is comprised of stocks in the Breakout Tracker, which is a database of the fastest growing companies near a breakout or having already broken out of a base. 

Summary:

* Decliners led Advancers 209 to 164
* Advancers were up an average of 2.57% today, with volume 53% ABOVE average
* Decliners were down an average of 3.13% with volume 66% ABOVE average
* The total SI Leading Stocks Index was DOWN .62% today with volume 60% ABOVE average

::: Where’s the Money Flowing :::

Many investing websites provide leading industries based on price performance alone. However, without accompanying volume levels, this can sometimes be misleading.  The only way that I know of to gauge industry/sector strength WITH volume levels is through the analysis of ETF’s.  A couple years ago this was not possible, but as more traders/investors use ETF’s they become a much better tool for gauging the health of the market and seeing where the money is flowing (or not flowing).  Using the proprietary SelfInvestors Demand Indicator score which measures price and volume movements, I’m able to quickly see which sectors/industries are seeing the greatest inflows of cash.  For a detailed look at how I go about gauging sector/industry strength please see the following post: http://selfinvestors.com/si/industry_tracking/

* Current Leading Sectors/Industries (over last 30 trading days):  
Internet Infrastructure, Gold, Gold Miners, Clean Energy, Commodities
                                          
* Current Lagging Sectors/Industries (over last 30 trading days): 
Semis, Internet, Retail, Utilities, Retail, Financial

* Today’s Market Moving Industries/Sectors (UP):
Clean Energy, Utilities, Energy, Banks

* Today’s Market Moving Industries/Sectors (DOWN):
Networking, Technology, Internet (been a very long time since I’ve seen this industries in the big down movers list!)

::: Stocks :::

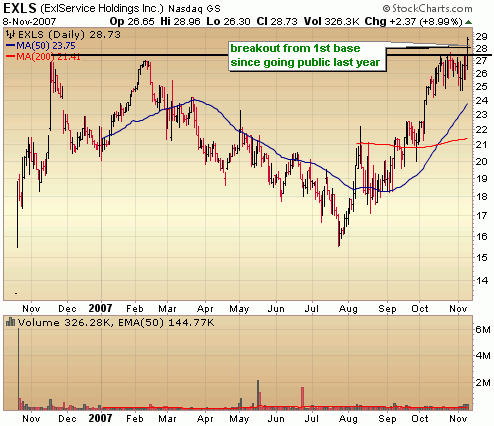
The stocks section will be an area where I highlight one stock selected from a group of stocks moving up with volume well above average and most likely breaking out of a base or consolidation.  Today’s stock is ExlService (EXLS), an IPO that debuted last year and broke out of its first base today.

ABOUT: 

ExlService Holdings, Inc. (ExlService Holdings) is a provider of offshore solutions, including business process outsourcing (BPO), research and analytics and advisory services, primarily serving the needs of companies in the banking, financial services and insurance (BFSI) sector, as well as other industry sectors, such as utilities. The Company provides integrated front-, middle- and back-office process outsourcing services and manages processes for its United States-based and United Kingdom-based clients. The BPO services it provides involve the transfer to the Company of select business operations of a client, such as claims processing, finance and accounting and customer service, after which it administers and manages the operations for its client. Its advisory services include risk assessment, documentation and internal controls testing, business process re-engineering and process quality monitoring. On July 1, 2006, the Company acquired Inductis LLC.

FUNDAMENTALS: 

EXLS is a company that has been posting outstanding growth over the past few years and posted its first profitable year in ’04 after posting a loss of 1.75/share in ’02 and a loss of .03/share in ’03.  Since 2004 the company has posted year over year earnings growth of 30% and 104% with another 40 – 50% growth expected here in ’07.  Net margins (14%) and ROE (22%) are very good and have been rising with no debt on the balance sheet.  Clearly a fundamentally sound company.

TECHNICAL:  

The stock broke out from a long cup with handle base today for the first time since going public.  Volume was levels showed good conviction in the move with trading volume coming in at more than 2.5 times the daily average.  With a good up volume to down volume ration over the last few months, tight price action and all time highs within striking distance, this is a stock chart exhibiting very bullish characteristics.

!Important:  EXLS has not yet reported earnings and will do so on November 13th before the market opens.  Just as I do with nearly all companies, I don’t recommend holding EXLS through its earnings report.  It’s just too much of a risk.  While Veraz Networks (VRAZ) is not the same caliber of company that EXLS is just look at what happened to it after reporting earnings on Wednesday.  Wait for EXLS to report and if its not too extended consider a position.

SELFINVESTORS RATING: With a total score of 52/60 (25/30 for fundamentals, 27/30 for technical), ExlService Holdings (EXLS) is a top 10 Self Investors breakout stock.

Full Disclosure/Disclaimer: The stock of the day is by no means a buy recommendation.  Please do your own research and make a personal decision based on your own tolerance for risk.  I currently do not own a position in ExlService (EXLS)