All posts by Tate Dwinnell

Bidz.com (BIDZ), Citron Research (Stocklemon.com) Soap Opera Continues

Citron Research (formerly known as StockLemon.com) is at it again.  I first became aware of this site a few years ago but it wasn’t until their profile of Home Solutions (HSOA) that I began to follow their research.  That stock has plummeted to below 2  since Citron began hounding the company.  Despite the rumored questionable past of its founder Andrew Left (there is an entire blog dedicated to it), the company does provide some incredibly in depth research highlighting the shady business practices of certain businesses.  The only problem I do have is that Andrew and certainly its employees take positions in these companies ahead of the reports and undoubtedly profit big time as the disclaimer on the site says:

"The principals of Citron Research most always hold a position in any of the securities profiled on the site.  Citron Research will not report when a position is initiated or covered. Each investor must make that decision based on his/her judgment of the market."

This kind of front running needs to be stopped immediately because it can lead to a fabrication of the facts.  Sure, there are many bloggers out there who write about stocks they own including myself, but when certain websites achieve a wide following and can impact a stock like Citron Research can, it has to be stopped. 

The latest Citron Research report highlights Bidz.com (BIDZ), a stock I recently traded in the Self Investors Model portolio and fortunately closed for a quick 30% gain before this debacle began.  Since that report was published the stock is down more than 50% in just two days and sinking another 3 bucks after hours as the company seeks to calm the nerves of investors.  More on this in a bit.  There are certainly quite a few angry investors out there looking to place blame not only on Citron for running the article, but on IBD who had the stock listed atop the the IBD 100 and recenlty profiled it with a glowing review, not to mention the Roth Capital and Think Equity buy ratings. 

The company obviously had no choice but to respond to this action and chose to hold a conference call.  Big mistake.  Have a listen to the conference call.  During the first half, the CEO just reiterates that the company is strong, reaffirms the numbers, mentions they might pursue legal action.. blah, blah.  The most interesting is the second half when the company takes questions.  Zinberg certainly stumbles a bit when asked about the inflated prices of televisions and a yellow ring currently under auction for half a milion dollars at the site.  I certainly didn’t walk away feeling tremendously confident about this company or its CEO and it’s clear that many others didn’t either as the stock tanked during the latter half of the call.  Eric Savitz of Barrons has a good rundown of the highlights of the call if you’re short on time.

As usual this is most likely a case of "not as bad or as good as it seems".  The important thing to remember is that there are a ton of great companies out there run by management with a long history of success so why look at this at a buying opportunity?  There are just too many questions to be answered.   More importantly, why were these angry traders hurt so badly?  The kind of selling volume that BIDZ was seeing on Nov 26th and a close at the lows of the day should have at the very least got you out of the stock with a small gain (had you bought at the proper breakout point above 15.19).  I personally love this kind of volatility for day trading and believe it could run up 20 – 30% within the next day or two, but to be a "buy and holder" of this stock right now is in my opinion a mistake.

It should be interesting to see how this story unfolds over the next few months.  Keep in mind that Citron Research is expected to come out with a second part to their Bidz.com (BIDZ) research detailing the bid rigging allegations  very soon which could further derail the stock. 

Disclaimer: I don’t currently have a position in Home Solutions (HSOA) or Bidz.com (BIDZ)

Accumulation Day, But No Indication of Bottom Yet; Stock of Day – Danaher (DHR)

At this point I think it’s safe to say that the market is looking for just about any glimmer of positive news in order to rally from very oversold conditions and will probably begin brushing aside some of the bad news that has become typical such as horrible existing home sales.  News out of Citigroup that it’s getting a 7.5 billion cash infusion provided some early optimism but is this really a positive?  To think a company like Citigroup would need to raise cash in a hurry from a foreign company at 11% is in my mind a harbinger of things to come.  It’s going to get worse. 

At any rate, the market pulled itself up by its boot straps from oversold conditions today and managed to stage a significant rally with enough volume to signal accumulation.  Yes, there was good volume behind today’s rally, but this is not the kind of action that marks a bottom.  Throughout the day, I was surprised at how few opportunities there were in breakouts of leading stocks.  When the market turns, there will be a wave of high quality breakouts to choose from, but we need to see a big day of capitulation or some big time institutional buying before that can happen.  Neither occurred today, so it pays to continue to tread lightly here.  We’re close, but not quite there yet.  There will be plenty of time to profit, so the important thing is to not jump in aggressively too early.  The early bird may get the worm, but he also may find himself in the belly of a bear.

::: Major Indices Performance – The Numbers :::

(Note: volume averages are based on the average over the past 50 days)
Data as of 4:00EST – End of Day November 27th 2007

Nasdaq: UP 1.57% today with volume 1% BELOW average
Nasdaq ETF (QQQQ) UP 2.00%, volume 29% ABOVE average
Dow: UP 1.69%, with volume 25% ABOVE the average
Dow ETF (DIA): UP 1.46%, with volume 55% ABOVE the average
S&P ETF (SPY): UP 1.15%,  with volume 49% ABOVE the average
Russell Small Cap ETF (IWM): UP 1.27%, with volume 11% BELOW the average

::: SelflInvestors Leading Stocks :::

The Self Investors Leading Stocks Index is comprised of stocks in the Breakout Tracker, which is a database of the fastest growing companies near a breakout or having already broken out of a base.  Leading stocks were about in line with what the major indices did today, but notice the volume behind rising stocks versus declining stocks.  Not exactly bullish action from the leaders today.

Summary:

* Advancers led Decliners 227 to 76
* Advancers were up an average of 2.17% today, with volume 4% BELOW average
* Decliners were down an average of 2.45% with volume 57% ABOVE average
* The total SI Leading Stocks Index was UP 1.01% today with volume 11% ABOVE average

::: Where’s the Money Flowing :::

Many investing websites provide leading industries based on price performance alone. However, without accompanying volume levels, this can sometimes be misleading.  The only way that I know of to gauge industry/sector strength WITH volume levels is through the analysis of ETF’s.  A couple years ago this was not possible, but as more traders/investors use ETF’s they become a much better tool for gauging the health of the market and seeing where the money is flowing (or not flowing).  Using the proprietary SelfInvestors Demand Indicator score which measures price and volume movements, I’m able to quickly see which sectors/industries are seeing the greatest inflows of cash.  For a detailed look at how I go about gauging sector/industry strength please see the following post: http://selfinvestors.com/si/industry_tracking/

* Current Leading Sectors/Industries (over last 30 trading days):  
Bonds, Agriculture
                                          
* Current Lagging Sectors/Industries (over last 30 trading days): 
Semis, Retail, Internet, Materials

* Today’s Market Moving Industries/Sectors (UP):
Internet, Real Estate, Biotech, Regional Banks, REIT

* Today’s Market Moving Industries/Sectors (DOWN):
Oil, Gold, Commodities, Oil Services, Natural Resources

::: Stocks :::

The stocks section will be an area where I highlight one stock selected from a group of stocks moving up with volume well above average and most likely breaking out of a base or consolidation.  Today’s stock isn’t going to grab headlines and be bantered about in discussion boards.  Danaher (DHR) is a blue collar, large cap conglomerate that straps the hard hat on every day and delivers consistent profits quarter after quarter, year after year. 

ABOUT: 

Danaher Corporation derives its sales from the design, manufacture and marketing of professional, medical, industrial and consumer products. It operates in four segments: Professional Instrumentation, Medical Technologies, Industrial Technologies, and Tools & Components. During the year ended December 31, 2006, it acquired Sybron Dental Specialties and Vision Systems Limited, in addition to other nine companies, which are manufacturers and assemblers of environmental instrumentation, medical equipment or industrial products, in the market segments of electronic test, critical-care diagnostics, water quality, product identification, and sensors and controls. In July 2007, the Company acquired ChemTreat, Inc. In July 2007, the Company completed the sale of its power quality business to Thomas & Betts Corporation. As of November 21, 2007, the Company, through its indirect wholly owned subsidiary, Raven Acquisition Corp., had acquired over 90% interest in Tektronix, Inc.
FUNDAMENTALS: 

Danaher is far from the small cap high flyers I often highlight here, but in difficult markets it’s the big, lumbering, profit machines that will weather the storms the best and Danaher is certainly one of those.  According to Morningstar, the company has posted EPS growth in 9 out of the past 10 years and isn’t yet showing any signs of slow down.  EPS growth since 1997 has come in at 20.7%, 2.7%, 35.6%, 24.6%, (9.9%), 38.8%, 20.8%, 36.5%, 20% and 26.1% last year in 2006.  Growth for 2007 is expected to remain in line with historical growth with about a 20% rise in EPS.  Revenue growth has been equally as solid over the years but it should be noted that revenue growth has been decelerating a bit in recent quarters, dropping from 22%, to 18%, 19%, 14% and 13% in the latest quarter.  Still excellent growth for a company of this size.  Combined with a very good Return on Equity of 17%, Net Margins that continue to rise as they have over the past 5 years and strong management ownership of over 20%, Danaher is top Self Investors large cap stock.

TECHNICAL:  

The chart of DHR over the past 2 years provides a great example of how you might play a leading breakout stock, adding shares on each subsequent breakout.  The first entry point was provided on a break from a long one year base at the beginning of 2006.  It provided a 2nd entry point on a break from a new base in early October 2007 and a 3rd entry on a breakout this summer to yet another all time high.  Despite a correcting market, DHR continues its bullish ways and has come away relatively unscathed over the past month and is looking poised to breakout from a flat base it’s been working on since late September.  The stock may provide a good entry on a breakout from this flat base above 86.  Remember: the stocks that hold up the best during a correction will likely lead the market with big gains once the market gets going again.

SELFINVESTORS RATING: With a total score of 50/60 (26/30 for fundamentals, 24/30 for technical), Danaher (DHR) is a highly rated Self Investors leading stock.

Full Disclosure/Disclaimer: The stock of the day is by no means a buy recommendation.  Please do your own research and make a personal decision based on your own tolerance for risk.  I currently do not own a position in Danaher (DHR)

Self-Directed Portfolio Advantages/Disadvantages

There is much debate about whether individuals with a self-directed portfolio can outperform the major indices as well as mutual funds, which are touted by Wall Street as the only way for the average investor to accumulate wealth.  It makes sense doesn’t it?  By keeping alive the pervasive myth that a buy and hold strategy in mutual funds is the best way to go, they ensure that you’ll continue to dump your hard earned cash into their funds while they collect their exorbitant management fees.. all the while soothing your concerns of under performance by repeating the mantra "that over the long haul we will out perform the market."  Sure, there are some very good funds out there, but I believe with some solid technical analysis skills, the right tools, discipline and organization anybody can greatly exceed average returns.  I thought I’d highlight some advantages and disadvantages of a self-directed portfolio.

Advatages:

1.  Greater returns
The average actively managed stock mutual fund returns approximately 2% less per year to its shareholders than the stock market returns in general.

As time goes on, the majority of mutual funds underperform index funds

2.  Potential for reduced fees.
By using ETF’s and trading with a discount broker you can reduce investing costs.  Just remember that the larger your account the smaller your trading costs.  If you’re daytrading a small account you will get killed in commissions!  On the other hand, if you have a large account and making a few trades in stocks and ETF’s, suddenly that 2% management fee you were paying before looks real expensive doesn’t it!  The larger your account, the more it makes sense to invest for yourself.

3.  Nobody cares more about your money than you do.
You take control of your financial situation and your future!   No mutual fund manager will have you in their best interest.

4.  Mobility/Flexibility
Trading for yourself full time can yield large gains in both bear and bull markets allowing you to work anytime from anywhere in the world if you so choose.

5.  It’s Fun!
Researching the next great companies, following breaking news each day and exchanging trading ideas with others all over the world is great fun.

Disadvantages:

1.  Time
It requires more time to do this on your own but it’s your financial future, so make time.  By using just ETF’s and making a few well researched trades each month, your time is minimal and the payoff can be huge.

::::::::::::::::::::::::::::::::::

Did you know that you can  use a self-directed IRA account to invest in real estate too?

:::::::::::::::::::::::::::::::::

If you’re looking to get a leg up in your self-directed portfolio endeavors, how about giving the Self Investors Gold membership a look?  You’ll receive buy and sell alerts in a Model Portfolio within minutes of every transaction.  After a top tier performance  of 27.6% last year, the Model Portfolio is posting strong gains again this year of over 24% while the S&P is in the red.

Contrarian Indicators Show Tradeable Rally Imminent

As an indication that we are far from bull market trading where bad news is brushed aside and any glimmer of good news is a catalyst for a rally, the early positive tone from strong Thanksgiving weekend retail numbers gave way to more financial doom and gloom and a rush to the equity exit door.  Citigroup layoff rumors, UBS downgrades of Freddie Mac and Fannie Mae and finally Senator Charles Schumer urging regulators to look into the risks associated with the goverment lending to Countrywide Financial which Schumer called "their personal ATM machine" provided the gloom du jour.

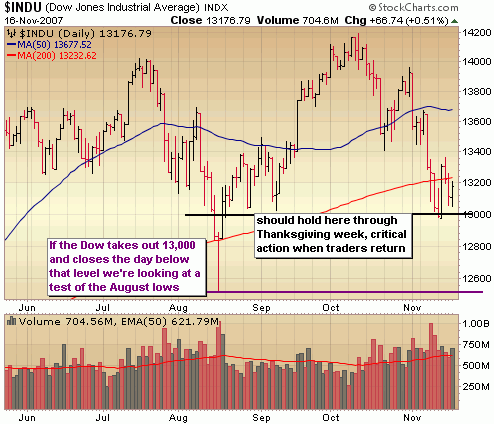
From a price standpoint today’s action was obviously ugly, but volume levels didn’t show tremendous conviction behind the move and leading stocks held up remarkably well (see below).   However, it was the first day of trading after a long holiday weekend, so taking that into consideration today’s action was no fluke and sets us up for further deterioration and a test of the August lows in the Dow at 12517.  The S&P and Nasdaq still have strong support levels in place before setting up a test of their August lows with the S&P500 level of 1400 and the Nasdaq level around 2500 becoming important psychological levels of support to keep an eye on.

I’ve been mentioning in recent reports that we are close to a tradeable bottom and as Doug Kass points out over at the Street.com, several contrarian indicators support this theory.

– Net long hedge fund exposure has plummeted
– Invidual investors are now as bearish as they were in summer of ’06 and March of ’03
– Consumer confidence at levels not seen since 1992
– Market oscillators indicating dramatically oversold

DailyWealth has also pointed out recently that we’re due for a bounce based on indicators from Jason Goepfert who says "current indicators are as lopsided as they’ve been in the past few years".  In a run down of over 100 indicators, 26 are showing bullish, while only 2 bearish.

Another contrarian play comes in the form of a member in my live chat room, who mentioned to me that his mom just called wondering when she should sell.  He received the same call in August.  What are you hearing from your family and friends?  Pay attention to the discussions at all the holiday parties and get a sense of how the "average" investor is feeling towards the stock market. 

I do believe we’re close to a bottom, but when I say bottom I’m just referring to a tradeable rally.  Just how big this rally will be is anyone’s guess, but there will be some significant opportunities on the long side very soon.  What I’m looking for is some kind of big capitulation day characterized by some panic selling followed by some institutional buying and short covering.  Until that happens, I remain in a large cash position.

When this market gets going again, you might like to take a look at these potential leaders.

::: Major Indices Performance – The Numbers :::

(Note: volume averages are based on the average over the past 50 days)
Data as of 4:00EST – End of Day November 26th 2007

Nasdaq: DOWN 2.14% today with volume 10% BELOW average
Nasdaq ETF (QQQQ) DOWN 1.73%, volume 8% BELOW average
Dow: DOWN 1.83%, with volume 6% ABOVE the average
Dow ETF (DIA): DOWN 1.51%, with volume 23% BELOW the average
S&P ETF (SPY): DOWN 2.21%,  with volume 9% ABOVE the average
Russell Small Cap ETF (IWM): DOWN 2.72%, with volume 8% ABOVE the average

::: SelflInvestors Leading Stocks :::

The Self Investors Leading Stocks Index is comprised of stocks in the Breakout Tracker, which is a database of the fastest growing companies near a breakout or having already broken out of a base.  Leading stocks actually fared relatively well today, dropping less then all of the major indices with little conviction behind the selling.

Summary:

* Decliners led Advancers 225 to 78
* Advancers were up an average of 2.08% today, with volume 28% ABOVE average
* Decliners were down an average of 2.62% with volume 9% BELOW average
* The total SI Leading Stocks Index was DOWN 1.41% today with volume 0% ABOVE average

::: Where’s the Money Flowing :::

Many investing websites provide leading industries based on price performance alone. However, without accompanying volume levels, this can sometimes be misleading.  The only way that I know of to gauge industry/sector strength WITH volume levels is through the analysis of ETF’s.  A couple years ago this was not possible, but as more traders/investors use ETF’s they become a much better tool for gauging the health of the market and seeing where the money is flowing (or not flowing).  Using the proprietary SelfInvestors Demand Indicator score which measures price and volume movements, I’m able to quickly see which sectors/industries are seeing the greatest inflows of cash.  For a detailed look at how I go about gauging sector/industry strength please see the following post: http://selfinvestors.com/si/industry_tracking/

* Current Leading Sectors/Industries (over last 30 trading days): 
Bonds, Commodities, Agriculture
                                          
* Current Lagging Sectors/Industries (over last 30 trading days): 
Semis, Retail, Internet, Tech, Utilities

* Today’s Market Moving Industries/Sectors (UP):
Bonds across the board

* Today’s Market Moving Industries/Sectors (DOWN):
REITs, Real Estate, Energy, Financials, International Real Estate

::: Stocks :::

The stocks section will be an area where I highlight one stock selected from a group of stocks moving up with volume well above average and most likely breaking out of a base or consolidation.  Sorry, no stock of the day today but you might like to have a look at the following Self Investors Leading Stocks that moved up with volume today and are above the 50 and 200 day moving averages.  These could be your next leaders once the market turns. 

Listed in order of total rank (fundamentals + technicals) with the best at the top.

Arena Resources (ARD)
Fossil (FOSL)
Vimpel Communications (VIP)
Astronics (ATRO)
Dolby Laboratories (DLB)
Dynamic Materials (BOOM)
Stanley (SXE)


Leading Stocks Defying the Market – Strong Demand, Above Moving Average

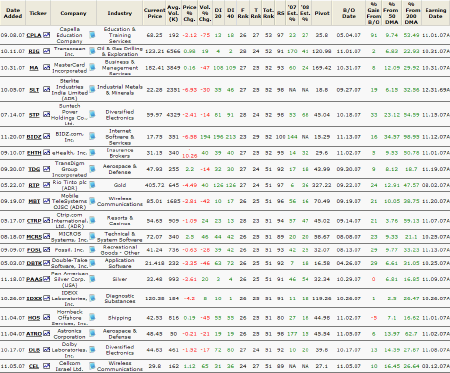
Today, I wanted to bring to you a screen of the SelfInvestors Breakout Tracker.  This particular screen filters out leading stocks that are showing significant demand and above both the 50 and 200 day moving averages.  They are holding up remarkably well despite a market correction and many of these will most likely lead the market once we begin to turn around. 

Please click the image below to see the top stocks sorted according to Total Rank (Fundamentals + Technicals).
This is absolutely not a buy list.  Please pay attention to the Pivot points listed in the table as well as the stocks in relation to their support levels and please do your own research. 

If you’d like to receive the full list in an excel download (about 60 stocks), you can register for a free Bronze membership to the left there and get access to the archives of all the excel screens.  I’ll be releasing this screen to members within the next several hours.

Goldman Sachs Citigroup Downgrade Spooks, But Nasdaq and S&P Hold for Now

So much for stabilization!  I had mentioned in the weekend report that the market was showing some signs of improvement and was beginning to stabilize around key support levels but Goldman Sachs took the legs out with a downgrade of Citigroup.  The downgrade in and of itself wasn’t enough to derail the market.  These kinds of downgrades are routine nowadays and news of banks coming out with statements about a couple billion in write downs is commonplace.  That much has been priced into the market for the most part.  What isn’t priced in is a prolonging of the credit crunch with a magnitude of double digit billions.  Clearly the Goldman Sachs estimate of 15 billion in write-offs in Citigroup over the next two quarters was a bit too much to stomach and spooked traders into heading for the exits today.  It certainly didn’t help that the National Association of Homebuilders confidence levels didn’t improve over October readings with a score of 19.  It’s the lowest level since this reading began in 1985, but on the bright side it didin’t drop over last month.  With 22 year record low levels and no drop over last month, perhaps this is a sign that the homebuilders are near a bottom. 


Get all the sentiment data here.

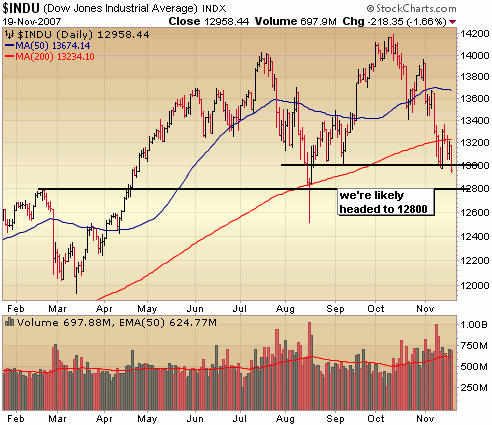
So now what?  Today’s move certainly puts a kink in the plans for a pre Thanksgiving rally but I still feel like we’re going to get a decent sized relief rally sustained over at least a few weeks very, very soon.  We just may need to see some more capitulation before that happens.  I discussed the key support levels in the S&P and Nasdaq in the weekend report which are are the last lines of defense before testing those August lows.  Both indices barely held at those levels today, but they did hold and volume levels didn’t indicate a tremendous amount of conviction behind today’s move.  That is encouraging but there is still significant downside risk tomomorrow.  The Dow took out and closed below 13,000 today and in all likilihood needs to retest the next level of support.  I failed to include this level of support at 12800, so wanted to highlight it here tonight.  It’s support at the February 07 highs and the close of that big August capitulation day and the last line of defense before testing the August lows.  I would imagine there is a very good chance of testing this level tomorrow but it probably depends on the housing numbers (starts, permits) as well as the FOMC minutes later in the day.  The HP quarter should help keep the market afloat at the open and the Fed will probably do everything it can to keep from roiling the market in its Fed minutes tomorrow, but it remains a dangerous market and one that can eat into capital in a hurry if you’re not careful!  I’ve been dabbling in a few of the strongest positions on the long side and profiting here and there but I will not get aggressive until we get a big day of accumulation or some kind of capitulation day.

::: Major Indices Performance – The Numbers :::

(Note: volume averages are based on the average over the past 50 days)
Data as of 4:00EST – End of Day November 19th 2007

Nasdaq: DOWN 1.66% today with volume 8% BELOW average
Nasdaq ETF (QQQQ) DOWN 1.15 %, volume 27% ABOVE average
Dow: DOWN 1.66%, with volume 10% ABOVE the average
Dow ETF (DIA): DOWN 1.4%, with volume 50% ABOVE the average
S&P ETF (SPY): DOWN 1.39%,  with volume 42% ABOVE the average
Russell Small Cap ETF (IWM): DOWN 1.98%, with volume 31% ABOVE the average

::: SelflInvestors Leading Stocks :::

The Self Investors Leading Stocks Index is comprised of stocks in the Breakout Tracker, which is a database of the fastest growing companies near a breakout or having already broken out of a base.  Leading stocks were hit much harder than the general market today but there wasn’t much conviction behind the selling.

Summary:

* Decliners led Advancers 264 to 38
* Advancers were up an average of 1.51% today, with volume 30% ABOVE average
* Decliners were down an average of 3.22% with volume 4% ABOVE average
* The total SI Leading Stocks Index was DOWN 2.62% today with volume 7% ABOVE average

::: Where’s the Money Flowing :::

Many investing websites provide leading industries based on price performance alone. However, without accompanying volume levels, this can sometimes be misleading.  The only way that I know of to gauge industry/sector strength WITH volume levels is through the analysis of ETF’s.  A couple years ago this was not possible, but as more traders/investors use ETF’s they become a much better tool for gauging the health of the market and seeing where the money is flowing (or not flowing).  Using the proprietary SelfInvestors Demand Indicator score which measures price and volume movements, I’m able to quickly see which sectors/industries are seeing the greatest inflows of cash.  For a detailed look at how I go about gauging sector/industry strength please see the following post: http://selfinvestors.com/si/industry_tracking/

* Current Leading Sectors/Industries (over last 30 trading days):  
Internet Infrastructure, Bonds, Agriculture
                                          
* Current Lagging Sectors/Industries (over last 30 trading days): 
Semis, Retail, Internet, Networking, Utilities

* Today’s Market Moving Industries/Sectors (UP):
Commodities, Bonds

* Today’s Market Moving Industries/Sectors (DOWN):
Home Construction, Basic Materials, Gold Miners, Retail, Financials

::: Stocks :::

The stocks section will be an area where I highlight one stock selected from a group of stocks moving up with volume well above average and most likely breaking out of a base or consolidation.  Sorry, short on time tonight so no stock of the day today.  However, you may like to take a look at these SelfInvestors Leading stocks the moved up with volume today and are above both the 50 day and 200 day moving averages.

Stocks are listed in order of total rank (fundamentals + technicals), with best at the top.

IntercontinentalExchange (ICE)
TransDigm Group (TDG)
Astronics (ATRO)
HMS Holdings (HMSY)
Interactive Intelligence (ININ)
Darling International (DAR)

Market Stabilizes, Holiday Rally In Sight; Hot IPO – CreditCards.com (CCRD)

Heading into the holiday Thanksgiving week, the market finds itself somewhat stabilized and consolidating around some key support levels (see below).  Expect to see trading around these levels at least until normal trading volumes resume the following week.  What I’ve found is that the trading in the first few days after a holiday break  are very revealing into what we can expect for the following few weeks. 

Overall, last week was a positive for bulls which kicked it off with a big price surge on Tuesday, but one that lacked significant conviction.  Essentially it was just a big dead cat bounce.  It didn’t follow through as expected but the following action should be viewed as bullish considering selling volume subsided in the face of doomsday comments and negative news out of Goldman Sachs, Wells Fargo and Barclays.  Remember at market bottoms, traders begin to shrug off news and focus on the positives.  I don’t think we’re 100% there just yet and we still need a confirmation day before I’m going to get a bit more aggressive on the long side, but given the technical action has improved and that we are heading into a historically bullish period for the stock market, the odds are good for a tradeable rally here for the next few weeks up to key resistance levels of the 50 day moving averages.

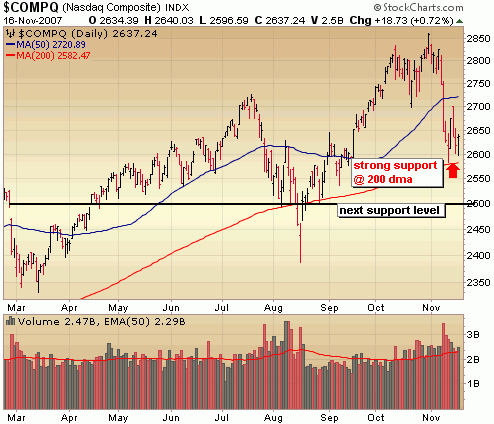
The Nasdaq is holding right at key support of its 200 day moving average and looking ready to rally up to resistance around the 50 day moving average.  If the Nasdaq does bust through the 200 dma, it’s likely headed down to test the next level of support around 2500.  I think we retrace some of these of November losses before that becomes a possibility.

The Dow is consolidating around support of 13000.  It really needs to get back above resistance of the 200 day moving average and hold there very soon.  The long it bounces around here, the greater the chance it ultimately fails and tests the August lows.

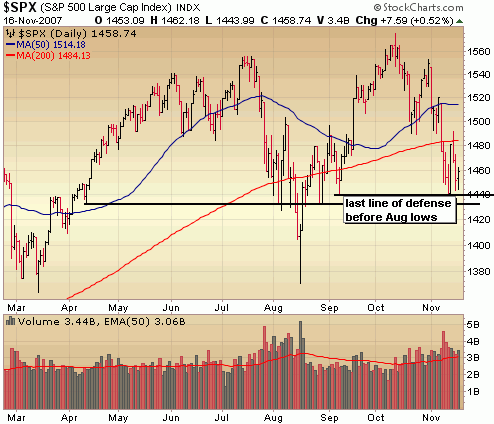
The S&P is stabilizing around key support of 1430 – 1440 but has much farther to go before even getting to that 200 day moving average and will have a much more difficult time of staging a big rally to get to the 50 day moving average.  Notice on Wednesday it busted through the 200 day but turned tail at the end of the day and closed below this resistance level.  The area around 1490 – 1500 would be an area where the S&P would most likely fail following any holiday rally.

NOTE: There will be not Weekly Market report next Sunday. 

::: Model Portfolio Update :::


Following the first weekly loss in many last week, the portfolio bounced back a bit this week with a small gain of .7%, bringing the year to date return to 24.6%.  I continue to tread very carefully in this volatile, unpredictable market and continue to sit on pile of cash (55%).  However, the market is showing signs of improving at least on a short term basis and we are heading into a period that is  typically strong so I’m going to begin adding just a bit more exposure to the long side down here.  I added to a long term core position last week and did the same this week, in addition to initiating a new Quick Strike Profit play which is up nearly 9% in just a few days.   I am looking to add two more positions next week, another core holding (long term play) most likely in tech as well as another QSP play (PGI might be a good candidate, a stock recently highlighted as Stock Trade of the Day).  There are currently no short positions in the portfolio.

Would you like to follow along with the SelfInvestors Model Portfolio each day with buy and sell alerts within minutes of the transaction?  It’s part of my Gold service which also includes all of the tracking tools (breakout stocks, IPO’s and ETF’s and unlimited personal support). 

::: Best/Worst Performers :::

– Top 10 Performing Industries For the Week –

1. Long Distance Carriers: 10.80%
2. Major Airlines: 9.35%
3. Recreational Goods: 9.30%
4. Internet Service Providers: 5.85%
5. Grocery Stores: 5.75%
6. Computer Based Systems: 5.05%
7. Regional Airlines:  4.75%
8. Dairy Products: 4.25%
9. Home Improvement Stores: 3.90%
10. Home Furnishings & Fixtures: 3.80%

– Top 10 Worst Performing Industries For the Week –

1. Mortgage Investment: -9.90%
2. Gold: -8.70%
3. Rental & Leasing Services: -7.00%
4. Silver: -6.55%
5. Heavy Construction: -6.30%
6. Industrial Equipment Wholesale: -6.25%
7. Industrial Metals & Minerals: -5.55%
8. Semiconductor – Memory Chips: -5.55%
9. Trucks & Other Vehicles: -5.30%
10. Trucking: -5.25%

– Top 5 Best Performing ETFs For the Week –
 
1. India Fund (IFN)  8.70%
2. Morgan Stanley India (IIF) 8.55%
3. MSCI India (INP) 6.00%
4. HLDRS Broadband (BDH) 4.55%
5. Chile Fund (CH) 3.90%

– Worst 5 Performing ETF’s –

1. Thai Fund (TTF) -6.85%
2. Asa Limited (ASA)  -6.80%
3. Market Vectors Gold Miners (GDX)  -6.70%
4. Ishares Silver (SLV) -6.20%
5. Power Shares Global Clean Energy (PBD)  -6.05%

:::  IPO’s Worth Watching for This Week :::

One very interesting IPO this week.  Are we entering another Internet bubble phase?  In some regards I believe so and you’ll begin to see many of the so called Web 2.0 properties go under within the next year or two, but also keep in mind that the internet has matured greatly since the late 90’s and many of these companies are making money and lots of it.  CreditCards.com is a company that has been doubling revenues and profits, so the days of internet properties with no profit going public are over.  I’m very interested to see how this stock does in the marketplace. 

1.  CreditCards.com (CCRD)  runs a Web site where visitors can sift through about 150 card offerings from more than 20 issuers. Users can sort by interest rate, rewards, cash back, airline credit, and other card criteria; by credit quality (excellent, good, fair); or by issuer. Card issuers pay CreditCards.com a fee based on either card applications or approvals. Trading set to begin on Tuesday.

::: Upcoming Economic Reports (11/19/07 – 11/23/07) :::

Monday:         Leading Indicators
Tuesday:       Building Permits, Housing Starts, FOMC Minutes
Wednesday: Initial Claims, Crude Inventories
Thursday:      None
Friday:            None

::: Upcoming Notable Earnings Reports :::

Monday:  TransDigm (TDG)

Tuesday:  Blue Coat Systems (BCSI), GameStop (GME), Home Inns & Hotels Management (HMIN), China Medical (CMED), Focus Media Holdings (FMCN), Mobile Telesystems (MBT)

Wednesday: Abercrombie & Fitch (ANF), Trina Solar (TSL)

::: In Case You Missed It – SelfInvestors Blog Entries of the Past Week :::

1. Do You Have a Millionaire Mind?

2. Trade of Day – Bullish Triangle Emerges in Premier Global Services (PGI)

3. SalesForce.com (CRM) Surges, China Stocks Still Getting Hit On Earnings

4. Breakout Stocks Review: Capital Preservation Key In Down Market

5.  Solar Still Shines – Suntech Power (STP) Surges After Earnings

6.  Three S Bio (SSRX) Still Looking Bullish After Earnings

7. This Dead Cat Made of Rubber From China; Stock of Day – Cellcom Israel (CEL)

8.  Cramer Has a Credibility Problem

9.  Quick Strike Profit Plays Video Review – Entries & Exits
Sorry, but this post is available to Platinum & Gold Members only.

Warren Buffett Wrong on Estate Taxes

The hotly debated estate tax issue has been in the news again recently after the Senate Finance Committee held a hearing where Chairman and Montana Democrat Max Baucus said he supports ending the estate tax along with the Iowa Republican Senator Charles Grassley who said, ""The estate tax is unjust. … Death should not be a taxable event."

Warrent Buffett weighed in on the other side saying, "In a country that prides itself on equality of opportunity, it’s becoming anything but that as the gap between the super-rich and the middle class is widening."

Below is an editorial written by Dan Ferris of DailyWealth and republished here with permission.  I completely agree with the Senators and Dan Ferris that a repeal of the estate tax is in order.  Now Buffett is obviously a smart guy who has amassed a fortune but he’s wrong on this.  In my opinion this is not an issue of equality but rather an issue of the best way to distribute wealth.  Bottom line.  Who would you rather distribute wealth?  The government or the wealthy?  With all the inefficiencies of goverment, the waste, the fraud… is this really a very difficult decision?  The United States in terms of percentage of GDP gives back more to local charities and world programs than any other nation in the world.  With a repeal of the estate tax that kind of giving will only increase.

Consider this.  Suppose the estate tax was repealed and Warren Buffett passed on all of his wealth to his children (what’s ever left over after his charitable donation to the Gates foundation).  Now his children will be given the same opportunity to direct this excessive wealth into charities that they believe strongly in just as their father did.  The alternative is allowing the goverment to decide where to allocate this wealth. 

Dan makes a great point in saying "It’s interesting to note that Buffett advocates the estate tax, and yet has deprived the government of its fair share of his own national resources by giving some $37 billion to the Bill & Melinda Gates Foundation. The shares are worth more now, too, so the taxman is further deprived as the market bids up Berkshire’s stock."

Does Warren Buffett not trust that his own children will continue his charitable ways?  Does he not trust that your children will?  What do you think?

Why Warren Buffett Is Dead Wrong About the Estate Tax
By Dan Ferris

I saw the following recently in an article at CNNMoney.com:

"’Without the estate tax, you in effect will have an aristocracy of wealth, which means you pass down the ability to command the resources of the nation based on heredity rather than merit,’ Warren Buffett told the New York Times in 2001. ‘[Repeal would be like] choosing the 2020 Olympic team by picking the eldest sons of the gold-medal winners in the 2000 Olympics.’"

Warren Buffett, one of the world’s richest men, is referring to the practice of leveling large taxes on your wealth after you die. Of course, the problem with Buffett’s statement is that "the resources of the nation" don’t belong to "the nation" at all. You own your wealth or, at least, you’re supposed to own it. I guess if you have a billion dollars, you think you get to say how "the nation" ought to be run. 

The wrong-headed idea that permeates our culture and allows for Buffett to advocate estate taxes is the idea of "giving back to the community." This idea is a nonstarter because there was no taking in the first place. You get rich by offering value for value. You get rich by trading, not taking. "Taking" is what the government did to Suzette Kelo when it condemned her house so Pfizer could build a parking lot (a crime that was upheld by that bastion of justice, the U.S. Supreme Court, in Kelo v. City of New London). THAT is taking. 

But traders have no need to give back anything, unless for reasons of recission due to the use of fraud or force, unless they’re guilty of a crime. Earning wealth is not a crime… at least, it’s not supposed to be one. I heard Buffett once say that he always planned to give his money "back to society." Never mind that nothing was "taken" from any "society," only wealth that was created and trading that was done. Why does he feel so guilty?

If Buffett needs to imagine a future that doesn’t rankle his idea of fairness, maybe he should remember that incapable allocators of wealth will lose their wealth to other more capable allocators. So if the inheritors aren’t the Olympians he says we’re making them out to be, the market will take care of that.

Like a man looking for a good time on a small budget, money goes where it’s treated best. People who inherit wealth and don’t treat it right will lose it. But to be quite accurate, that’s off topic. Even if the inheritors of wealth don’t lose it, it doesn’t matter. The most important point, the one Buffett doesn’t acknowledge, is that the wealth is theirs to lose or keep as they may. It absolutely, positively does not belong to "society."

It’s also a mistake to suggest that, by honoring property rights and allowing people to keep their wealth, we are somehow choosing some sort of future "Olympic team." Not true at all. We are simply acknowledging a man’s right to dispose of his property as he sees fit. There can be no such thing as the "aristocracy of wealth" Buffett fears.

The inheritable wealth Buffett wants to destroy through taxation (a euphemism for "theft") must be created and earned. An aristocracy, on the other hand, is the ruling class in a monarchy. All of the monarchy’s wealth is seized, conquered, and redistributed wealth. The term, "aristocracy of wealth," is like "military intelligence." It’s self-contradictory. That the aristocracy passes its wealth from generation to generation is a funny thing to worry about, too. The aristocracy eventually has to sell it all off to keep out of the poor house. You can’t live on unproductive inherited wealth forever, anymore than you can live on borrowed money forever. To paraphrase Robert Louis Stevenson, those who attempt to live on unproductive inherited wealth, sooner or later, sit down to a banquet of consequences.

It’s interesting to note that Buffett advocates the estate tax, and yet has deprived the government of its fair share of his own national resources by giving some $37 billion to the Bill & Melinda Gates Foundation. The shares are worth more now, too, so the taxman is further deprived as the market bids up Berkshire’s stock. 

Isn’t Buffett afraid that Bill and Melinda already have much more than their fair share of national resources to command? Isn’t he committing the wrong he alleges will be righted by the estate tax? Who cares about the Gates’ superior ability to command the resources? The playing field is decidedly other unlevel already, yet Buffett insists in unleveling it some more. Seems like Buffett thinks your estate ought to be taxed, because you don’t know what you’re doing.

According to Buffett, your children will be better people if we just steal your money before you can give it to them. They’ll have to work harder.

Buffett thinks the estate tax creates a level playing field. Ah, the level playing field, the illusive goal of the society builders and master planners. The only trouble with the level playing field is that you can’t ever have one, because it means penalizing people for their ability, for their success. It means cutting the tops off the maple trees so they don’t block the sunlight for the oak trees (or are oaks taller than maples? I don’t know).

And if we consistently chopped the tops off all the tall trees just for being tall, then the Buffetts of the world would never have the chance to amass so much to give back to society. At that point, he’d be society, waiting for someone to give him something back.

I wonder how he’d like that?

Good investing,

Dan Ferris

Trade of Day – Bullish Triangle Emerges in Premier Global Services (PGI)

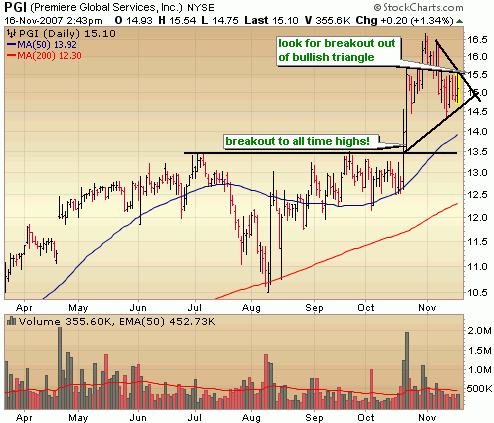
It’s been quite awhile since I’ve posted a trade of the day here .. been a very busy few weeks.  Today, I wanted to bring to you a great opportunity emerging in PGI.  The stock broke out of a 6 month base with near record volume to a new all time high on October 19th and ran up over 20% in just a matter of days.  Since that time, the stock has digested those gains in a very bullish manner, with tight price action and diminishing volume.  It’s carving out a triangle pattern which happens to be one of my favorite patterns and is looking ready to bust out at any time.  It probably just needs the wind of another dead cat bounce rally at its back to get going out of this formation.  Once of the better looking charts out there right now. 

Full Disclosure/Disclaimer: The stock of the day is by no means a buy recommendation.  Please do your own research and make a personal decision based on your own tolerance for risk.  I currently do own a position in Premier (PGI)