All posts by Tate Dwinnell

Technicals Improving, But Significant Risk Remains

The Fed induced capitulation gave way to a quick ramp up in the market off an oversold bottom but it didn’t long for traders to lock in profits as poor economic news poured in.  Just as the conviction behind buying levels reveals much about the health of the overall market, the conviction behind the selling does the same. 

The technical action last week was encouraging.  Some fear crept back into the market on Tuesday’s nearly 400 point Dow plunge, but as I mentioned in the after market report that day, there was a divergence between price and volume.  The selling intensity was not characteristic of institutions dumping positions left and right.  To me, it looked like healthy selling following, a V like spike up off the bottom.  Notice that over the next 3 days, the market stopped the bleeding almost immediately despite a significant futures sell off following a poor Cisco outlook.  That action on Thursday was a good indication that maybe buyers are beginning to return.  I remember reading all the doom and gloom regarding Cisco on some of the discussion boards with calls for a drop below 20.   Cisco closed in the green for the day with a massive day of capitulation.   It was significant for Cisco, for tech and the Nasdaq in general. 

Let’s take a quick look at the charts….

The Nasdaq looks mighty close to bottoming, but if in fact that is the case we need to get some big buying follow through soon.  That revesal off the lows on Thursday with heavy volume was in my mind a telling sign that bulls are resuming some control at least in the short term.  I do believe that the odds of a rally here are significantly greater than another leg down below key support of 2200 but much risk remains.  This is still a headline driven market with no leadership.  Keep that in mind when making trading decisions.  If the Nasdaq can take out 2425, look for a run to 2500.
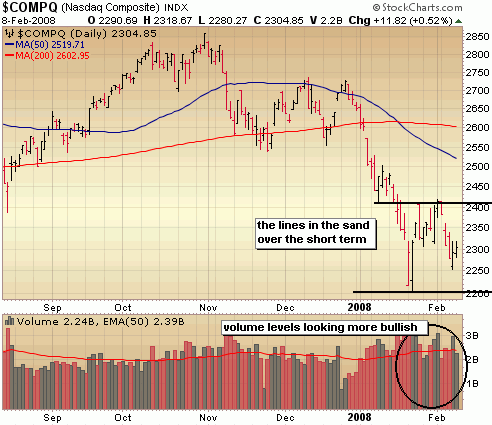
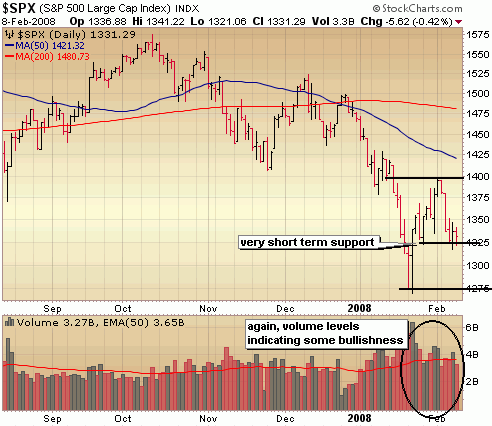
I like the healthy retracement of the initial surge off the bottom.  Notice that buy volume has been overshadowing sell volume.  There is short term support in the S&P at 1325 so taking out that level and closing below that level would indicate that a test of the lows  around 1275 are likely.  Again, I think big buying needs to happen quickly (sometime next week) or testing the lows of this correction (or worse) becomes much more likely.
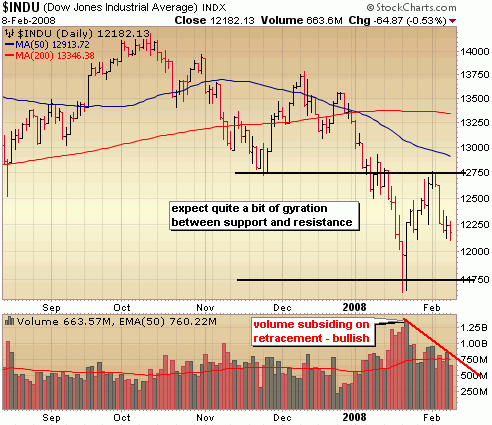
You see the Dow is about at the half way point of a retracement as well and could very well yo yo back and forth between support and resistance as the market sorts out a bottom down here.  Volume levels do indicate more bullishness, but institutions need to step in and start doing some buying soon or we’re testing the lows around 11500 – 11750.
 ::: Model Portfolio :::

** This section will now appear as a separate report to be published on most Wednesdays

The Self Investors Model Portolio wrapped up 2007 with a 30.2% gain.  Would you like to receive buy and sell alerts within minutes (NEW! now get them via instant messaging in near real time) of each transaction in the portfolio?  You can receive these along with ALL of the tracking tools and reports with the very popular Gold membership.  Don’t delay, get started today and join me for many more highly profitable months here at SelfInvestors.com.

::: Best/Worst Performers :::

– Top 10 Performing Industries For the Week –

1. Wholesale – Other: 2.75%
2. Medical Laboratories & Research: 2.55%
3. Medical Practitioners: 2.30%
4. Home Health Care: 2.05%
5. Drug Related Products: 1.50%
6. Drug Delivery: 1.10%
7. Entertainment Diversified:  .85%
8. Medical Instruments & Supplies: .65%
9. Medical Equipment Wholesale: .35%
10. Independent Oil & Gas: .25%

– Top 10 Worst Performing Industries For the Week –

1. Semiconductor – Memory Chips: -15.35%
2. Residential Construction: -14.45%
3. Credit Services: -11.05%
4. Recreational Vehicles: -10.70%
5. Banks – SE: -10.25%
6. Toy & Hobby Stores: -10.05%
7. Heavy Construction: -9.90%
8. Cement: -9.55%
9. Home Furnishing Stores: -9.20%
10. Farm Products: -9.10%

– Top 5 Best Performing ETFs For the Week –
 
1. US Natural Gas (UNG)  7.50%
2. Powershares Agriculture (DBA) 4.80%
3. Powershares Commodity (DBC) 4.70%
4. US Oil (USO) 3.45%
5. Ishares Silver (SLV) 2.45%

– Worst 5 Performing ETF’s –

1. SPDR Homebuilders (XHB) -14.60%
2. Ishares Home Construction (ITB) -12.60%
3. 
Chile Fund (CH) -10.90%
4. Market Vectors Global Alernative Energy (GEX)  -10.10%
5. iPath
India (INP) -9.85%

:::  IPO’s Worth Watching for This Week :::

This section will now appear as a separate post on Mondays.

While 2008 should be a much slower year for IPO’s considering the deterioration of the market, there will continue to be some good companies coming to market here and there.  I’ll be highlighting the best IPO’s every Monday.

::: Upcoming Economic Reports (2/11/2008– 2/15/2008) :::

Monday:         None
Tuesday:       Treasury Budget
Wednesday:  Retail Sales, Business Inventories, Crude Inventories
Thursday:      Trade Balance, Initial Claims
Friday:            Export/Import Prices, Capacity Utilization, Industrial Production,
Mich. Sentiment

::: Earnings I’m Watching This Week :::

Monday:
Qiagen (QGEN)

Tuesday:
Rick’s Cabaret (RICK)

Wednesday:
Nvidia (NVDA), First Solar (FSLR), The Navigators (NAVG), Baidu.com (BIDU), Healthcare Services Group (HCSG), Genzyme (GENZ), Rio Tinto (RTP), Millicom Intl (MICC)

Thursday:
Bucyrus (BUCY), Capella Education (CPLA), Chipotle Mexican Grill (CMG), Strayer Education (STRA), Hittite Microwave (HITT)

Friday:
Abercrombie and Fitch (ANF), Diana Shipping (DSX), Yingli Green Energy (YGE)

::: In Case You Missed It – SelfInvestors Blog Entries of the Past Week :::

1. Not So Super Tuesday But Selling Constructive

2. Solera Holdings (SLH) One To Watch After Strong Earnings

3. Model Portfolio Update: Big Tech Is Killing Me

4. WMS Industries (WMS) Breaks out to All Time Highs On Earnings

5. China Oil Perspective – CNOOC (CEO), Petrochina (PTR) & China Petroleum (SNP)

6. Vanguard Mutual Funds Tops in 07

Yahoo Rejects Microsoft, Google Wins

We’ll see books  written about this epic battle of  the  3 tech behemoths – Microsoft, Yahoo and Google.  Another chapter was written this morning as Yahoo defiantly rejected Microsoft’s bid indicating it "massively undervalued" the company and that the company isn’t likely to consider an offer below 40.  There has been talk of Yahoo partnering with Google and using their advertising platform but I don’t see how they’re going to get around the regulators on that one.  Google CEO Eric Schmidt whined about a Yahoo/Microsoft merge as monopolistic… I’d have to say Yahoo + Google in any capacity is more so.  Sure Yahoo retains its pride with this rejection and stirs some excitement amongst employees in their battle with the much hated Microsoft, but is it a good business decision?  Time will tell, but I don’t think Yahoo is in any position to playing chicken with Ballmer.  A couple things are certain though.  This fight just got a whole lot more interesting and whichever way this plays out Google benefits big time.  Long Google and looking to get longer.

The Seattle Times has a good rundown of what might happen next.

Vanguard Mutual Funds Tops in 07

vanguard mutual fundsAccording to Reuters, Vanguard Mutual Funds pulled in the most money to its stock and bonds mutual funds in 2007, eclipsing American Funds which held the top spot since 2002.  Vanguard saw net inflows of 76.2 billion last year compared to 42.7 billion in 2006 as investors poured money into its safer money market accounts and ETF’s.  According to the Financial Times, ETF’s provided a major boost with assets growing from 23 to 42 billion last year.  It expects to add more ETF’s this year after adding 10 new ones last year and is seeking regulatory for actively traded ETF’s (a subject for another post). 

The biggest percentage increase of inflows were to State Street Global Advisors, a unit of State Street Corp (STT) with a huge jump to 49.2 billion in assets from just 3.4 billion the year before mostly due to the popularity of its growing list of ETF offerings.  Wow!  No wonder STT is trading near all time highs. 

I personally would like to see companies close out more and more of their most unpopular ETF offerings and come up with more unique offerings in niche segments such as Platinum or Solar (I know PBW comes close).. I would guess we’ll see these ETF’s soon.  How many big cap, or mid cap or global diversified funds do we need!  It’s getting ridiculous and this industry is due for a shakeout.

WMS Industries (WMS) Breaks out to All Time Highs On Earnings

Today’s SelfInvestors Leading Stocks Moving on Earnings

getting this out too late again.. one of those weeks

UP

• Watson & Wyatt (WW) Business & Management Servicees, fundamental rank [25/30],  up 11%, working on the right side of new base

• WMS Industries (WMS) Diversified Electronics, fundamental rank [25/30],  up 9%, breaking out of a base on base with heavy volume to new all time highs – these kinds of moves are few and far in between these days!  One to watch

• Alcon (ACL) Medical Instruments & Supplies, fundamental rank [25/30],  up 6%, nice high volume gap up off the 200 day moving average and carving out right side of base with a breakout above 155

DOWN

no leading stocks moving down on earnings with volume today

Model Portfolio Update: Big Tech Is Killing Me

It’s been one of the worst starts to a year ever for the market and it certainly caught me off guard a bit.  If I thought I could coast a bit for a couple weeks after a somewhat grueling 2007, I was sorely mistaken.  Admittedly I haven’t been as prepared as I should have been while dealing with a move and a constant cold and it’s resulted in being out of synch with the market.  It’s been one of the worst starts to a year for me.

I’m getting the feel back though and beginning to trade more in synch with the market but man these big cap techs are killing me!  I managed to dump most of my Google near the top but didn’t do the same with my Cisco or Microsoft.  It’s clear that whenever I attempt to deviate from the strategy that has been successful for me over the years (trading momentum) and move to more of a buy and hold strategy in "good companies" that are good long term holds, my performance suffers.  It happened in 2006 with a purchase of Yahoo and again to begin this year.  It looks like Cisco is going to get crushed yet again after the bell, so I’ll be digging out of larger hole from tomorrow on.

Despite Cisco and Microsoft being significant portions of the portfolio, I’m still ahead of the S&P and well ahead of the down and out Nasdaq with a loss of 9.2% this year (compared to a 14% loss for the Nasdaq – yowza!).  Yes, it’s unacceptable but at the same time I recognize I’ll have bad months and great months and that by the end of the year, continuing with my strategy, sticking to my rules and remaining confident WILL result in great returns once again.  It’s a long year and I’m not concerned. 

I’ve initiated several new shorts in the past few days, all of which (except for one) are profitable, but will cover and lock in gains quickly as we get closer to the lows of this correction.  Today, my short in DR Horton (DHI) was covered for a quick 10% gain ahead of its earnings report tomorrow morning but I’m still holding my Toll Brothers (TOL) short and think I can squeeze a few more percent out of that one over the next few days, particularly if DHI misses expectations by a wide margin in the morning.  Soon, it will be time to start thinking about the long side but it’s still too early.  I put on a very small position in COIN after it broke out of a bullish triangle formation yesterday, but closed it quickly today after yet another reversal off the highs.  There just isn’t much working on the long side right now and until new leadership emerges I’m not willing to get aggressive.

The biggest mistake that traders make is trying to make up for losses by taking on even more risk.  They begin averaging down, taking on excessive risk or trading penny stocks to try and recoup losses quickly and regain their pride.  If you are doing that now, STOP!!  Think about why you have the losses you do.  Did you get into a buy and hold mentality in "good" companies like Apple, Baidu, Google, Garmin, Research in Motion, etc after getting in near the top?  Did you not cut losses quickly?  Were you bottom fishing?  Rather than trying to make it all back in one trade, get more conservative and take this time to learn what you can do better next time.  There will be ample opportunity to recoup the losses and make extraordinary games, so preserve capital and learn, learn, learn.

Solera Holdings (SLH) One To Watch After Strong Earnings

Today’s SelfInvestors Leading Stocks Moving on Earnings

getting this out too late again.. one of those weeks

UP

• Forrester Research (FORR) Research Services, fundamental rank [24/30],  up 13%, making a move in the right side of a long base – one to watch for a base breakout

• Solera Holdings (SLH) Application Software, fundamental rank [23/30],  up 5%, very nice trading action over the past few months and carving out new base – look for a handle then a breakout

DOWN

• Double-Take Software (DBTK)  Application Software, fundamental rank [26/30],  down 26%, adios – won’t be back anytime soon after a disappointing quarter

• The Advisory Board (ABCO) Research Services, fundamental rank [26/30],  down 9%, took out 200 dma and sets up beginning of a new base carving period.

• National Oilwell Varco (NOV) Industrial Equipment Wholesale, fundamental rank [25/30],  down 7%, taking out 200 dma once again and a test of the lows around 50 highly likely

Not So Super Tuesday But Selling Constructive

No, it wasn’t a super tuesday for the market today for bulls, but in terms of finding a bottom it was VERY constructive.  Huh? (more on this below).  The selling started early with the ISM report which showed contraction for the first time in a few years and provided a bit of ammunition for recession forecasters.  With Merrill Lynch predicting another inter-meeting Fed rate cut, maybe we’ll also see Jim Cramer making another irresponsible, irrational exclamation of a market soaring to new heights after another surprise Fed rate cut.  It’s hard to say, but one thing is for sure – if you make investment decisions based on his wild, "sure thing" predictions you will lose and lose big.  I really do want to quit picking on the guy, but he just makes it so difficult.  He needs to be held accountable.

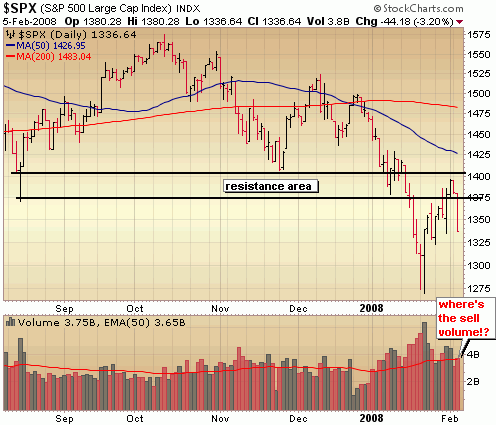
The magnitude of the move down today was a bit surprising, but the move down in and of itself was not.  Carving out a bottom after a major sell off is a long process with many fits and starts.  The Fed induced rally off the bottom led by financials and homebuilders had just simply run out of steam with traders looking for an excuse to take profits into short term overbought conditions.  Today’s selling, believe it or not was positive!  It’s hard to see that if you were too aggressive long, but looking at the sell volume reveals there was little conviction behind the move.  That’s what I call constructive selling!  Let’s have a look.

It was easy to get wrapped up in the headlines today – Dow down 370, ISM Index worst in 5 years.. and think another melt down was on the horizon.  I didn’t see it that way today.  Just take a look at the volume levels today in the S&P.  The selling volume was average!  This looked like big profit taking and healthy consolidation of a V like run up off the bottom to me.  A healthy bottom always begins with constructive selling and today, while large in magnitude, could be categorized as just that.  I’ve said it several times here in the past few weeks and I’ll say it again – until we begin to see new leadership emerge in this market, we are not at a bottom.  We could still very well test the lows of this correction.  If you’re not a shorter term trader, you should STILL be out of the market.


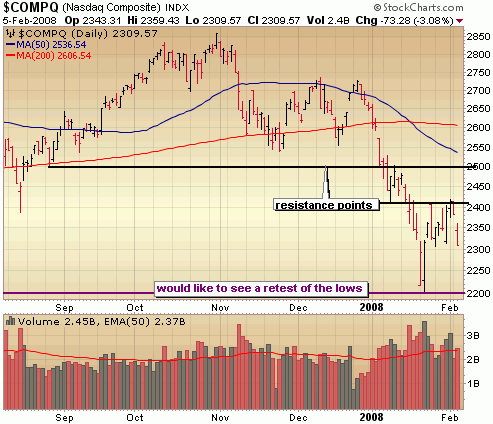
I didn’t note in the graphic below but note that again sell volume didn’t correlate with the big sell off today.  A test of the lows would be healthy and go a long way in helping to repair the recent technical damage and shake out a few more sellers… and hopefully begin the process of producing new leadership in this market.

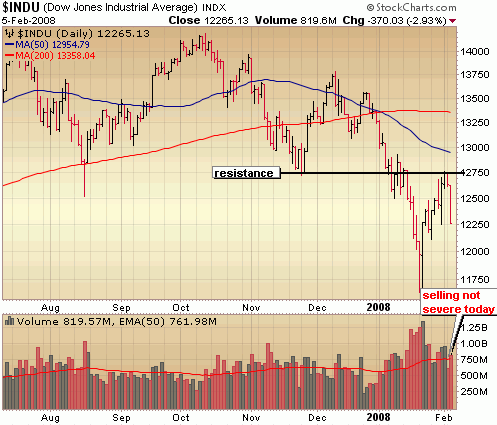
Same thing for the Dow.  The sharp, V like move off the bottom simply wasn’t sustainable and the ISM report this morning just provided an excuse to take profits en masse.

::: Major Indices Performance – The Numbers :::

(Note: volume averages are based on the average over the past 50 days)
Data as of 4:00EST – End of Day February 5th, 2008

Nasdaq: DOWN 3.08% today with volume 1% ABOVE average
Nasdaq ETF (QQQQ) DOWN 2.85%, volume 11% ABOVE average
Dow: DOWN 2.93%, with volume 8% ABOVE the average
Dow ETF (DIA): DOWN 2.44%, with volume 2% BELOW the average
S&P ETF (SPY): DOWN 2.68%,  with volume 27% ABOVE the average
Russell Small Cap ETF (IWM): DOWN 2.56%, with volume 31% ABOVE the average

::: SelflInvestors Leading Stocks :::

The Self Investors Leading Stocks Index is comprised of stocks in the Breakout Tracker, which is a database of the fastest growing companies near a breakout or having already broken out of a base.  There continues to be no leadership in this market and that was reflected today with Self Investors Leading Stocks down significantly more than the general market.

Summary:

* Decliners led Advancers 239 to 16
* Advancers were up an average of 1.62% today, with volume 34% ABOVE average
* Decliners were down an average of 4.17% with volume 8% above the average
* The total SI Leading Stocks Index was DOWN 3.8% today with volume 9% ABOVE average

::: Where’s the Money Flowing :::

Many investing websites provide leading industries based on price performance alone. However, without accompanying volume levels, this can sometimes be misleading.  The only way that I know of to gauge industry/sector strength WITH volume levels is through the analysis of ETF’s.  A couple years ago this was not possible, but as more traders/investors use ETF’s they become a much better tool for gauging the health of the market and seeing where the money is flowing (or not flowing).  Using the proprietary SelfInvestors Demand Indicator score which measures price and volume movements, I’m able to quickly see which sectors/industries are seeing the greatest inflows of cash.  For a detailed look at how I go about gauging sector/industry strength please see the following post: http://selfinvestors.com/si/industry_tracking/

* Current Leading Sectors/Industries (over last 30 trading days):  
Agriculture, Commodities, Gold, Bonds
                                          
* Current Lagging Sectors/Industries (over last 30 trading days): 
Global Energy, Utilities, Aerospace/Defense, Broadband, Clean Energy

* Today’s Market Moving Industries/Sectors (UP):
None

* Today’s Market Moving Industries/Sectors (DOWN):
Broker/Dealers, Nuclear Energy, Telecom, Energy, Financials

::: Stocks :::

The stocks section will be an area where I highlight one stock selected from a group of stocks moving up with volume well above average and most likely breaking out of a base or consolidation.  No major moves in leading stocks to speak of today.

Intuitive Surgical (ISRG), Flowserve (FLS), Dolby (DLB) & Micros (MCRS) Into New Bases

Today’s SelfInvestors Leading Stocks Moving on Earnings

getting this out too late again.. one of those weeks

UP

• Intuitive Surgical (ISRG) Medical Appliances & Equipment, fundamental rank [24/30],  up 20%, gapped up above the 50 day moving average which should be the beginnings of a new healthy base

• Flowserve (FLS) Diversified Electronics, fundamental rank [24/30],  up 17%, gapped up above the 50 day moving average with record volume kicking off the right side of a new base

• Dolby Laboratories (DLB) Diversified Electronics, fundamental rank [27/30],  up 14%, again, gapped up above the 50 day moving average with record volume kicking off the right side of a new base

• Micros Systems (MCRS) Technical & System Software, fundamental rank [26/30],  up 9%, lots of new bases forming and here’s another one, albeit an ugly V one

DOWN

• Actuate (ACTU)  Application Software, fundamental rank [25/30],  down 25%, adios

• Omnicell (OMCL) Computer Based Systems, fundamental rank [24/30],  down 22%, adios to you as well

Take a look at the charts of both these stocks.  Notice how poor earnings were basically forecasted in the charts?  Someone knew something, somebody always does.  Nobody had any business being in these stocks ahead of earnings period. 

• Google (GOOG) Internet Info Providers, fundamental rank [28/30],  down 8%, in a couple years people will be kicking themselves for not buying Google around 500.  What an opportunity for the long term investor.

• Stanley (SXE) Business & Management Services, fundamental rank [23/30],  down 8%, in process of finding bottom of new base, nice bounce off 200 day moving average; actually reported a great quarter and may not drop too much lower than lows of today

Rate Cut Rollercoaster; Jobs Data Awaits

If I were a bear I’d probably bury my cash in a hole (can bears bury things?) and hibernate for 3 months, but I’m neither bear nor bull, choosing to be objective through chart analysis.  Lately..  ‘er should I say for  the past year, that hasn’t been so easy.  There is a reason why I’ve been recommending for the past few months that most investors stay out of this market for now.  Volatility, irrationality, manipulation, rumor, Fed/government bailouts, blah, blah.. and that thing called a bear market.

Today, I thought I was clever.. maybe clever isn’t the word.. but pursuing opportunity in what I thought was sound technical analysis.  It was sound technical analysis, really it was.  Throw that out the window.  Home builders were overbought (up 70 – 80% in 3 weeks!, many were hitting resistance and showing distribution on the daily.  Easy short right?  Wrong.  They defied gravity today and rocketed through the roof with heavy volume, burying me in debris.  I have never. .. Let me repeat. . I have never been as in disbelief as I was watching those builders today.  I know..fed cut.. stimulus package…. how could I short the builders in this environment?  Trusting the technicals usually treats me well, but they won’t always and they didn’t today.  I was reminded of one my rules which I broke today.  Don’t make significant trading decisions on the day of or the day after a Fed announcement.   Tomorrow is a new day.. perhaps a day when the technicals will prevail and I obey my rules.  Discipline, discipline, discipline.

For the second day in a row it was a vomit inducing roller coaster ride.  250 point swing yesterday, 400 points today.  Yesterday signaled distribution, today signaled accumulation.  It continues to be difficult to know which way to trade but one thing is for sure.  Anything affected by rate cuts – financials, home builders and gold, have been soaring.  Not much else is working and there continues to be no leadership.  Yes, cash is still the best place to be for most.  Tomorrow could be another wild ride as the market (for some reason) seems to trade big off the unemployment reports.  Strap on the belts and enjoy the show from the sidelines.  Now where did I put that gin and pepto cocktail.

::: Major Indices Performance – The Numbers :::

(Note: volume averages are based on the average over the past 50 days)
Data as of 4:00EST – End of Day January 31st  2008

Nasdaq: UP 1.74% today with volume 19% ABOVE average
Nasdaq ETF (QQQQ) UP 1.71%, volume 41% ABOVE average
Dow: UP 1.67%, with volume 25% ABOVE the average
Dow ETF (DIA): UP 1.79%, with volume 62% ABOVE the average
S&P ETF (SPY): UP 1.82%,  with volume 48% ABOVE the average
Russell Small Cap ETF (IWM): UP 2.48%, with volume 20% ABOVE the average

::: SelflInvestors Leading Stocks :::

The Self Investors Leading Stocks Index is comprised of stocks in the Breakout Tracker, which is a database of the fastest growing companies near a breakout or having already broken out of a base.  With beaten down stocks leading the way in this bear market rally, leading stocks didn’t fare all that well today, significantly lagging the general market

Summary:

* Advancers led Decliners 187 to 69
* Advancers were up an average of 2.79% today, with volume 24% ABOVE average
* Decliners were down an average of 2.51% with volume 68% above the average
* The total SI Leading Stocks Index was UP 1.36% today with volume 35% ABOVE average

::: Where’s the Money Flowing :::

Many investing websites provide leading industries based on price performance alone. However, without accompanying volume levels, this can sometimes be misleading.  The only way that I know of to gauge industry/sector strength WITH volume levels is through the analysis of ETF’s.  A couple years ago this was not possible, but as more traders/investors use ETF’s they become a much better tool for gauging the health of the market and seeing where the money is flowing (or not flowing).  Using the proprietary SelfInvestors Demand Indicator score which measures price and volume movements, I’m able to quickly see which sectors/industries are seeing the greatest inflows of cash.  For a detailed look at how I go about gauging sector/industry strength please see the following post: http://selfinvestors.com/si/industry_tracking/

* Current Leading Sectors/Industries (over last 30 trading days):  
Agriculture, Gold Miners, Commodities, Gold, Bonds
                                          
* Current Lagging Sectors/Industries (over last 30 trading days): 
Energy, Utilities, Aerospace/Defense, Broadband, Clean Energy

* Today’s Market Moving Industries/Sectors (UP):
Homebuilders, Retail, Cosumer Discretionary, Financial

* Today’s Market Moving Industries/Sectors (DOWN):
Oil Services, Energy

::: Stocks :::

The stocks section will be an area where I highlight one stock selected from a group of stocks moving up with volume well above average and most likely breaking out of a base or consolidation.  There just aren’t many (should say any) leading stocks breaking out to new highs or on the verge of doing so, but here’s a short list of leading stocks that moved up with volume today and are above both moving averages. 

In order of fundamental rank:

Mastercard (MA)
CyberSource (CYBS)
Helmerich & Payne (HP)
Allergan (AGN)
Investment Technology (ITG)
Green Mountain Coffee Roasters (GMCR)
Greif (GEF)