Just last Friday, the market wasn’t able to continue the trend of shrugging off the bad news as the big GE earnings miss had the bears growling and indices plummeting below their 50 day moving averages. The move was enough to cast doubt on a big spring rally, but the bulls would not be denied today
It isn’t about the numbers. It’s about expectations… and Intel, Wells Fargo and JPMorgan all beat much lowered expectations and were catalysts in kicking off the morning in the green. Not even a gloomy outlook from the Fed or record oil prices (yet again) could keep this market down as the indices once again threw caution to the wind and and closed strong near the highs of the day.
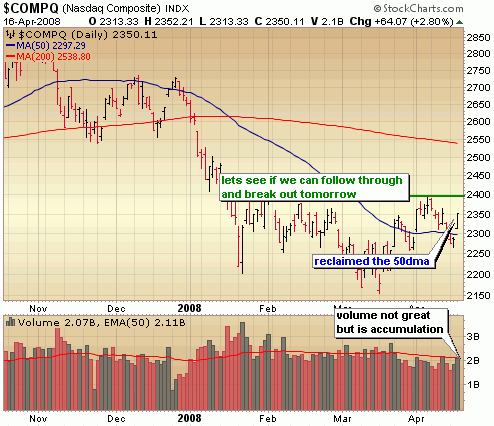
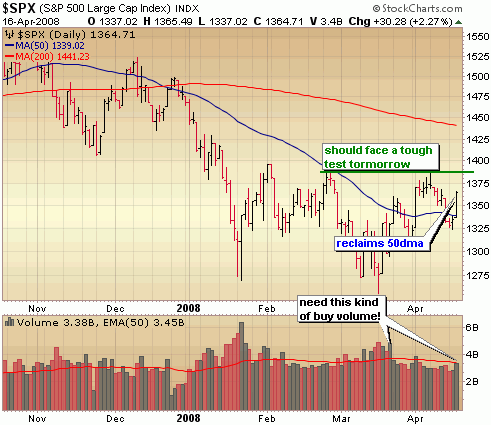
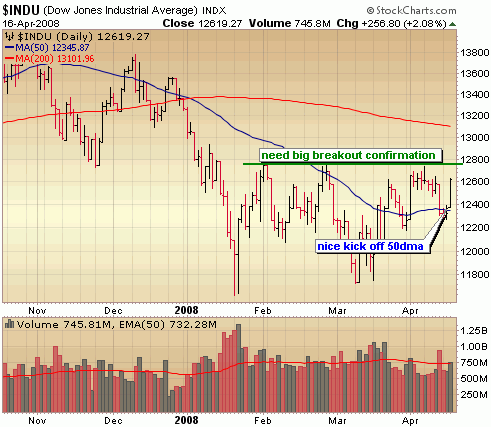
Today’s move neutralizes the bearish move of last Friday and puts the indices back in contention for a spring rally as the Nasdaq, Dow and S&P500 all reclaimed support of the 50 day moving average with a tick up in volume. Volume certainly could have been better with such a big price gain but if we can follow through tomorrow or Friday with better volume, we just might be able to bust through those resistance levels.
Let’s have a look at the indices.
The Nasdaq gapped up above resistance of the 50 day moving average which should prove to be an important support level in the coming weeks. Notice that volume just came in at around average but was significantly higher than yesterday so technically a day of accumulation and certainly a considerably bullish move. Nasdaq 2400 is the next target and a significant source of resistance. A breakout from there would be very bullish. Perhaps strong results out of IBM and Ebay can be the catalyst for tomorrow.
The S&P also surged back above the 50 day moving average with average volume. We could face big resistance around 1385 tomorrow.
The Dow looks poised to test important resistance levels tomorrow. We need to breakout from the channel above the area around 12800.
::: Major Indices Performance – The Numbers :::
(Note: volume averages are based on the average over the past 50 days)
Data as of 4:00EST – End of Day April 16th 2008
Nasdaq: UP 2.8% today with volume at the average
Nasdaq ETF (QQQQ) 4.28%, volume 12% BELOW average
Dow: UP 2.08%, with volume 2% ABOVE the average
Dow ETF (DIA): UP 2.56%, with volume 10% ABOVE the average
S&P ETF (SPY): UP 2.71%, with volume 18% BELOW the average
Russell Small Cap ETF (IWM): UP 3.17%, with volume 15% BELOW the average
::: SelflInvestors Leading Stocks :::
The Self Investors Leading Stocks Index is comprised of stocks in the Breakout Tracker, which is a database of the fastest growing companies near a breakout or having already broken out of a base. Leading stocks did quite well today, outperforming all of the major indices with decent volume behind the move.
Summary:
* Advancers led Decliners 187 to 19
* Advancers were up an average of 3.68% today, with volume 10% ABOVE average
* Decliners were down an average of 1.55% with volume 72% ABOVE the average
* The total SI Leading Stocks Index was UP 3.2% today with volume 16% ABOVE average
::: Where’s the Money Flowing :::
Many investing web sites provide leading industries based on price performance alone. However, without accompanying volume levels, this can sometimes be misleading. The only way that I know of to gauge industry/sector strength WITH volume levels is through the analysis of ETF’s. A couple years ago this was not possible, but as more traders/investors use ETF’s they become a much better tool for gauging the health of the market and seeing where the money is flowing (or not flowing). Using the proprietary Self Investors Demand Indicator score which measures price and volume movements, I’m able to quickly see which sectors/industries are seeing the greatest inflows of cash. For a detailed look at how I go about gauging sector/industry strength please see the following post: http://selfinvestors.com/si/industry_tracking/
* Current Leading Sectors/Industries (over last 30 trading days):
Homebuilders, REITs, Intl Utilities, Biotech, Clean Energy
* Current Lagging Sectors/Industries (over last 30 trading days):
Health Care, Telecom
* Today’s Market Moving Industries/Sectors (UP):
Semis, Technology, Financials, Agriculture, Nuclear Energy, Materials
* Today’s Market Moving Industries/Sectors (DOWN):
None
::: Stocks :::
The stocks section will be an area where I highlight one stock selected from a group of stocks moving up with volume well above average and most likely breaking out of a base or consolidation. I don’t have time tonight for a detailed stock of the day, so once again I provide a sample list of leading stocks moving up with big volume today (full list available in the Breakout Tracker. There are some real gems here! (listed in order of Total Rank)
Baidu.com (BIDU) breakout!
AgFeed Industries (FEED)
Mechel Steel (MTL)
Heico (HEI)
ReneSola (SOL)
Cellcom (CEL)
Chart Industries (GTLS)
Rio Tinto (RTP) breakout!
T-3 Energy Services (TTES)
Balchem (BCPC) breakout!
Full Disclosure/Disclaimer: The stock of the day is by no means a buy recommendation. Please do your own research and make a personal decision based on your own tolerance for risk. I currently do own a position in Baidu (BIDU), Balchem (BCPC) and Mechel (MTL)


