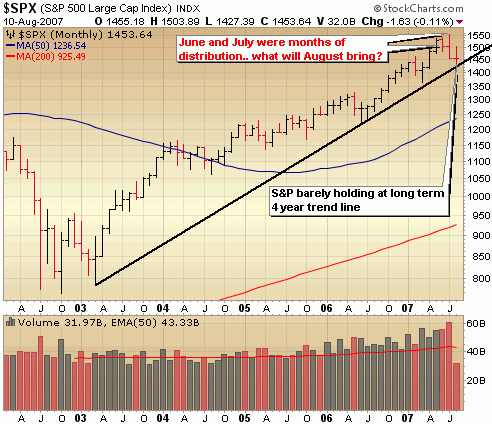
There is a ton of noise out there right now about how bad the subprime & credit issues are, when homebuilders will turn around, whether the plunge protection team is at work, rumors/calls for an interest rate cut, how much the liquidity injection will grease the wheels and on and on and on… Of course that all boils down to whether we should be buying, selling or staying put. The opinions seem to be equal on all sides. It’s all enough to make your head spin with information overload which is why at times like these I like to just focus on the charts. Turn out the lights, the tv, turn on the music and soak up the charts of the major indices and listen to what they are telling you. If you can do that you will be way ahead of the game and in a position to be disciplined and profitable. Of course technical analysis can be a bit subjective but much much less so than fundamental data which can be spun in different directions. Taking a look at various time frames of a few hundred ETF’s as well as the major indices, what I’m seeing is that the bull market is still intact but on mighty shaky legs. There is still a chance that the market will hold up here and the bull market will continue on its merry way, but considering the amount of selling volume behind this leg down I wouldn’t be making large bets that we’re going to new highs. Take into account the head and shoulders topping action in the Dow and to a certain degree the Nasdaq and it all adds up to significant risk at current levels. I have been reading numerous articles that are beating the buying drum if you’re a long term investor. To that I say what the heck for? There is much more risk to the downside than potential to the upside right now. The dip we have experienced is relatively minor with the possibility very real for a correction of greater magnitude. Why not just wait it out for at a few weeks and let the dust settle before doing some long term buying. Patience and preservation of capital is critical.
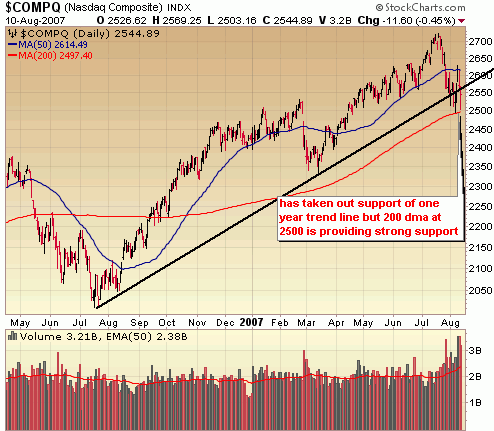
The Nasdaq hit 2500 twice last week and bounced with some significant force from there on both occassions. That doesn’t mean that it can’t eventually take out that support level, but for now that appears to be a strong area of support. I’d expect the Nasdaq to bounce around between support at 2500 and resistance around 2625 for awhile before ultimately sellers regain control. IF the Nasdaq can’t hold 2500 I believe we are headed for a deeper correction to the next level of support around 2350.

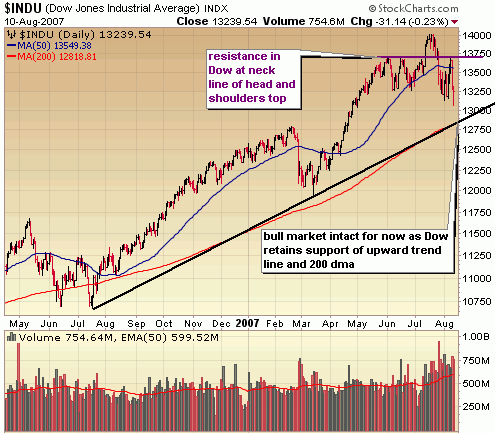
As I’ve been mentioning for a few weeks now, the Dow is carving out a fairly distinctive head and shoulder top with resistance at the top of the shoulder around 13700 and support around 13250. That’s the range that the Dow will probably bounce around in for awhile before buyers or sellers regain control. I’d give the odds to the sellers right now and a test of at least 13000 in the coming weeks.


::: Model Portfolio Update :::
It was a very busy week for the Model Portfolio as I continue to seek profits on both sides of this volatile market. As I’ve been saying for the past several weeks here, I starting hedging with short positions a bit too early and it hurt my performance as I misssed out on much of the rally from April to July. A few people were even kind enough to remind me that they weren’t missing the rally. Gotta love the gloating. You won’t find me gloating much in this segment of the Weekly Report when I’m right just as you won’t find me kicking myself for lack of performance when I’m wrong. Keeping your emotions in check and remaining level headed is critical. The main purpose of this segment is to provide 100% transparency in my performance in the hopes that maybe other advisory services will have the balls to do so.. and as a reminder that it isn’t always easy to profit big in the market (despite what what many services will have you believe). Hopefully, you can learn from my successes and failures just as I continue to learn from my own successes and failures. I won’t always be right, but I will continue to remain confident and trust what the charts are telling me, which was to get short again when the market surged last week to key resistance levels (resistance at necklines in both Nasdaq and Dow head and shoulders tops). A flurry of short positions have been added over the past 2 weeks, several were closed out this week for quick gains in CSS (13%), DRQ (10%), AVY (9%), CE (9%) and VLCM (9%). On the long side, a position in Given Imaging (GIVN) was closed out for an 8% loss. The short strategy has paid off big in the past 2 weeks and I believe that this is where the big money will be made over the next several months, but I do think the bulk of the selling will be on hold for a bit. Five new Quick Strike Profit plays (basically swing trades) on the long side were initiated toward the end of the week to take advantage of a few oversold, very bullish looking stocks. Profits and losses will continue to be taken/cut quickly in this environment. In all, the portfolio surged again last weak, vaulting 3.4% higher, bringing the YTD performance to 9.7% which is nearly 4x the performance of the S&P. What a difference a couple weeks make. While it may seem like I’m way to aggressive in this environment it should be noted that I’ve been trading small positions and am carrying what might be my largest cash position in a few years. Overall current allocation is 52% long, 5% short and 43% cash.
::: Best/Worst Performers :::
– Top 10 Performing Industries For the Week –
1. Water Utilities: 11.00%
2. Residential Construction: 9.55%
3. Recreational Goods: 8.85%
4. REIT – Healthcare Facilities: 7.85%
5. General Entertainment: 7.75%
6. Rubber & Plastics: 6.85%
7. Manufactured Housing: 6.25%
8. Closed End Fund Debt: 6.20%
9. Medical Equipment Wholesale: 6.10%
10. Home Furnishing Stores: 5.80%
– Top 10 Worst Performing Industries For the Week –
1. Toy & Hobby Stores: -10.25%
2. Consumer Services: -6.45%
3. Aerospace/Defense: -4.75%
4. Tobacco Products: -4.50%
5. Heavy Construction: -4.35%
6. Movie Production – Theaters: -3.85%
7. Trucks & Other Vehicles: -3.70%
8. Personal Computers: -3.60%
9. Small Tools & Accessories: -3.20%
10. Copper: -2.85%
– Top 5 Best Performing ETFs For the Week –
1. US Natural Gas (UNG) 11.55%
2. Ishares Home Construction (ITB) 8.95%
3. KBW Regional Banking (KBW) 8.15%
4. Powershares Clean Energy (PBW) 6.50%
5. SPDR Homebuilders (XHB) 6.15%
– Worst 5 Performing ETF’s –
1. US Oil (USO) -5.00%
2. Germany Fund (GF) -4.90%
3. Central Europe & Russia Fund (CEE) -3.80%
4. Market Vectors Steel Fund (SLX) -3.75%
5. Asa Gold (ASA) -3.65%
::: IPO’s Worth Watching for This Week :::
There are two outstanding IPO’s coming to market this week, led by VMware (VMW) which could be one of the hottest IPO’s of the year. No slouch is Cosan Limited (CZZ), a Brazilian sugarcane producer which provides perhaps the best way to play the ethanol boom.
1. VMWare (VMW): VMware develops software that creates and manages virtual machines — computer functions spread across multiple systems that act as one. Companies use VMware’s software to more efficiently integrate and manage server, storage, and networking functions, thereby lowering the operating costs of their computing resources. VMware also provides consulting, support, and training services. The company has marketing relationships with computer hardware vendors including Dell, Hewlett-Packard, and IBM. Founded in 1998, VMware was acquired by EMC for about $625 million in cash in 2004. Trading set to begin on Tuesday.
2. Cosan Limited (CZZ): One of the largest growers and processors of sugarcane in the world, Cosan turns its raw material into refined sugar and ethanol. Operating primarily out of Brazil’s south central state of Sao Paulo, the company runs 17 mills, two refineries, two port facilities and numerous warehouses. In addition to its ethanol and sugar products, the company is exploring electricity generation operations using sugarcane by-products. Although Cosan was formed in 2000 and has grown primarily through the acquisition of existing sugar mills, the company can trace its roots back to a single sugar mill established in 1936.. Trading set to begin on Thursday.
::: Upcoming Economic Reports (8/13/07 – 8/17/07) :::
Monday: Retail Sales, Business Inventories
Tuesday: PPI, Trade Balance
Wednesday: CPI, Industrial Production, Capacity Utilization, Crude Inventories
Thursday: Housing Starts, Building Permits, Initial Claims, Philly Fed
Friday: Mich Sentiment – Prelim
::: Upcoming Notable Earnings Reports :::
Earnings season is beginning to wind down…
Tuesday:
Internet Gold (IGLD), Companhia Paranaense de Energia (ELP), Canadian Solar (CSIQ)
Wednesday:
Copa Holdings (CPA)
::: In Case You Missed It – SelfInvestors Blog Entries of the Past Week :::
1. Big Rally, But Not Broad – Financials Lead, Leaders Lag; Stock of Day – Life Time Fitness (LTM)
2. Mindray Medical (MR) Breaks Out After Earnings; Ctrip.com (CTRP) Plunges But Still Bullish
3. General Growth Properties (GGP) CFO Continues Insider Buying Spree
4. Trade of the Day – Basin Water (BWTR) Breaks Out of Bullish Triangle
5. Cisco (CSCO) & Middleby (MIDD) Breakout On Earnings
6. Bulls Running..Right to Resistance; Stock of Day – Kenexa (KNXA)
7. Perficient (PRFT) Add to Breakout On Earnings