In my last weekly report I commented on the hope and optimism of the looming Geithner announcement and highlighted the fact that the euphoria of government bail out plans usually wears off quickly, often resulting in sizable sell offs. Geithner’s press conference on Tuesday which was heavy on rhetoric but lacked sufficient details, was no exception. It was met with a prompt and fairly intense sell off on Wall St leaving the indices badly bruised and once again in position to take out critical support levels. On Thursday that’s exactly what happened. Both the Dow and S&P broke down out of their bearish, descending triangle formations and with 45 minutes left to go in the trading day and the market on the verge of complete collapse, Reuters broke the news that the Obama administration was working on yet another bail out by subsidizing mortgages to help avoid the continuing avalanche of foreclosures. ….
I can’t help but think that the timing of that announcement was no coincidence. The indices were in bad shape that afternoon and that announcement provided the catalyst for a furious round of short covering, keeping the indices afloat (just barely) as we head into next week. Never a dull market in this market.
Let’s have another look at the indices.
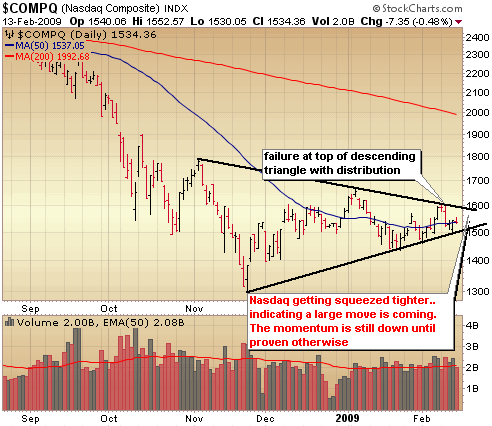
The Nasdaq certainly remains the healthiest of the indices, but it failed at the top of the descending triangle formation on Tuesday with above average sell volume. It’s still clinging to support of the 50 day moving average (blue line) but that distribution day and failure at the top of the triangle has me much more cautious on this market than I was one week ago. A break below 1500 which would take out support of the bottom of the triangle would signal big trouble ahead.
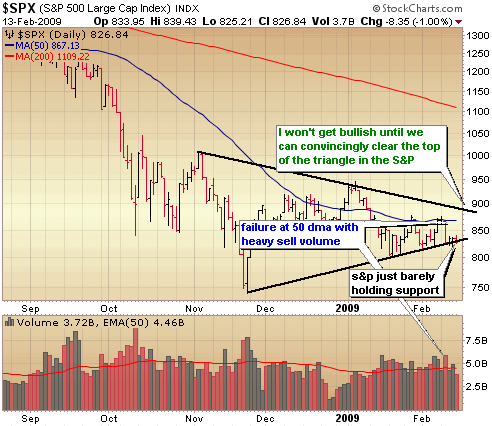
The S&P continues to manage to hold up at support at the bottom of the triangle as well, but there is absolutely no more room to run to the downside. It has to get going and get going quickly to avoid a melt down here. Notice the failure at the 50 day moving average in blue for the 2nd time in a month. This indicates that the likelihood of a break down from here outweighs the possibility of a break out to the upside. Be extremely careful here and maintain capital preservation mode until the S&P can convincingly breakout above major resistance levels.
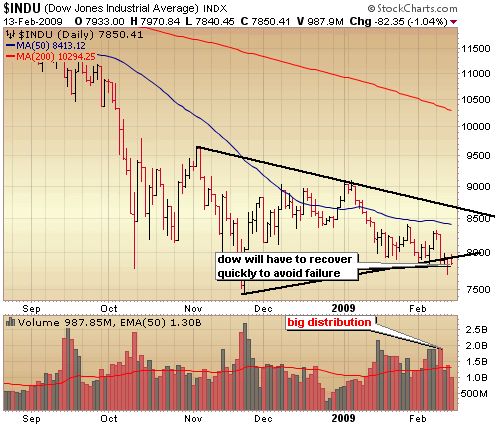
The Dow looks increasingly sick, never able to touch its 50 day moving average in the last month and closed below 8000 on a weekly basis for the first time in 6 years. Enough said.
::: Model Portfolio :::
** This section will now appear as a separate report about every other Wednesday.
The Self Investors Model Portfolio wrapped up 2006 with a gain of 27.6%, 2007 with a gain of 30.2%, finished nearly 35% ahead of the S&P in a very difficult 2008 and is off to a good start here in 2009, ahead of the S&P by 6%. This is a REAL portfolio with position sizing and not based on extrapolated hypothetical gains for each trade. On average it beats the S&P by 20% per year.
Would you like to receive buy and sell alerts in the Model Portfolio within minutes (NEW! now get them via instant messaging in near real time) of each transaction? You can receive these along with ALL of the tracking tools and video reports with the very popular Gold membership. Don’t delay, get started today and join me for many more highly profitable months here at SelfInvestors.com.
::: Best/Worst Performers :::
– Top 10 Performing Industries For the Week –
1. Healthcare Info Services: 5.90%
2. Home Health Care: 5.05%
3. Medical Practitioners: 3.05%
4. Specialized Health Services: 2.90%
5. Dairy Products: 2.55%
6. Insurance Brokers: 2.40%
7. Beverages – Soft Drinks: 1.95%
8.. Silver: 1.85%
9. Security Software & Services: 1.75%
10. Medical Laboratories & Research: 1.35%
– Top 10 Worst Performing Industries For the Week –
1. REIT – Hotel/Motel: -18.10%
2. Banks – MidAtlantic: -16.60%
3. REIT – Healthcare Facilities: -16.55%
4. Banks – Midwest: -16.00%
5. Resorts & Casinos: -14.75%
6. REIT – Retail: -14.05%
7. Lodging: -13.55%
8. REIT – Diversified/Industrial: -13.45%
9. Security & Protection Services: -12.75%
10. Banks – Southeast: -12.70%
– Top 5 Best Performing ETFs For the Week –
(excluding leveraged ETFs)
1. Market Vectors Russia (RSX) 9.60%
2. Central Fund of Canada (CEF) 6.05%
3.Templeton Russia & E Europe (TRF) 5.65%
4. iShares Silver (SLV): 4.90%
5. Asa Gold (ASA) 4.35%
– Worst 5 Performing ETF’s –
1. HLDRS Regional Banks (RKH) -15.00%
2. iShares Realty (ICF) -14.70%
3. SPDR Series Trust (KBE) -14.30%
4. SPDR REIT (RWR) -13.70%
5. HLDRS Telecom (TTH) -12.40%
::: Upcoming Economic Reports (2/16/2009- 2/20/2009) :::
Monday: None – Holiday
Tuesday: Empire State Mfg.
Wednesday: Building Permits, Housing Starts, Import/Export Prices, FOMC Minutes, Crude Inventories
Thursday: PPI, Initial Claims, Leading Indicators
Friday: CPI
::: Earnings I’m Watching This Week :::
Monday: Walter Industries (WLT)
Tuesday: Amedisys (AMED), American Medical Systems (AMMD), Axsys Tech (AXYS), CardioNet (BEAT), Chesapeake Energy (CHK), FMC Tech (FTI), Gen-Probe (GPRO), Transocean (RIG), Ultra Petroleum (UPL), United Therapeutics (UTHR), Wal Mart (WMT
Wednesday: Baidu.com (BIDU), Hewlett Packard (HPQ), Itron (ITRI), NCI (NCIT), Priceline (PCLN), Suntech Power (STP),
Thursday: AmSurg (AMSG), Apache (APA), Bucyrus Intl (BUCY), Morningstar (MORN), Noble Energy (NBL), Oil States Intl (OII), Sapient (SAPE), TheStreet.com (TSCM), VCA Antech (WOOF)


