I’ll start out the report this week with a member question because I think it’s a good lead in to what I want to focus on – the technicals. The question was basically what I thought about Jim Cramer’s prediction that the Dow would drop another 2000 points if GM wasn’t bailed out and his recommendation to sit on the sidelines and/or sell ahead of the news.
First of all Cramers prediction is just that.. a prediction with a bit of doomsday fear thrown in. Hey, it makes for a nice headline and gets people talking. The bottom line is that nobody knows what will happen with GM. Democrats are in favor of some kind of a bailout as many agree they’re “too big too fail”, with a GM bankruptcy leading to a major domino effect of unemployment. On the other hand, there are those that would like to see the capitalist system take care of it, rather than prolonging inevitable pain. As far as an investment strategy goes, it’s tough to disagree with an approach that recommends sitting on the sidelines until the dust clears and for many people that may be the smart way to play.
If GM isn’t bailed out, could the Dow plunge another 2000 points? Sure, that could happen but I have to trade what I see right now. As always I’m going to rely on the supply and demand picture provided by the stock charts to tell me how to get positioned and right now they are telling me to add some long exposure. Are stock charts absolutes? Of course not.. the charts provide readings of probabilities and the action late last week indicated that there is now a greater probability of the market rising from current levels than dropping another few thousand points. While I won’t yet call this “THE” bottom, it’s important to remember that markets rally when the economy looks awful just as when tops are put in when everyone is getting rich. I believe the setup is in place for a decent tradeable rally. I’m certainly not getting aggressive down here, but with 3 successful tests and recoveries from correction lows it’s time to put some skin in the game. My sentiment shifted from neutral to somewhat bearish last week to somewhat bullish heading into this week. The Self Investors Model Portfolio shifted from basically neutral to 20% long exposure by the end of last week. If we get some follow through on last Thursday’s key reversal day, I may add more long exposure.
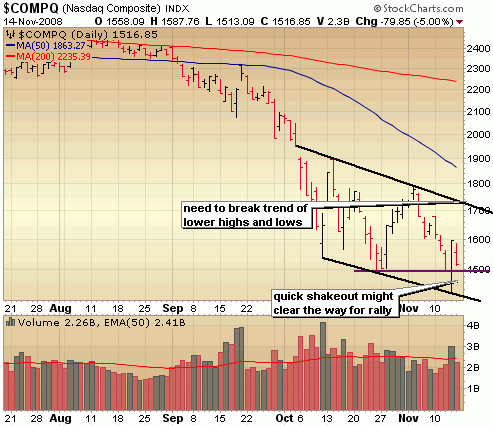
In the action of the Nasdaq, there are certainly reasons to be more bullish in the shorter term, but we are still in a bear market until proven otherwise. In the chart below, you can see that the Nasdaq has been trending down as it tries to find a level of support. I did like the fact that the Nasdaq broke below what had been support around 1500, shook out a few more weak holders and those that got too bullish too soon, only to rally back above support of 1500 with good volume. In the short term that is indeed very bullish and may clear the way for another test of the top of this short channel around 1700 in the coming weeks. If the Nasdaq can clear that resistance level, it will almost immediately face stiff resistance of the 50 day moving average which is why I’m not getting overly aggressive on the long side down here and will look to lock in some profits if and when we get to those important resistance points. You have to shorten your hold times in this market.
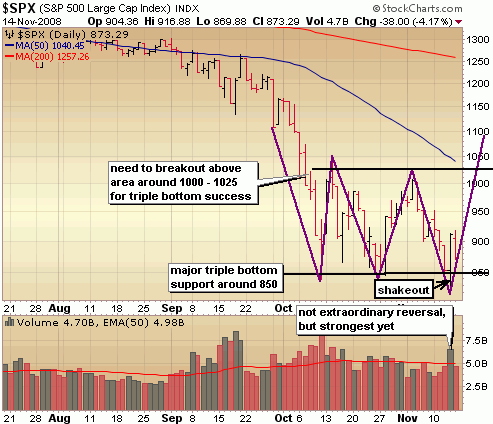
In the S&P and Dow we have more of a triple bottom base going on with definitive support levels shaping up. In the S&P that level is around 850, so if we close below that level with volume, I’ll be back in bearish mode. Like we saw in the Nasdaq on Thursday, the S&P also took out important support intraday but rallied back above. It may have just been the shakeout needed to clear the way for a decent end of year rally. It’s still early yet though.. to confirm a triple bottom, the S&P will need to blast through resistance levels of the October highs, the Nov highs and the 50 day moving average. I’ll be looking to take profits on a move up into those resistance areas and probably wouldn’t get long again until the market surges above, confirming the triple bottom.
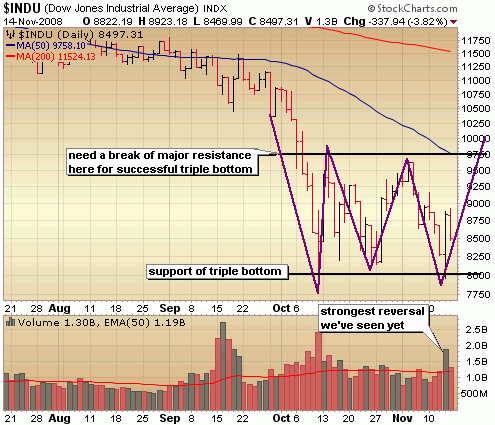
In terms of support, the line in the sand for the Dow is right around 8000, so if we close below that level with volume, the risk of another plunge lower becomes much greater. However, based on Thursday’s high volume reversal back above support which is the 3rd successful test of that area in about a month, I believe the probability of that happening anytime soon is quite low. We’re setting up for a run to Dow 9750 but be careful there as major resistance comes into play once again. We need to clear above that level and hold there in order to confirm the triple bottom.
::: Model Portfolio :::
** This section will now appear as a separate report about every other Wednesday.
The Self Investors Model Portfolio wrapped up 2006 with a gain of 27.6%, 2007 with a gain of 30.2% and is more than 30% ahead of the S&P in a very difficult 2008. This is a REAL portfolio with position sizing and features annualized returns of 24%.
Would you like to receive buy and sell alerts in the Model Portfolio within minutes (NEW! now get them via instant messaging in near real time) of each transaction? You can receive these along with ALL of the tracking tools and video reports with the very popular Gold membership. Don’t delay, get started today and join me for many more highly profitable months here at SelfInvestors.com.
::: Best/Worst Performers :::
– Top 10 Performing Industries For the Week –
1. Beverages – Brewers: 2.05%
2. Long Distance Carriers: 1.40%
3. Waste Management: .15%
4. Farm Products: .05%
5. Trucks & Other Vehicles: -.35%
6. Tobacco Products: -.50%
7. Telecom Services: -.80%
8. Savings & Loans: -.90%
9. Diversified Utilities: -.95%
10. Toy & Hobby Stores: -1.25%
– Top 10 Worst Performing Industries For the Week –
1. Long Term Care Facilities: -31.10%
2. Semis – Memory Chips: -29.85%
3. REIT – Hotel/Motel: -27.45%
4. Manufactured Housing: -25.15%
5. REIT – Retail: -22.15%
6. Department Stores: -20.50%
7. Recreation Vehicles: -20.35%
8. Advertising Agencies: -19.40%
9. Meat Products: -19.15%
10. Textile Manufacturing: -18.90%
– Top 5 Best Performing ETFs For the Week –
1. Morgan Stanley China (CAF) 10.05%
2. HLDRS Telecom (TTH) 4.20%
3. Chile Fund (CH) 2.85%
4. PowerShares Base Metals (DBB) 2.85%
5. Asa Gold (ASA) 1.40%
– Worst 5 Performing ETF’s –
1. Templeton Russia (TRF) -28.50%
2. Market Vectors Russia (RSX) -25.05%
3. PowerShares Private Equity (PSP) -19.90%
4. Morgan Stanley Frontier Market (FFD) -19.70%
5. iShares REIT (ICF) -19.70%
::: Upcoming Economic Reports (11/17/2008- 11/21/2008) :::
Monday: Capacity Utilization, Industrial Production
Tuesday: PPI
Wednesday: CPI, Housing Starts, FOMC Minutes, Crude Inventories
Thursday: Trade Balance, Treasury Budget, Export/Import Prices, Initial Claims
Friday: Initial Claims, Leading Indicators
::: Earnings I’m Watching This Week :::
Monday: Ctrip.com (CTRP), VanceInfo Tech (VIT)
Tuesday: GigaMedia (GIGA), Home Depot (HD), ReneSola (SOL),
Wednesday: LDK Solar (LDK), Trina Solar (TSL), Woodward Governor (WGOV)
Thursday: Salesforce.com (CRM), Suntech Power (STP)
Friday: Canadian Solar (CSIQ)


excellent article. finally someone who knows how to manage a market/positions. Also, does not pretend to know where the market is going, only manages the situation as the news\events evolve. Excellent article
Good info on the triple bottom pattern. It’s sad though that as of today, the chart isn’t looking to go up for that “confirmation point”. Looks like it’s gonna be a downward triangle formation. Let’s see what the market will bring to the charts for the next few days.