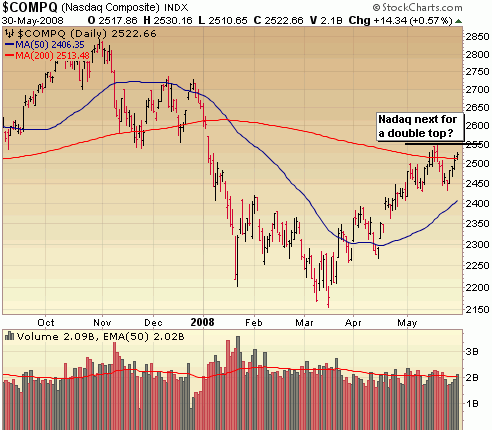
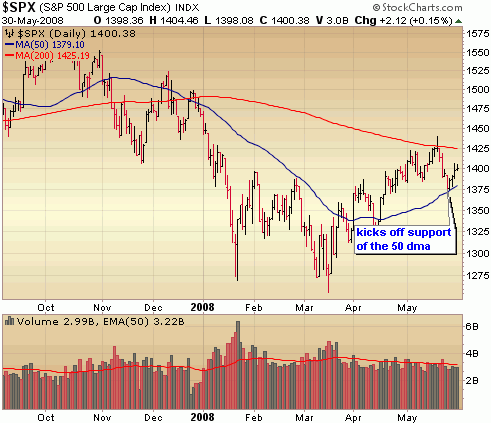
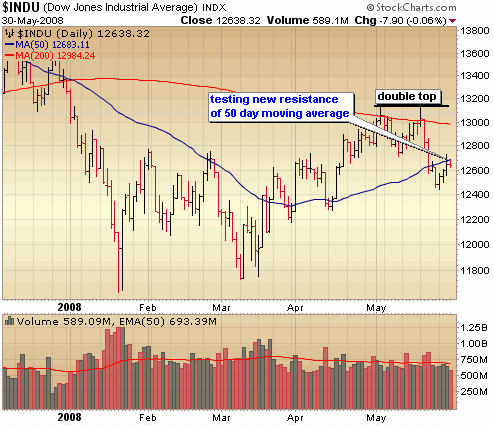
Lots of intraday swings in both the overall equities market and crude prices, with the end result at the end of the week being a small pull back in crude with a decent recovery in stock prices, following a dismal week of distribution. With the S&P bouncing off the 50 day moving average and the Nasdaq reclaiming support of the 200 day moving average it’s time buy, buy, buy right? Wrong! I still believe we’re seeing some intermediate topping action in the indices and last week’s move up was just an oversold retracement of a bearish move. If you didn’t lock in hard earned gains off that March bottom in mid May, now is your chance. What if I’m wrong and the indices blow through their May highs with volume? In the off chance that happens, then you just get back in with very little lost in potential on the long side. Not much potential reward to give up for taking significant risk off the table in my opinion.
::: Model Portfolio :::
** This section will now appear as a separate report about every other Wednesday.
The Self Investors Model Portolio wrapped up 2007 with a 30.2% gain and features annualized returns of 24%. Would you like to receive buy and sell alerts within minutes (NEW! now get them via instant messaging in near real time) of each transaction in the portfolio? You can receive these along with ALL of the tracking tools and reports with the very popular Gold membership. Don’t delay, get started today and join me for many more highly profitable months here at SelfInvestors.com.
::: Best/Worst Performers :::
– Top 10 Performing Industries For the Week –
1. Pollution & Treatment Controls: 8.10%
2. Personal Computers: 7.85%
3. Major Airlines: 7.60%
4. Consumer Services: 6.60%
5. General Contractors: 6.30%
6. Semiconductor – Integrated Circuit: 6.05%
7. Long Distance Carriers: 6.00%
8. Technical & System Software: 6.00%
9. Sporting Goods Stores: 5.45%
10. Textile – Apparel Clothing: 5.40%
– Top 10 Worst Performing Industries For the Week –
1. Gold: -4.80%
2. Banks – Mid Atlantic: -4.20%
3. Banks – SE: -4.10%
4. Cement: -4.05%
5. Silver: -4.05%
6. Tobacco Products: -4.00%
7. Dairy Products: -4.00%
8. Surety & Title Insurance: -3.75%
9. Industrial Metals & Minerals: -3.65%
10. Entertainment – Diversified: -3.20%
– Top 5 Best Performing ETFs For the Week –
1. Greater China Fund (GCH) 5.70%
2. Turkish Invest (TKF) 5.60%
3. HLDRS Internet Architecture (IAH) 5.40%
4. Japan Small Cap (JOF) 5.20%
5. HLDRS Broadband (BDH) 4.65%
– Worst 5 Performing ETF’s –
1. iShares Silver (SLV) -6.25%
2. Thai Fund (TTf) -6.15%
3. Asa Limited Gold (ASA) -4.60%
4. Market Vectors Gold Miners (GDX) -4.50%
5. iShares Gold (IAU) -3.90%
::: Upcoming Economic Reports (6/2/2008- 6/6/2008) :::
Monday: Construction Spending, ISM Index
Tuesday: Auto/Truck Sales, Factory Orders
Wednesday: Productivity, ISM Services, Crude Inventories
Thursday: Initial Claims
Friday: Nonfarm Payrolls, Unemployment Rate, Wholesale Inventories, Consumer Credit
::: Earnings I’m Watching This Week :::
Tuesday:
Layne Christensen (LAYN)
Wednesday:
Comtech Telecommunications (CMTL), Greif Brothers (GEF), Hovanian (HOV), Vimpel Comm (VIP)
Thursday:
Bio Reference Labs (BRLI), Ciena (CIEN), Focus Media (FMCN)
Friday:
A-Power Energy Generation Systems (APWR)


How can the iShares Silver (SLV) be both the top-performing and the worst-performing ETF this week?
updated – thanks for catching that!