Today we got the much anticipated relief rally… to the downside. Relief from the never ending barrage of "Dow 14,000" blurbs and flashing alerts from CNBC. Ok I’m done bashing them.. I’ll leave it to the other blogs to do that since they do a much better job. Suffice it to say I’m disgusted with some of the comments that have been made .. maybe another post for another day. The point is that we needed this move today to wring out the excess and exuberance.. to throw some sensibility back into the market by (and now the talking heads) taking a more serious look at the underlying problems in the economy that have been bubbling but largely ignored (insert Fed officials here). The fact is that this economy is still in a state of extremes that began with the internet bubble mania of the late 90’s, resulting in the market crash, which led to rate cut after rate cut, which fueled the housing boom and the LBO boom, which fueled……. another market crash? Probably not, but you have to believe that there has to be an equal an opposite reaction of fear to the amount of runaway greed we have seen lately. That doesn’t paint a purdy picture, but hopefully it will eventually lead to a more normalized economic environment where extremes are thing of the past….
Anyway, I’m not an economist and just thinking out loud.. I’m a technical trader and key off the charts. I mentioned on Tuesday, that the character of this market had changed with the big move down. The market, which had done such a good job of sweeping the underlying issues under the rug was beginning to take notice. Bull runs die when the market begins finding any bad news to move on which we saw following the Bill Gross and Countrywide CEO comments. The move up on Thursday was a gift.. an opportunity to close out some long positions and get short before the confirmation move below key support levels today. How bad was it today? There isn’t any other way to describe it other than ugly with sell volume coming in at record levels and key support levels taken out left and right. On the bright side, the market did rally a bit at the end of the day and most importantly, the market still looks OK when you look at the big picture on the weekly charts. There is a bit of room to run to the downside before we start approaching what I would call the bull market / bear market mendoza lines. Let’s have a look:
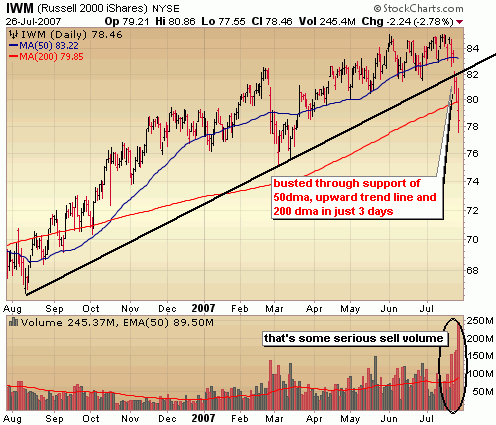
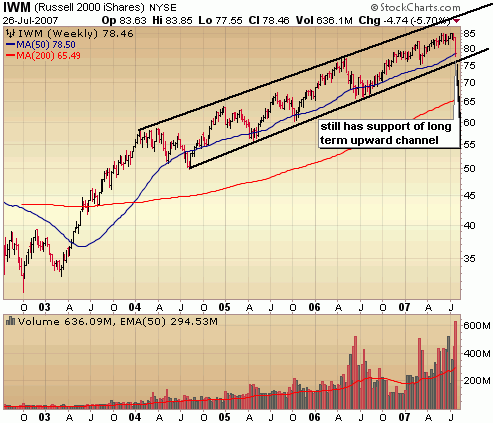
I’ll start with the Russell Tracking Index ETF (IWM), comprised of the small ones and the weakest of the indices. The daily chart indicates the severity of the damage in the short term as the index took out 3 key support levels in the past 3 days, but the long term perspective shows that we’re still within the confines of an upward trend for now. Key support in the IWM is around 76.
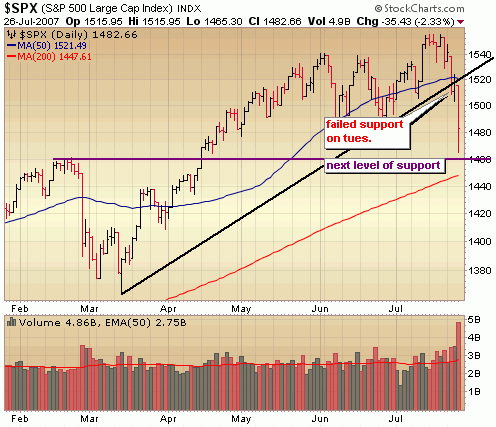
The S&P busted through a few key support levels as well but retains support around the area of the April breakout and 200 day moving average.
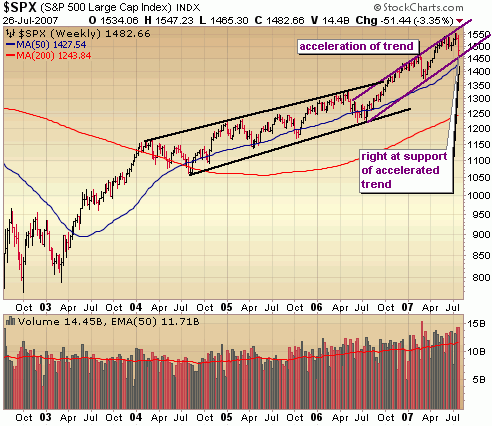
The weekly view of the S&P indicates that despite the sell off of the past few days, it still has support at the bottom of an accelerated channel and would have to drop another 100 points before it hits the longer term channel. Key support in the S&P from here is around 1460.
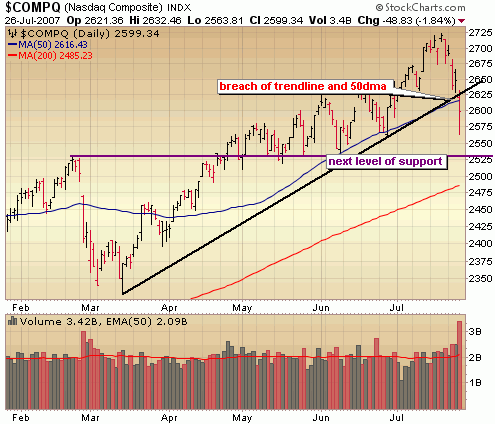
The Nasdaq daily shows the break of key support at the upward trend line and 50 day moving average today which is a new resistance area for the index. I do think we’ll see some kind of bounce to this resistance before we ultimately head lower. Such a move would provide another area to initiate short positions and/or cut losses / lock in gains. Next level of support is around 2525.
::: Major Indices Performance – The Numbers :::
Distribution across all indices.
(Note: volume averages are based on the average over the past 50 days)
Data as of 4:00EST – End of Day July 26thth 2007
Nasdaq: DOWN 1.84% today with volume 63% ABOVE average
Nasdaq ETF (QQQQ) DOWN .85%, volume 161% ABOVE average
Dow: DOWN 2.26%, with volume 75% ABOVE the average
Dow ETF (DIA): DOWN 2.03%, volume 220% ABOVE the average
S&P ETF (SPY): DOWN 2.37%, volume 212% ABOVe the average
Russell Small Cap ETF (IWM): DOWN 2.78%, volume 189% ABOVE the average
::: SelflInvestors Leading Stocks :::
The Self Investors Leading Stocks Index is comprised of stocks in the Breakout Tracker, which is a database of the fastest growing companies near a breakout or having already broken out of a base. Small caps were hit the hardest again today, but surprisingly they actually fared a bit better today than they did on Tuesday.
Summary:
* Decliners led Advancers 353 to 43
* Advancers were up an average of 3.2% today, with volume 132% ABOVE average
* Decliners were down an average of 3.08% with volume 34% ABOVE average
* The total SI Leading Stocks Index was DOWN 2.59% today with volume 76% ABOVE average
::: Where’s the Money Flowing :::
Many investing websites provide leading industries based on price performance alone. However, without accompanying volume levels, this can sometimes be misleading. The only way that I know of to gauge industry/sector strength WITH volume levels is through the analysis of ETF’s. A couple years ago this was not possible, but as more traders/investors use ETF’s they become a much better tool for gauging the health of the market and seeing where the money is flowing (or not flowing). Using the proprietary SelfInvestors Demand Indicator score which measures price and volume movements, I’m able to quickly see which sectors/industries are seeing the greatest inflows of cash. For a detailed look at how I go about gauging sector/industry strength please see the following post: http://selfinvestors.com/si/industry_tracking/
* Current Leading Sectors/Industries (over last 30 trading days):
Networking, Clean Energy, Software, Commodities, Technology
* Current Lagging Sectors/Industries (over last 30 trading days):
Broker Dealers, Utilities, Home Construction, Financials, Consumer Discretionary
* Today’s Market Moving Industries/Sectors (UP with volume):
Bonds
* Today’s Market Moving Industries/Sectors (DOWN with volume):
Internet Infrastructure, Real Estate, Energy, Basic Materials, Gold, Homebuilders
::: Stocks :::
The stocks section will be an area where I highlight one stock selected from a group of stocks moving up with volume well above average and most likely breaking out of a base or consolidation.
Sorry, no stock of the day today.
Interesting, those support levels for the S&P and Nasdaq that you give are still 18 and 25% respectively above their lows last summer.
To me there was no question that the market has under valued itself last summer and it was easy to find good stocks, but with the market up that much it isn’t surprising that it is harder to find good stocks, at least I think it is.