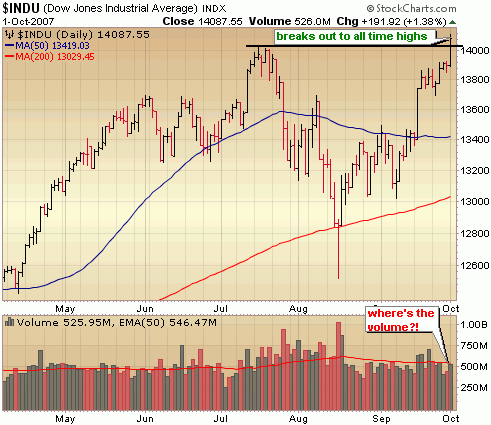
In my weekly report yesterday I mentioned I was waiting for a low volume move down to key support levels OR a big breakout to new highs to get more aggressive on the long side. I was not expecting a breakout move to happen so soon especially with the news out of Citigroup in the morning but today we got the big breakout.. or did we? Apparently traders feel the credit crunch will be a fairly isolated event (even Citigroup said earnings would be back to normal in the 4th quarter after a 3rd quarter hit) and with the Fed there to brace the fall every step of the way.. why not bid up up the market! The price was there and the Dow and Nasdaq broke out from key resistance levels to new record highs. BUT WHERE WAS THE VOLUME?? Since volume levels were higher than Friday, today’s move was technically a day of accumulation. However, considering volume levels were below average across the board it’s clear that institutions didn’t do a whole of participating in today’s rally. It seemed to be more of a case of the retail side fearing missing the next move up and some short covering. Considering that the market is being led by commodities (no, Gold shouldn’t lead the way in a bull market) along with overbought conditions quite frankly I’m becoming skeptical of this rally. I’m continuing to play it with small long positions and added a couple more today but I’ll be vigilant about looking for more warning signs and even more vigilant about protecting my profits.


::: Major Indices Performance – The Numbers :::
(Note: volume averages are based on the average over the past 50 days)
Data as of 4:00EST – End of Day October 1st 2007
Nasdaq: UP 1.46% today with volume 5% BELOW average
Nasdaq ETF (QQQQ) UP 1.15%, volume 32% BELOW average
Dow: UP 1.38%, with volume 4% BELOW the average
Dow ETF (DIA): UP 1.22%, volume 47% BELOW the average
S&P ETF (SPY): UP 1.13%, volume 36% BELOW the average
Russell Small Cap ETF (IWM): UP 2.49%, volume 20% BELOW the average
::: SelflInvestors Leading Stocks :::
The Self Investors Leading Stocks Index is comprised of stocks in the Breakout Tracker, which is a database of the fastest growing companies near a breakout or having already broken out of a base. Small to mid cap leading stocks led the way today as the Russell 2000 and the Self Investors Leading Stocks index greatly outperformed the major indices.
Summary:
* Advancers led Decliners 284 to 50
* Advancers were up an average of 2.71% today, with volume 2% ABOVE average
* Decliners were down an average of 2.05% with volume 59% ABOVE average
* The total SI Leading Stocks Index was UP 1.99% today with volume 10% ABOVE average
::: Where’s the Money Flowing :::
Many investing websites provide leading industries based on price performance alone. However, without accompanying volume levels, this can sometimes be misleading. The only way that I know of to gauge industry/sector strength WITH volume levels is through the analysis of ETF’s. A couple years ago this was not possible, but as more traders/investors use ETF’s they become a much better tool for gauging the health of the market and seeing where the money is flowing (or not flowing). Using the proprietary SelfInvestors Demand Indicator score which measures price and volume movements, I’m able to quickly see which sectors/industries are seeing the greatest inflows of cash. For a detailed look at how I go about gauging sector/industry strength please see the following post: http://selfinvestors.com/si/industry_tracking/
* Current Leading Sectors/Industries (over last 30 trading days):
Gold, Gold Miners, Agriculture, Software, Technology
* Current Lagging Sectors/Industries (over last 30 trading days):
Retail, Homebuilders
* Today’s Market Moving Industries/Sectors (UP):
Home Construction, Semis, REIT, Nanotech, Transports, Pharma
* Today’s Market Moving Industries/Sectors (DOWN):
Commodities
::: Stocks :::
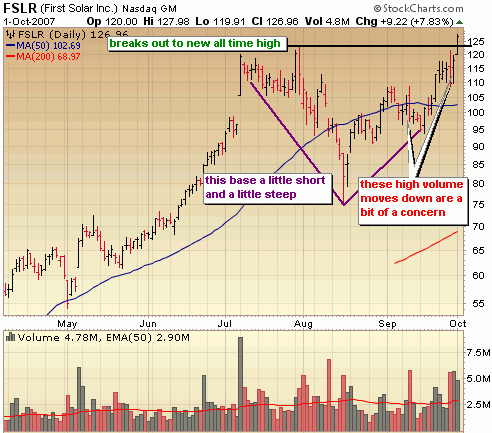
The stocks section will be an area where I highlight one stock selected from a group of stocks moving up with volume well above average and most likely breaking out of a base or consolidation. Today’s stock is First Solar (FSLR), a top solar play which broke out of its first significant base since going public. Yeah, it’s hard to believe a stock could run more than 500% without carving out a significant base along the way, but that’s been the case with many solar stocks. For this reason I DO NOT adhere to the rule that says you should wait to initiate a position in an IPO until it carves out its first base. The best IPO’s often don’t carve out a decent base until AFTER they have run up 50-100..-500%!
ABOUT:
First Solar, Inc. (First Solar) designs and manufactures solar modules using a thin film semiconductor technology. The Company manufactures its solar modules on high-throughput production lines. Its solar modules employ a thin layer of cadmium telluride semiconductor material to convert sunlight into electricity. In August 2006, First Solar completed its Ohio expansion, adding two 25 megawatt production lines to its existing 25 megawatt base plant. The Company describes its production capacity with a nameplate rating, which means minimum expected annual production. It assigns each production line a 25 megawatt nameplate rating. With the completion of its Ohio expansion, First Solar has an annual manufacturing capacity of 75 megawatt. The Company is also building a four line 100 megawatt plant in Germany. During the fiscal year ended December 30, 2006, First Solar entered into long-term solar module supply contracts with six European project developers and system integrators.
FUNDAMENTALS:
Like all solar companies, First Solar (FSLR) has been posting extraordinary sales and profits over the past several quarters and posted its first full year profit last year. This year profit growth is expected to explode nearly 1000% over 2006. No wonder the stock has soared over 500% since going public just over a year ago. Net margins are excellent at around 26% but Return on Equity is disappointing at around 2%. Not what you want to see in a leading company. While First Solar (FSLR) isn’t currently the strongest solar company fundamentally, it’s often touted as the one with the greatest potential. First Solar (FSLR) should certainly be near the top of any breakout watch list right now.
TECHNICAL:
Following a huge run like FSLR has had I like to see a much larger, smoother base form than the one that FSLR has formed over the past few months. However, given the industry it’s in (solar is still hot) and the growth, today’s breakout should not be ignored. What I would do to decrease the risk of an entry is avoid initiating a position on the breakout and see how the stock performs over the next several days. Does it continue spiking higher with heavy volume, then pull back to near the breakout point (at 123.31 with light selling volume)? This is an indication that the breakout is strong and will undoubtedly hold up. You can bet I’ll be initiating a position of my own in this case.

SELFINVESTORS RATING: With a total score of 50/60 (26/30 for fundamentals, 24/30 for technical), First Solar (FSLR) is a very good SelfInvestors breakout candidate.
Full Disclosure/Disclaimer: The stock of the day is by no means a buy recommendation. Please do your own research and make a personal decision based on your own tolerance for risk. I currently do not own a position in FSLR.