Today was yesterday, it was Ground Hog’s Day. Nothing changed and everything is the same except for one thing which I’ll get to in a minute. Just like yesterday, decent economic data wasn’t enough to overcome the credit concerns. A fairly tame reading on CPI and healthy regional manufacturing (even news of Buffet buying some BAC) weren’t enough to offset the daily dose of downgrades and credit concern comments. Today was Ground Hog’s Day but with a change in strategy. It’s time to begin paring back short positions and keeping the eyeballs peeled for opportunity on the long side. Not long term opportunity, but bounce opportunity in the short term on the long side. Let’s go to the charts:
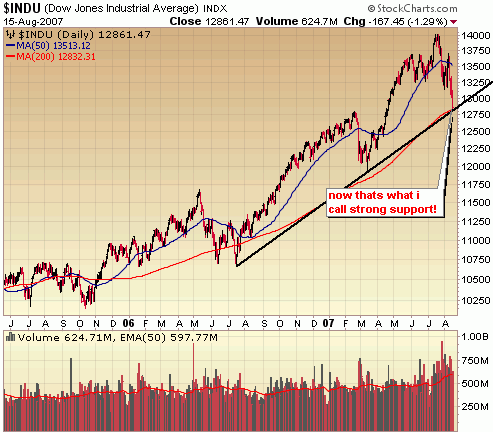
The Dow has hit major support here at the 200 day moving average and the upward trend line around 12800 but as we’ve seen with major support levels in both the Nasdaq and S&P, the momentum to the downside puts this major support level at risk. However, I think we are getting closer and closer to a significant bounce in the market. What I’ll be doing at some point tomorrow is paring back short positions and begin looking for the best long opportunities to dabble in. I continue to believe that the best place for most investors right now is cash.

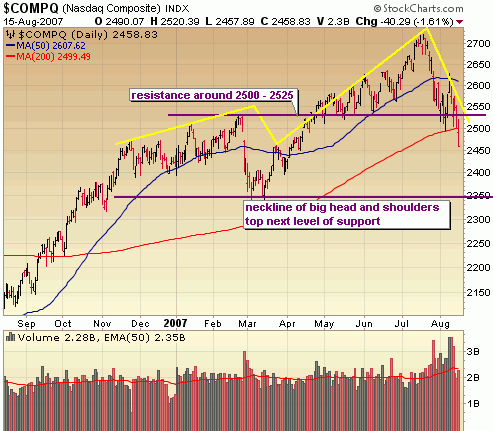
The Nasdaq took out very important support around 2500, setting it up for a test of the next level of significant support around 2350 at some point, which is the neckline of a large head and shoulders topping formation. Before that happens though we should get a sizable bounce to test resistance at the area around the top of the shoulder and 200 day moving average (~2525).

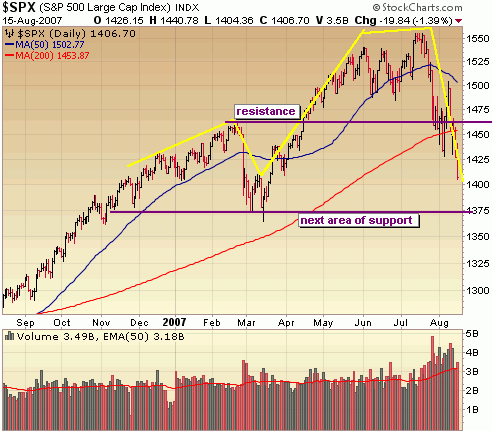
The S&P is much closer to the next key level of support around the neckline of a big head and shoulders formation. I still think we’ll test resistance before it hits that level but I certainly wouldn’t be making large bets that that will happen. As I mentioned above I’m paring back short positions and "looking" for good bounce plays on the long side.

::: Major Indices Performance – The Numbers :::
(Note: volume averages are based on the average over the past 50 days)
Data as of 4:00EST – End of Day August 15th 2007
Nasdaq: DOWN 1.6% today with volume 2% BELOW average
Nasdaq ETF (QQQQ) DOWN 1.9%, volume 46% ABOVE average
Dow: DOWN 1.29%, with volume 4% ABOVE the average
Dow ETF (DIA): DOWN 1.26%, volume 47% ABOVE the average
S&P ETF (SPY): DOWN 1.38%, volume 54% ABOVE the average
Russell Small Cap ETF (IWM): DOWN 1.45%, volume 27% ABOVE the average
::: SelflInvestors Leading Stocks :::
The Self Investors Leading Stocks Index is comprised of stocks in the Breakout Tracker, which is a database of the fastest growing companies near a breakout or having already broken out of a base. Leading stocks were hit hard again today as small to mid caps bear the brunt of the selling, but the selling wasn’t particularly intense again today.
Summary:
* Decliners led Advancers 303 to 39
* Advancers were up an average of 1.41% today, with volume 6% ABOVE average
* Decliners were down an average of 3.17% with volume 4% ABOVE average
* The total SI Leading Stocks Index was DOWN 2.65% today with volume 4% ABOVE average
::: Where’s the Money Flowing :::
Many investing websites provide leading industries based on price performance alone. However, without accompanying volume levels, this can sometimes be misleading. The only way that I know of to gauge industry/sector strength WITH volume levels is through the analysis of ETF’s. A couple years ago this was not possible, but as more traders/investors use ETF’s they become a much better tool for gauging the health of the market and seeing where the money is flowing (or not flowing). Using the proprietary SelfInvestors Demand Indicator score which measures price and volume movements, I’m able to quickly see which sectors/industries are seeing the greatest inflows of cash. For a detailed look at how I go about gauging sector/industry strength please see the following post: http://selfinvestors.com/si/industry_tracking/
* Current Leading Sectors/Industries (over last 30 trading days):
Just Bonds!
* Current Lagging Sectors/Industries (over last 30 trading days):
Broker/Dealers, Financial, Utilities, Materials, Semis
* Today’s Market Moving Industries/Sectors (UP):
None
* Today’s Market Moving Industries/Sectors (DOWN):
Homebuilders, Gold Miners, Transports, Materials, Water Resources
::: Stocks :::
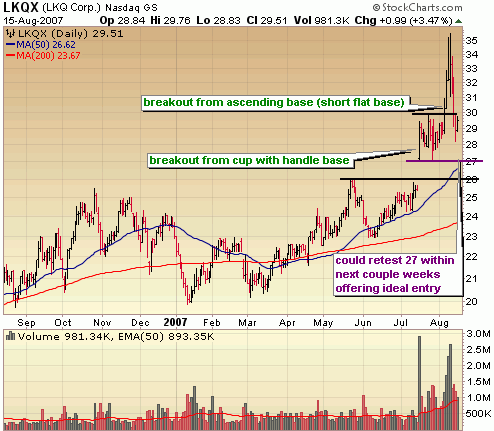
The stocks section will be an area where I highlight one stock selected from a group of stocks moving up with volume well above average and most likely breaking out of a base or consolidation. Today’s stock is LKQ Corp (LKQX), which broke out of an ascending base and quickly shot up 20% before retracing the entire move during recent market weakness.
ABOUT: LKQ Corporation is a provider of recycled light vehicle original equipment manufacturer (OEM) products and related services. The Company is also a provider of aftermarket collision replacement products and refurbished wheels. LKQ Corporation operates over 100 facilities offering its customers a range of replacement systems, components and parts to repair light vehicles. It participates in the market for recycled OEM products, as well as the market for collision repair aftermarket products. LKQ Corporation obtains aftermarket products and salvage vehicles from a variety of sources.
FUNDAMENTALS: KNXA is a very small company (just over 100 million in sales last year) but one that is experiencing a big growth spurt since first becoming profitable in 2005 when the company posted earnings of .40/share (compared to a loss of .22/share a year earlier). The company continued the earnings momentum last year by posting earning growth of 140%. This kind of growth isn’t expected to continue but estimates do call for growth of around 30% over the next couple years. Net margins are solid at around 13%, but ROE isn’t impressive at 8% and has been declining in the past couple years. All in all, this is a very good company but not what I would consider elite.
FUNDAMENTALS: LKQX is a company with a long history of growth. In fact, since turning profitable in ’01, it has posted impressive growth of 155%, 43%, 15%, 37% and 27% over the past 5 years and is expected to continue to post growth of 25 – 30%. This is organic growth behind strong sales. On the margin front, the company is just OK with net margin just above the industry average at 6%. Return on equity is solid at 12% and continues to rise year after year indicating strong management.
TECHNICAL: LKQX gapped up out of a cup with handle base on July 17th with record volume to new all time highs, paused in a short flat base then surged again another 20%. During this market correction, the stock has digested all of that 20% move and could go a bit lower from here, offering an ideal entry point. Sell volume still remains above average, so until sellers are showing signs of abating I’d avoid the stock. However, when that time comes I believe it will offer an outstanding entry, perhaps near the 50 day moving average around 27.

SELFINVESTORS RATING: With a total score of 50/60 (26/30 for fundamentals, 24/30 for technical), LKQ Corp (LKQX) is a very good breakout play.
Full Disclosure/Disclaimer: The stock of the day is by no means a buy recommendation. Please do your own research and make a personal decision based on your own tolerance for risk. I currently own a small position in LKQX and will be looking to add a little more when this pullback is complete.
Can’t argue with having a lot of cash right now. I think the next major move will be up, but it might not be ready to go quite yet. Tommorrow will be a very interesting day to say the least.
Hi Aaron, yeah cash is the best place to be for now. Should get the ‘ol dead cat bounce from here then its get shorty time again.