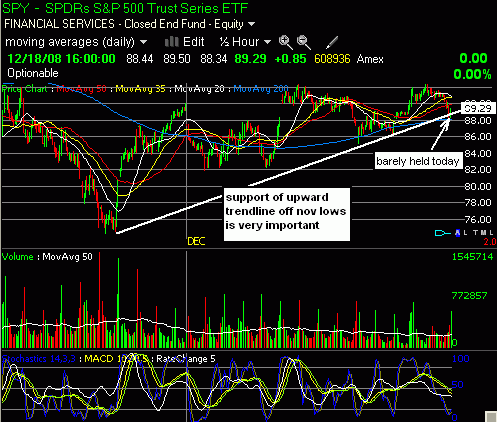
Just a quick heads up to let you all know what I’m keeping an eye on for tomorrow. Following that push above the 50 day moving averages in both the S&P and Dow, we have had two days of selling with today’s plunge putting the S&P and Dow back below support of their 50 day moving averages. The market remains somewhat bullish up here, but it’s critical that we hold the November upward trend line which I’ll be watching on the 30 min charts of the SPY, DIA and Q’s tomorrow. Below is a look at the 30 minute chart of the SPDR S&P500 ETF (SPY). You can see the trend line that was tested again today with a decent bounce in the last 30 minutes of trading to keep that level of support intact. This market can’t afford to take out today’s lows, so we need to hold the 88 level in the SPY by the end of the day tomorrow or I’ll be back in neutral to bearish mode. I’m fairly confident that it will given the resiliency of this market over the past few weeks and that fact we were able to hold that level today despite a credit downgrade of GE, the White House indication that bankruptcy may indeed be an option for GM and Chrysler as well as a poor Philly Fed number. Note also, the strong volume off support and oversold conditions on the 30 minute chart.. Let’s see where this market takes us tomorrow.
Your graph seems to be confusing. It is hard for us readers to understand it. I am not insulting you but would you make some blogs that must be readable and interesting blogs?Hoping you`ll understand me.The words are interesting but the graph was confusing.