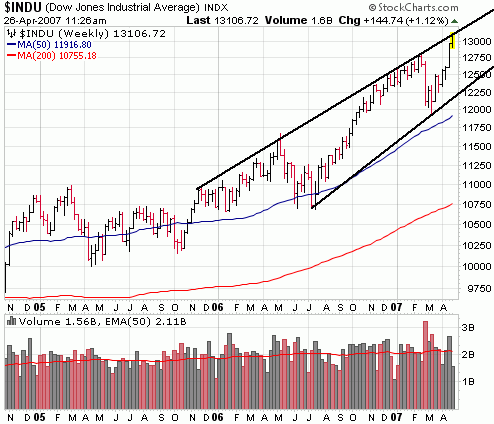
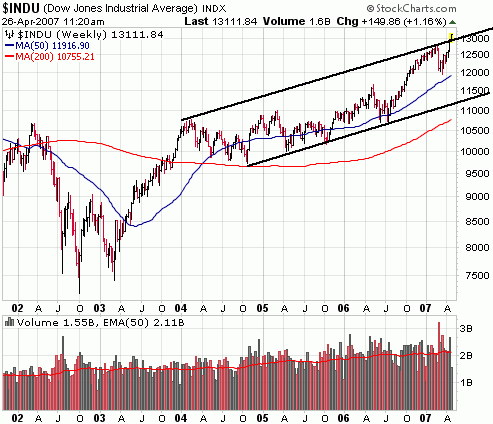
The following is an article from Daily Wealth, reprinted here with permission. It’s an interesting article that takes a look at the Dow’s recent 8 day winning streak and how the Dow has performed following similar streaks in the past. Based on historical trends, we can assume a better than 50/50 chance of further gains over varying time periods (chart below). It should be noted that if not for a down day in the Dow on April 23rd, we’d be looking at an 11 day winning streak (assuming today closes in the green). That has happened just 5 times. The recent winning streak creates excitement, but as the chart of the Dow below indicates, there is reason for caution at these levels. The Dow is hitting its upper trend line over a one year trend and above the upper trend line over a 3 year period.


When The Stock Market Does a "Joe DiMaggio"
By Ian Davis
April 26, 2007
Joe DiMaggio is sitting in his clubhouse sipping coffee and smoking a cigarette. The Yankees are in Washington to play a double header against the Senators. While DiMaggio relaxes between games, someone sneaks into the visitors’ dugout and steals his favorite bat…
This petty theft nearly ruins one of the greatest feats in baseball history.
You see, the date is June 24, 1941, and Joe DiMaggio is sitting on a 41-game hitting streak. He’s one game short of beating the record George Sisler set in 1922.
It’s only a "piece of wood" says DiMaggio, but in the second game of the double-header, he hasn’t had a hit in his first three at-bats. Finally, on his final walk to the plate, Tommy Henrich offers him his bat, and DiMaggio accepts.
Red Anderson’s first pitch nearly hits DiMaggio, almost ending his hitting streak. Then, on the second pitch DiMaggio connects, slapping a changeup pitch, into left field. Sisler’s record falls, and DiMaggio goes on to rack up the longest hitting streak to this day, 56 games.
The Dow equivalent of DiMaggio’s record hitting streak was its January 1987 run when it traded higher for 13 consecutive trading sessions. This is the largest streak of up-days in the history of the Dow (since 1928).
Recently, the Dow achieved a rare eight-day streak (between March 29 and April 10, 2007). Let’s take a look at how the Dow performed after these market rarities and if there is any way to profit from investing following these events.
Since 1928, the Dow has rallied for eight or more days only 48 times. This is few enough to make it a rare event, but sufficient to draw some meaningful conclusions. The following chart shows the number of Dow "hitting streaks" that lasted more than four days.
|
||||||||||||||||||||||
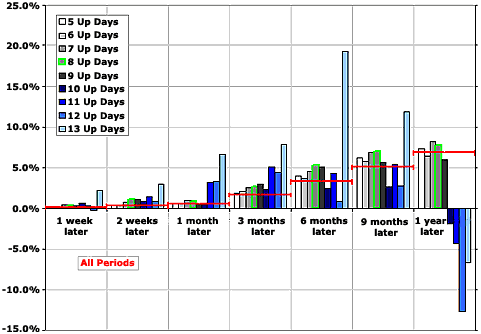
After the 13-day streak back in 1987, the stock market continued to perform exceptionally well for nine months after the streak ended. However, if you look a year forward, you see the Black Monday stock market crash, which would have erased your returns in one fell swoop.
The following chart shows the average performance one week, two weeks, one month, three months, six months, nine months, and one year after each of these hitting streaks. For most of these hitting streaks, the market continues to perform better than or on par with its long-term average. The only exceptions are the 10, 11, 12, and 13-day streaks. These exceptionally long streaks tend to lead to a period of market underperformance in the following 6-12 months.
Market Returns After Long Streches of Up Days

Since the Dow just underwent an eight-day hitting streak, let’s take a look at how the Dow may perform going forward by looking at past streaks.
The following table gives you a list of probabilities – based on previous occurrences – of the market posting a positive return and/or beating the market after a set period of time. I also tried to give you a sense of risk/reward by showing the ratio of the largest fall compared to the largest rally following these events.
|
For example, if you’d bought following every eight-day up streak since 1928, and held for three months, you would have achieved above-average returns more than 70% of the time. However you also would have experienced the most risk (the largest loss following this strategy was 1.74 times the size of the largest gain).
In conclusion, our hearts tell us that a long stretch of up-days is the mark of an overheating market, and we start to expect a correction. The statistics show otherwise.
Whether you invest for a week or a year, you are more likely to achieve better-than-average market returns by investing following long streaks of up days. The large downside risk of being wrong, however, probably nullifies this strategy.