 Google surprised everyone last night when they missed earnings estimates for just the second time in the 12 quarters since going public by posting earnings of 3.56/share (when you take out costs for employee stock compensation). That was 3 cents shy of analyst estimates and well below the whisper number of 3.75. Call it a case of not meeting lofty expectations from perhaps the most admired company in the world as well as higher one time costs which I’ll go into below. So, just as traders did after the bell, time to head for the exits right? No!! Maybe I’m a glass half full kind of guy but after reading through the reports and the entire transcript (thank you Seeking Alpha) I still feel good about Google and see this sell off as opportunity, not as a reason to head for the exits. Let’s run through the highlights of the quarter:
First the good….
– Revenue came in at a 58% increase over the year ago period which beat analyst estimates. No problem here.
– Revenue generated from Google.com properties grew an impressive 74% year over year and 9% sequentially. It was driven by global traffic growth and higher quality advertising.
– Adsense revenue increased 36% year over year but was flat sequentially due in part to seasonal trends but also due to the company cancelling accounts of unfavorable publishers (ie. made for adsense spam sites).
– International growth fueled by Europe now makes up 48% of revenues
– Traffic acquisitions costs decreased to 30% of total revenue, down from 31% in the first quarter
.. and the not so good…
You can see on the revenue side it was a great quarter. The problem was in the earnings per share number which was driven down below expectations due in part to much higher than anticipated costs associated with rampant hiring and what appears to be a higher one time cost associated with a revision of the employee bonus accrual methodology which led to a higher bonus accrual for this quarter.
Rampant Hiring
The number of new hires increased to 1548 this quarter compared to 1152 in the year ago quarter. That’s a whole lot of additional on site hair cuts, catered meals, oil changes, dry cleaning and whatever else it is that the company famously provides… not to mention stock options and bonuses. A few quotes:
"A second factor driving expenses was headcount growth, which led to higher payroll expenses. We added 1,548 employees in Q2, the majority in sales and marketing and engineering," said CFO George Reyes.
CEO Eric Schmidt acknowledged they will be more careful about hiring in the future:
"From a Google perspective, when we look at the quarter, one area we exceeded over our expense plan was headcount. We are very pleased with the talent that we’ve brought on board, but going forward we will watch this area very closely."
Higher Bonues Accrual
This is the one part of the transcript that in my opinion stood out the most and a big reason why I feel that the earnings miss this quarter was an aberration and not the beginning of a trend. If you read the transcript, you’ll see that analysts were keying on this as well. Some quotes…..
"One of the larger drivers of payroll expense was the company bonus plan. This was due in part to a revision of our bonus accrual methodology that will allow us to more proportionately recognize the related expenses each quarter. This all led to a higher bonus accrual in Q2, which includes a catch-up from Q1, and affected all expense line items…going forward it should be a more normalized bonus accrual process. This was just sort of a one-time inflection that we tried to do to true-up the bonus , " said CFO George Reyes.
CEO Eric Schmidt:
"In general, we don’t break out all the puts and takes on the changes in the accrual. What I would tell you is that we overspent against our own plan in the area of headcount, and some of it was related to this bonus accrual that I talked about; and some, because we hired a little faster than we had planned. In looking at it we thought, was this a mistake or not? We decided it was not a mistake, that in fact the kind of people we brought in are so good that we’re happy we did this. As I said earlier, we will continue to watch this very carefully in the future. "
Conclusion
Google is a company that has seen a deceleration of its growth every quarter for over 2 years now, so that trend continuing is no surpirse given the billions upon billions this company now generates every year. It’s just flat out difficult to maintain the kind of growth they were achieving. At some point, and I think that is beginning to happen, the company will settle into quarter over quarter growth of 30 – 40% which is outstanding for a company of this size. Yes, it’s time for Wall Street to lower expectations a bit and this quarter miss should go a long ways in achieving that. All in all, it was another great quarter tarnished a bit by what appear to be one time costs. This sell off in my opinion will offer opportunity.
Technicals
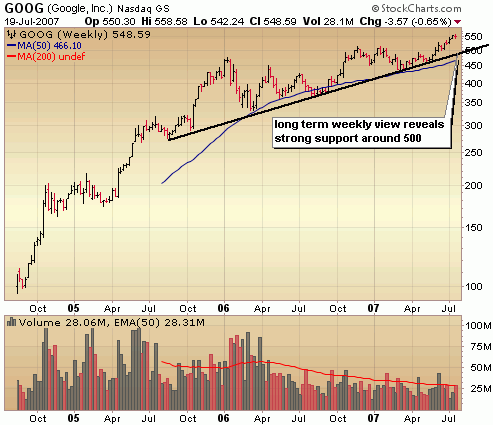
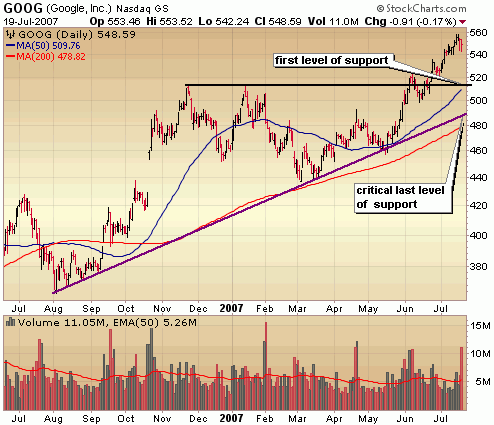
What can we expect in trading today? After hours the stock flirted with key support around 500 and this will remain a key area of support as I highlight below.
Here’s a look at the weekly chart, which reveals strong support around 500 at the 2 year upward trend line. Despite the headlines that a 40 point drop in Google creates, realize that it’s just a 7 – 8% drop and key support levels remain in place for now.
The daily chart reveals support levels on a more granular level – first level of support around where the previous breakout point and the 50 day moving average converge (lets call it 510 – 513). The last level of support for this stock is in the area of 480 – 490 which is an area where the 200 day moving average and the upward trend line converge.
I personally held my long term position in Google through this earnings report and will look at this dip as a buy opportunity. However, I won’t jump into it right away. It’s going to take some time for traders to sort out this report and for analyst to issue their reports. Once trading volume subsides to more normal levels and we get a clear idea of where exactly this stock will find support, I will be looking to add shares in this outstanding company.
 Google surprised everyone last night when they missed earnings estimates for just the second time in the 12 quarters since going public by posting earnings of 3.56/share (when you take out costs for employee stock compensation). That was 3 cents shy of analyst estimates and well below the whisper number of 3.75. Call it a case of not meeting lofty expectations from perhaps the most admired company in the world as well as higher one time costs which I’ll go into below. So, just as traders did after the bell, time to head for the exits right? No!! Maybe I’m a glass half full kind of guy but after reading through the reports and the entire transcript (thank you

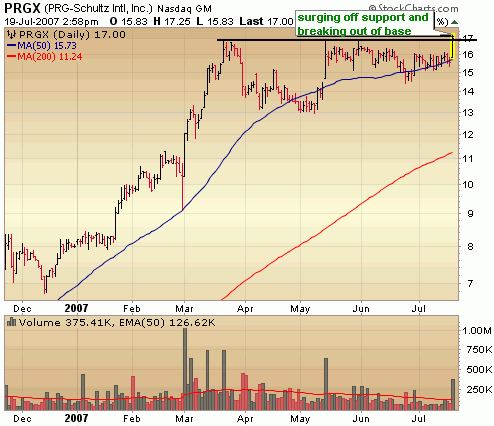
 Yesterday I highlighted a cup with handle breakout in Iconix Brands (ICON) and today I’ve got another cup with handle breakout for you in PRGX. While this is an excellent looking base showing significant demand and profit opportunity it should be noted that it isn’t a high quality company like Iconix is. This is a trade and nothing more. I’ve initiated a small position in this myself and am looking for a quick 15 – 20% gain over the next couple weeks.
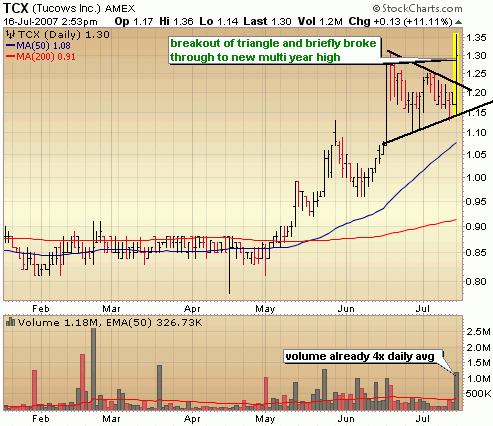
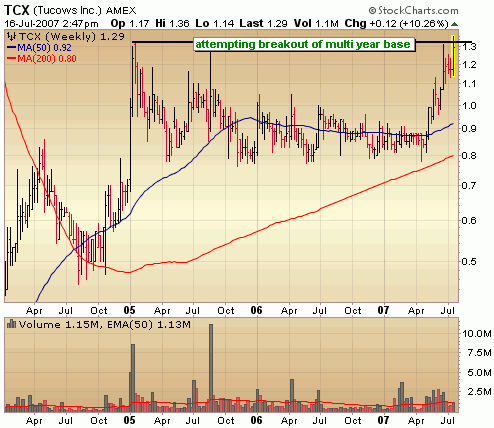
 Today I highlight a trade in a low priced stock which won’t be typical but I think the company is interesting enough and the chart bullish enough to warrant a mention. The company is Tucows.com and they are probably one of the the largest owners of virtual real estate (ie. domain names) in addition to providing internet services and downloadable software. Of the past several weeks, buyers have been stepping in with increasing vigor pusing the stock to its current levels which is right around resistance of the March 2005 highs. With the stock breaking out of a bullish triangle pattern today with volume that will come in at roughly 5x the daily average, it looks poised to ultimately break through to new multi year highs above 1.32.
 First there was the declined 1 billion dollar buyout offer from Yahoo and rumored 2 billion offer from Google.