Remain Cautious in No Man’s Land

 
 The market typically does well the week before a major holiday and Labor Day is no exception.  It certainly was an odd week of trading with jeckyl and hyde moves on Tuesday and Wednesday ultimately resulting in another "preholiday" positive gain, pushing the major indices further above their downward trendlines.  The technical action over the past couple weeks has improved but not to the point where I’m comfortable sounding the all clear alarm.  We can’t take much away from a volatile, light volume  trading week and keep in mind that the major indices are fast approaching big overhead resistance areas.  Until we begin testing key support and resistance levels with normal trading volumes, it’s best to remain largely in cash.  The market has come too far, too fast to initiate new long positions and the technical action is a bit too strong to pursue short positions aggressively.  I’ll call it no man’s land.

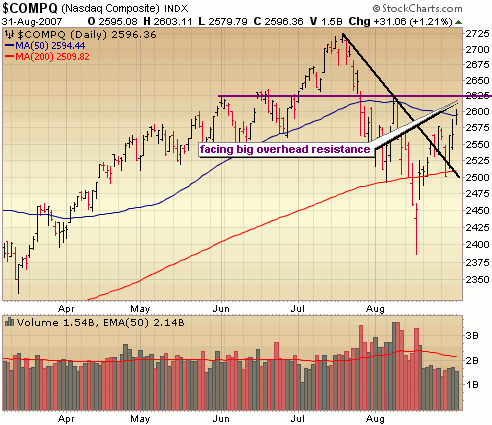
Let’s have a look at the Nasdaq.  When I say that the major indices have improved technically I’m specifically referring to the breach of their downward trend lines.  There has been no trouble with this area of resistance as you can see in the Nasdaq in the chart below.  However, big overhead resistance looms around the 50 day moving average and previous highs around 2625.  There is some room for the Nasdaq to push higher, but I think this bounce will be exhausted soon.

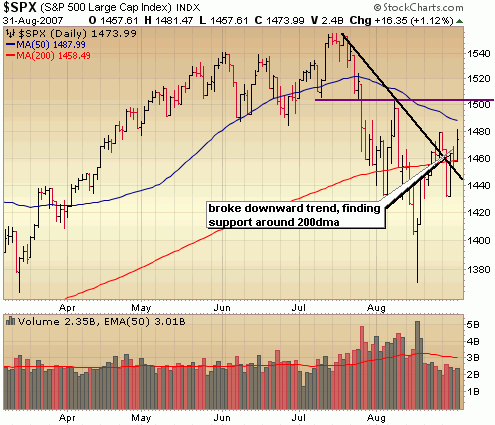
The S&P has shown some strength too by clearing the downward trend line (in black) but key resistance areas are on the horizon at the 50 day moving average and then around the August highs of 1500.  The downward  trend line may prove to be a new area of support so look for the S&P holding above this line as an indication of underlying strength. 


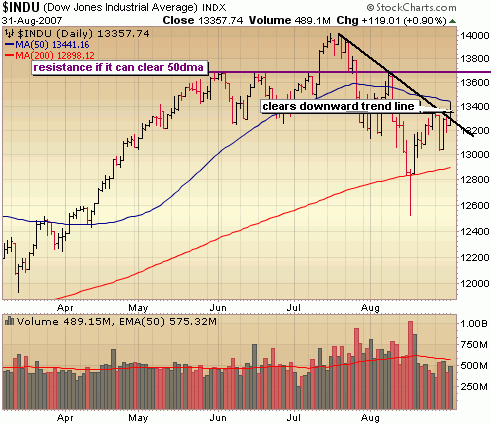
The Dow just cleared its downward trend line on Friday, so it’s lagging a bit.  Notice it hit resistance right at the 50 day moving average on Friday and retreated.. a sign that the push higher may be running out of gas.  If the Dow can clear Friday’s high we could very well see another couple hundred points higher to the next level of resistance around 13700.  I would be might tempted to short the heck out of the market if it gets anywhere close to this level next week.


 ::: Model Portfolio Update :::

The Model Portfolio sits largely in cash (70%) and will likely remain so probably through September while this correction plays out.  It remains a somewhat irrational market and difficult to read from both a fundamental and technical perspective making it tough to profit from either side of the market.  I’m continue to hold a couple long term core positions in Google and Cisco and am playing a few small short positions.  The year to date performance has edged up in the past couple weeks to 9.2%, still more than double the S&P500.

::: Best/Worst Performers :::

– Top 10 Performing Industries For the Week –

1. Home Improvement Stores: 6.35%
2. Aluminum: 4.50%
3. Major Airlines: 3.75%
4. Beverages – Brewers: 3.70%
5. Diversified Computer Systems: 3.60%
6. Personal Computers: 3.60%
7. Jewelry Stores:  3.50%
8. Broadcasting – Radio: 3.40%
9. Heavy Construction: 3.30%
10. Printed Circuit Boards: 3.00%

– Top 10 Worst Performing Industries For the Week –

1. Toy & Hobby Stores: -7.10%
2. Residential Construction: -5.75%
3. Surety & Title Insurance: -4.90%
4. Mortgage Investment: -3.75%
5. Banks – Pacific: -3.40%
6. Banks – Southeast: -3.00%
7. Investment Brokerage: -3.00%
8. Banks – Northeast: -2.70%
9. Banks – Mid Atlantic: -2.70%
10. Banks – Midwest: -2.65%

– Top 5 Best Performing ETFs For the Week –
 
1. Greater China Fund (GCH)  11.55%
2. Powershares China  (PGJ) 5.30%
3. Ishares China  (FXI) 4.65%
4. Claymore Bric (EEB) 4.05%
5. US Oil (USO) 4.00%

– Worst 5 Performing ETF’s –

1. Thai Fund (TTF)  -4.60%
2. US Natural Gas  (UNG) -4.35%
3. Ishares Home Construction (ITB) -3.50%
4. KBW Bank (KBE) -3.05%
5. Malaysia Fund (MAY)  -2.85%

:::  IPO’s Worth Watching for This Week :::

No IPO’s scheduled for the next couple weeks. 

::: Upcoming Economic Reports (9/3/07 – 9/7/07) :::

Monday:         Holiday
Tuesday:       Construction Spending, ISM Index, Auto/Truck Sales
Wednesday:  Pending Home Sales, Fed Beige Book, Crude Inventories
Thursday:      Initial Claims, Productivity (revis), ISM Services
Friday:            Nonfarm Payrolls, Unemployment Rate, Wholesale Inventories

::: Upcoming Notable Earnings Reports :::


Tuesday:

Guess (GES), Mobile TeleSystems (MBT)

Wednesday: 

J Crew (JCG)

Thursday:

Smith & Wesson (SWHC), Verifone Holdings (PAY), Focus Media (FMCN)

More Subprime Fallout: Greenpoint Mortgage Gone

Another mortgage company casualty after the bell today announced by Capital One (COF) during their earnings report.  In addition to cutting its earnings forecast from $7.15 to $5/share, COF announced that they would eliminate their Greenpoint mortgage unit (the 7th largest Alt A lender) and eliminate 1900 jobs.   According to the WSJ,   Capital One bought Greenpoint, which specialized in jumbo and Alt A loans less than a year ago in a 13.2 billion dollar deal.  With other large layoff announcements from Countrywide (CFC) and SunTrust  (STI) today alone and thousands more to come as other mortgage companies fold, you have to wonder just how much impact this will have on the economy from an employment perspective which has been largely ignored up to this point.  The housing boom was able to cushion the blow of many jobs being shipped overseas so the impact could be great.

Aerogel Miracle Chemical to Change the World? Aspen Aerogels & Cabot (CBT)

From what scientists are saying you would think that this "frozen smoke" will in fact save the world or at the very least have a major positive impact on everything from protecting the environment, to filtering water, to insulating our homes, to ensuring the safety of our military and firefighters all the way to creating better tennis rackets (Dunlop has created one).  It’s expected to rank right up there with Bakelite of the 1930’s, carbon fibre of the 80’s and silicone in the 90’s.

Aerogel was first created by Steven Kistler in 1931 as a result of a bet with another chemist and according to TimesOnline was later enhanced by NASA in order to catch dust from a Comet’s tail.  A company created by NASA called Aspen Aerogels eventually produced a stronger, more flexible version of the gel in 2002 which is being used in space suits for the first manned mission to Mars scheduled for 2018.

Look for all kinds of products to be outfitted with this material over the next several years as companies look to make products lighter and stronger.  Aspen Aerogels is still a private company so there isn’t a way to invest yet, but it will be a company worth watching over the next few years if and when they get bought out or pursue an IPO. 

However, there is another way to play the aerogel space for the time being – Cabot Corp (CBT), a company that is apparently in a race with Aspen to develop as many aerogel patents as possible. It produces a family of silica aerogels under the trade name Nanogel and is gaining wide acceptance for use in thermal protection, diffused light and sound reduction.  The company is also addressing the needs of oil and gas operators who are developing subsea fields or new LNG systems.  The company is not a an aerogel pure play, but also worth keeping an eye on.

 A video of this fascinating material:

What’s Different About This Housing Market Meltdown

Below is a reprint of an excellent article by Daily Wealth detailing the unraveling of the housing market.

What Caused the Housing Bust
By Porter Stansberry
August 18, 2007

Reprinted with permission by DailyWealth

Today, we take a break from our normal format to answer in detail a question regarding the current housing problem that must be on the minds of nearly all of our readers, as expressed by paid-up subscriber David Walker:

What is so unusual about the current times that so many smart people could be so catastrophically wrong?

Porter comment: What happened (and what is still happening) is simply leverage in reverse, or what people used to call a "run on the bank."

For nearly 10 years, as interest rates fell from 1995 to 2005, the mortgage and housing business boomed as more and more capital found its way into housing. With lower rates, more people could afford to buy houses. That was good. Unfortunately, it didn’t take long for some people to figure out that with rates so low, they could buy more than one. Or even nine or 10. As more money made its way into housing, prices for real estate went up – 20% a year for several years in some places. The higher prices created more equity… that could then be used as collateral for still more debt. This is what leads to a bubble.

Banks, hedge funds, and insurance companies were happy to fund the madness because they believed new "financial engineering" could take lower-quality home loans (like the kind with zero down payment) and transform these very risky loans, made at the top of the market, into AAA-rated securities. Let me go into some detail about how this worked.

Wall Street’s biggest banks (Goldman Sachs, Lehman Bros., Bear Stearns) would buy, say, $500 million worth of low-quality mortgages, underwritten by a mortgage broker, like NovaStar Financial. The individual mortgages – thousands of them at a time – were organized by type and geographic location into a new security, called a residential mortgage-backed security (RMBS).

Unlike a regular bond, whose coupon is paid by a single corporation and organized by maturity date, RMBS securities were organized into risk levels, or "tranches." Thousands of homeowners paid the interest and principal for each tranche. Rating agencies (like Moody’s) and other financial analysts, believed these large bundles of mortgages would be safer to own because the obligation was spread among thousands of separate borrowers and organized into different risk categories that, in theory, would protect the buyers. For example, the broker (like NovaStar) that originated the mortgages would be on the hook for any early defaults, which typically only occurred in fraudulently written mortgages. After that risk padding, the next 3%-5% of the defaults would be taken out of the "equity slice" of the RMBS.

The "equity slice" was the riskiest part of the RMBS. It was typically sold at a wide discount to the total value of the loans in this category, meaning that if defaults were less than expected, the buyer of this part of the package could make a capital gain in addition to a very high yield. Even if defaults were average, the buyer would still earn a nice yield.

Hedge funds loved this kind of security because the yield on it would cover the interest on the money the fund would borrow to buy it. Hedge funds could make double-digit capital gains annually, cost-free and risk-free… or so they thought. As long as home prices kept rising and interest rates kept falling, almost every RMBS was safe. Even if a buyer got into trouble, he could still sell his home for more than he paid or find a way to restructure the debt. On the way up, from 1995-2005, there were very few defaults. Everyone made money, which attracted still more money into the market.

After the equity tranche, typically one or two more risk levels offered higher yields at a lower-than-AAA rating. After those few, thin slices, the vast majority of the RMBS – usually 92% of the loan package – would be rated AAA. With an AAA rating, banks, brokerage firms, and insurance companies could own these mortgages – even the exotic mortgages with changing interest rates or no down payments. With the magic of financial engineering and by ordering the perceived risk, financial firms from all over the world could fill their balance sheets with higher-yielding mortgage debt that would pass muster with the regulators charged with making sure they held only the safest assets in reserve.

For a long time, this arrangement worked well for everyone. Wall Street’s banks made a fortune packaging these securities. They even added more layers of packaging – creating CDOs (collateralized debt obligation) and ABSs (asset-backed security) – which are like mutual funds that hold RMBS.

Buyers of these securities did well, too. Hedge funds made what looked like risk-free profits in the equity tranche for years and years.

Insurance companies, banks, and brokers were able to earn higher returns on assets by buying RMBS, CDOs, or ABSs instead of Treasury bonds or AAA-rated corporate debt. And because the collateral was considered AAA, financial institutions of all stripes were able to increase the size of their balance sheets by continuing to borrow against their RMBS inventory. This, in turn, supplied still more money to the mortgage market, which kept the mortgage brokers busy. Remember all the TV ads to refinance your mortgage and the teaser rate loans?

The cycle kept going – more mortgage securities, more leverage, more loans, more housing – until one day the marginal borrower blinked. We’ll never know whom or why… but somewhere out there, the "greater fool" failed to close on that next home or condo. Beginning in about the summer of 2005, the momentum began to slow… and then slowly… imperceptibly… it began to shift.

All the things the cycle had going for it from 1995 to 2005 began to turn the other way. Leverage, in reverse, is devastating.

The first sign of trouble was an unexpectedly high default rate in subprime mortgages. Beginning in early 2007, studies of 20-month-old subprime mortgages showed a default rate greater than 5%, much higher than expected. According to Countrywide Mortgage, the default rates on the riskiest loans made in 2005 and 2006 are expected to grow to as high as 20% – a new all-time record. The big jump in subprime defaults led to the first hedge-fund blowups, such as the May 2007 shutdown of Dillon Reed Capital Management, which lost $150 million in subprime investments in the first quarter of 2007.

Since Dillon Reed Capital, dozens of more funds have blown up as the "equity slice" in mortgage securities collapsed. Remember, these equity tranches were supposed to be the "speed bumps" that protected the rest of the buyers. With the safety net of the equity tranche removed, these huge securities will have to be downgraded by the rating agencies. For example, on July 10, Moody’s and Standard and Poor’s downgraded $12 billion of subprime-backed securities. On August 7, the same agencies warned that another $1 billion of "Alt-A" mortgage securities would also likely be downgraded.

Now… these downgrades and hedge-fund liquidations have hugely important consequences. Why? Because as hedge funds have to liquidate, they must sell their RMBSs, CDOs, and ABSs. This pushes prices for these securities down, which results in margin calls on other hedge funds that own the same troubled instruments. That, in turn, pushes them to sell, too.

Very quickly the "liquidity" – the amount of willing buyers for these types of mortgage-backed securities – disappeared. There are literally no bids for much of this paper. That’s why the subprime mortgage brokers – the Novastars and Fremonts – went out of business so quickly. Not only did they take a huge hit paying off the early defaults of their 2005 and 2006 mortgages, but the loans they held on their books were marked down, with no buyers available and their creditors demanding greater margin cover on their lines of credit… poof… The assets they owned were marked down, they couldn’t be readily sold, and they had no access to additional capital.

The failure of the subprime-mortgage structure – which started with higher-than-expected defaults, led to hedge fund wipeouts, and then to mortgage broker bankruptcies – might have been contained to only the subprime segment of the market. But… the risk spread because of the financial engineering.

With Wall Street wrapping together thousands of mortgages from different underwriters, it’s likely that hundreds of financial institutions around the world have traces of bad subprime and Alt-A mortgage debt on their books. Parts of these CDOs were rated AAA. Almost any financial institution could own them – especially hedge funds. Hedge fund investors quickly figured this out – and asked for their money back.

And so, in July, liquidity fears began to creep through the entire mortgage complex. Not because the mortgages themselves were all bad or even because the mortgage securities were all bad – but because all the market players knew a wave of selling, led by hedge funds, was on the way. Nobody wants to be the first buyer when they know thousands of sellers are lined up behind them.

The market "locked up." Nobody would buy mortgage bonds. And everyone needed to sell. Suddenly even Wall Street’s biggest banks – the very firms that created these mortgage securities – were suffering huge losses, as the bonds kept getting marked down as hedge funds and other leveraged speculators had to sell into a panicked market.

It’s a classic "run on the bank," except today the function of the traditional bank has been spread out among several institutions: mortgage brokers, Wall Street security firms, hedge-fund investors, and banks. The real problem is that the long-dated liabilities (a 30-year mortgage) were matched not by reliable depositors, but by fly-by-night hedge funds, which were themselves highly leveraged and subject to redemptions.

That’s why even as the top executives in these firms believed their mortgages were safe and sound, they can’t get the funding they need to hold onto them through the crisis. As Keynes predicted, the lives of every higher-leveraged financial institution is precarious: " The market can be irrational longer than you can remain solvent."

The hedge funds have no solution. Redemptions will force them to sell. They’ll continue to pressure the market, resulting in huge losses. Hundreds of funds will likely be liquidated.

Wall Street’s investment firms, if they can find additional capital to meet margin calls, might weather the storm… depending on how far it spreads. We saw a move in this direction this week when Goldman announced $3 billion in additional funding for its big hedge funds.

For most mortgage brokers, the party is over – goodnight. Something like 90% of them will be out of business by the end of the year.

——————————————————————-

UPDATE:

I received these comments from the CFO of a local homebuilder (pacific northwest) regarding the above article:

FWIW
 
Here’s the part I think where most people are underestimating the potential damage:
 
"Not because the mortgages themselves were all bad or even because the mortgage securities were all bad"
 
There’s a lot more bad mortgages out there.
 
Here’s why:
1) ARM rates have risen significantly since 2005.
2) Inventory of homes for sale  have increased signficantly since 2005.

3) Prices have softened since 2005.

and now, 4) Availability of loan funds have dried up significantly (for the reasons Porter states below) thereby decreasing available LTVs (eg. No Money Down & SubPrime deals are gone, Piggybacks are disappearing and Jumbos are getting priced up along w. the downpayment requirements) and increasing mortgage rates.
 
There are a significant number of 2/28 loans that reset this year and next.  These homeowners are caught between a rock and a hard spot.  They are facing lower home values, higher rates on their mortages and higher down payment requirements.
 
Those who put money down, locked in a long term rate and bought in an appreciating area shouldn’t face any problems.
 
The homeowners in the toughest jams are those who took out a 2/28 in 2005 with 0% down and a low "teaser" rate in a market with prices going down. Take such a homeowner in San Diego who paid and borrowed $500,000.  The value of your home has dropped 7%.  Your rate reset is adding 4% to your interest payments.  That will add a minimum of $1,700/month to your payment.  That’s over $25,000 a year pre tax.  If you refi, your new LTV may be 80% requiring a 20% downpayment equal to $93,000.  If you sell at the new price of $465,000 after closing costs you’ll still need $72,000 to pay off the outstanding loan.
 
I don’t care if you’re a subprime, Alt-A or prime borrower.  This is a difficult situation.  Pay $25,000 more a year, shell out $93,000 to refi, cough up $72,000 to close, or walk away?
 
Many of these homeowners (or their lenders who foreclose) will be forced to sell.  They’ll have to price accordingly.  It’s the most recent sales that establish market values.  I anticipate that Notices of Default will increase steeply, sales prices will drop, sales volume will continue to fall, and, inventory will stabilize as frustrated sellers pull their homes off the market.
Market Capitulates On Fed Discount Rate Cut, Offers Another Opportunity to Minimize Risk

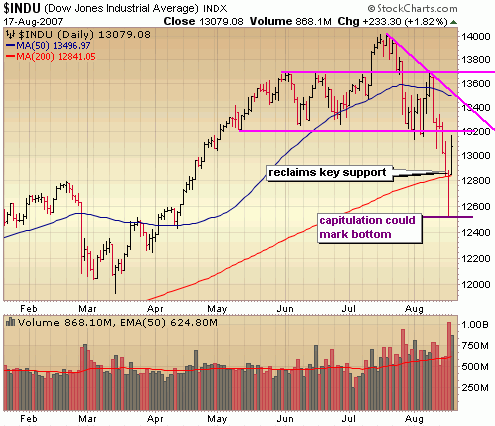
The wild ride continued this week, culminating in a dramatic nearly 600 point swing following the Fed move to cut the rate 50 basis points at the little used discount rate window.  The fact that the Fed is now acknowledging the concerns, wiling to take action and leaving open the possiblility of a cut of the fed funds rate probably had more to do with the jubilee than the rate cut itself but the oversold market was looking for Fed action and it got it.  It proved to be enough of a springboard to catapult both the Dow and Nasdaq past key resistance to reclaim key support levels. 

So can we forget about the issues plaguing this market now?  NO! Let’s keep in mind that the only sector really moving last week was financials.  Have a look at the broad market across semis, transportation and even gold and what you see is big losses again. Once the euphoria of the Fed move on Friday wears off, I fully expect the market to focus once again on the daily dose of subprime related meltdowns.  Also, let’s not forget that the Fed did acknowledge that it is quite concerned about what the credit concerns could do to do the economy which might have been lost in all the euphoria Friday.

From a technical standpoint, the massive capitulation we saw on Thursday likely marks a bottom at least in the short term.  However, with the market carving out the largest correction in 4 years in just a few weeks, it will take time to repair this kind of technical damage.  We will need time to carve out a base, which means that we’ll probably need to test those lows at some point before having a chance to take out all time highs.    What this bounce does is create opportunity.  Opportunity for those of you who have remained fully invested to lighten the load a bit and for the more aggressive, shorter term trader to begin initiating some new short positions.  Remember that bull markets die hard and offer multiple chances to get out.  We can’t possibly know how far this market will correct, so continuing to play cautiously until more signs of a bottom are in place is the smart thing to do.  There are still some major concerns out there across the board and we have only begun to scratch the surface.  Keep on eye on how the market reacts to this news because near the bottom the market will begin shrugging off the concerns and focusing on the positive.  We’re not there yet.

Two big positives in the Dow last week – capitulation on Thursday and reclaiming of key support of the 200 day moving average on Friday.  However, I think that any further moves up create greater risk for holding long positions and increasing profit potential for shorts.  The pink lines outline resistance levels.  If the Dow can bust through 13200, I think there is a very good chance of testing this new downward trend line around 13400.  Look for decreasing buy volume on any rally attempts as an indication that the bounce is nearing an end.

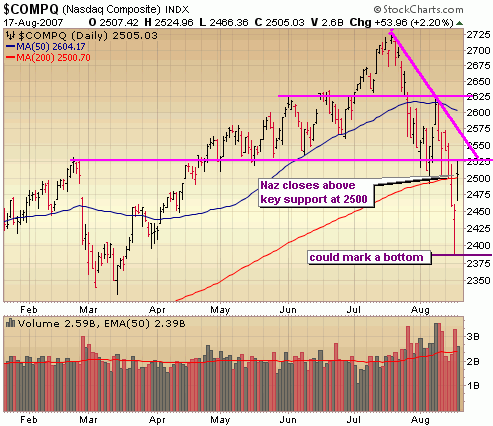
Same thing for the Nasdaq – capitulation ultimately led to a reclaiming of key support above 2500 but big resistance areas loom.  If it can muster enough strength to get above Friday’s highs then we will probably see a test of the short term downward trend around 2550.

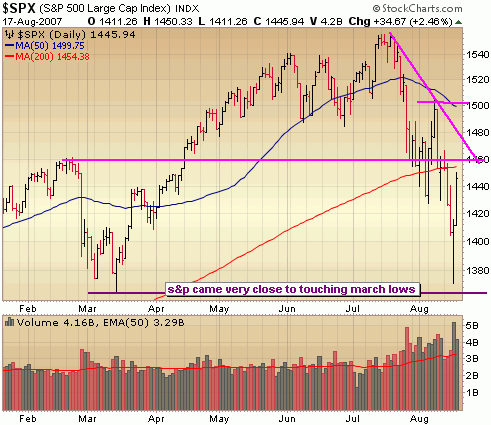
 Notice that the S&P nearly touched the March lows.  I think this area will prove to be a critical area of support that the S&P will ultimately retest before the correction is said and done.  It should be noted that unlike the Dow and Nasdaq, the S&P has NOT reclaimed key support levels.  It will be much more difficult for it to test its downward trendline around 1470.. it first needs to push through big resistance around 1455.

 ::: Model Portfolio Update :::

Yet another busy week for the portfolio as I closed out several long positions, captured some more gains on the short side and initiated a few more longs to capture some of the big bounce that began late Thursday.  I certainly haven’t been making large bets either way, but I have been fairly aggressive in the playing both sides of the market.  I was fortunate to sustain very little damage during the plunge in the first half of the week by closing small long positions quickly and then quickly locking in gains on the short side when it appeared the market was way overdue for a big bounce.  For the week, the portfolio took a minor hit, dropping 1.2% and remains well ahead of the S&P year to date performance with an 8.5% gain.  I’m not currently carrying any short positions, but will begin loading up again early this week especially if the market continues to rise with ligher volume like I think that it will.  The current allocation of the portfolio remains significantly in cash with 53%.

::: Best/Worst Performers :::

– Top 10 Performing Industries For the Week –

1. Regional – Southwest Banks: 8.40%
2. Savings & Loans: 5.60%
3. Regional – Pacific Banks: 4.90%
4. Regional – Southeast Banks: 4.60%
5. Regional – Midatlantic Banks: 4.35%
6. Regional – Midwest Banks: 4.25%
7. Office Supplies:  3.45%
8. Property & Casualty Insurance: 2.85%
9. Recreational Goods: 2.70%
10. Data Storage Devices: 2.45%

– Top 10 Worst Performing Industries For the Week –

1. Silver: -17.80%
2. Residential Construction: -10.55%
3. Nonmetallic Mineral & Mining: -9.60%
4. Gold: -8.65%
5. Wholesale Other: -8.30%
6. Air Services – Other: -8.20%
7. Copper: -8.10%
8. Regional Airlines: -7.90%
9. Major Airlines: -7.75%
10. Industrial Metals & Minerals: -7.65%

– Top 5 Best Performing ETFs For the Week –
 
1. KBW Regional Banking (KBW)  6.35%
2. KBW Bank (KBE) 4.60%
3. HLDRS Regional Bank (RKH) 4.50%
4. SPDR Financials (XLF) 3.45%
5. KBW Insurance (KIE) 2.60%

– Worst 5 Performing ETF’s –

1. Asa Gold (ASA)  -11.90%
2. Latin America Discovery Fund (LDF) -11.75%
3. Market Vectors Gold Miners (GDX) -11.60%
4. Turkish Investment Fund (TKF) -10.95%
5. Ishares Brazil (EWZ) -10.80%

:::  IPO’s Worth Watching for This Week :::

No IPO’s scheduled for the next couple weeks. 

::: Upcoming Economic Reports (8/20/07 – 8/24/07) :::

Monday:         Leading Indicators
Tuesday:       None
Wednesday:  Crude Inventories
Thursday:      Initial Claims, Leading Indicators
Friday:            Durable Orders, New Home Sales

::: Upcoming Notable Earnings Reports :::


Tuesday:

Dicks Sporting Goods (DKS)

Wednesday: 

Zumiez (ZUMZ), Gymboree (GYMB), BHP Billiton (BHP)

Thursday:

GameStop (GME)

                 
::: In Case You Missed It – SelfInvestors Blog Entries of the Past Week :::

1. Massive Capitulation; Stock of Day – Morningstar (MORN) Revisited

2. Dow Hits Key Support, Market Due for Bounce; Stock of Day – LKQ Corp (LKQX)

3. A History of Analyst Upgrades/Downgrades – Countrywide Financial (CFC), American Home Mortgage (AHM), Thornburg (TMA)

4. Sell Volume Light But Dow and S&P Take Out 4 Month Lows

5. Trade of the Day – Bounce to Resistance Offers Short Trade in Centurytel (CTL)

Nuclear Energy ETF (NLR) Arrives

With uranium prices skyrocketing over the past few years there has been big interest in a nuclear/uranium focused ETF in order to invest in this industry in a  diversified way.  The wait is now over with the arrival of the Market Vectors Nuclear Energy ETF (NLR) which began trading on the Amex on Wednesday of last week (it is off nearly 10% from the opening price).  I first wrote about a way to play the spot price of uranium several months ago but until now there wasn’t a way to play a basket of uranium/nuclear companies across the mining and nuclear plant operators.  The ETF seeks to replicate the performance of the DAXGlobal Nuclear Energy Index, a basket  of 38 nuclear related stocks maintained by Deutsche Borse.  About half of the ETF will be comprised of uranium miners while roughly 32% will be made up of nuclear plant builders.  Here are the top 10 holdings of the fund:

MITSUBISHI HEAVY MIH 9.70%
IHI CORP. IWJ 8.47%
HITACHI LTD HIA1 8.36%
URANIUM ONE INC. A9Y 6.41%
CAMECO CORP. CJ6 6.31%
ENERGY RES. A EJ7 5.30%
JGC CORP. 1963 JP 5.23%
KAJIMA CORP. KAJ 4.86%
IMPREGILO IPJ1 4.35%
PALADIN RES LTD PUR 4.24%


Nuclear power is already a major source of energy in some European countries as well as Japan, Canada and South Korea and will be in increasingly so in the US.

from www.timeofchange.org

Uranium stocks have been getting hammered recently as the price of uranium corrects a bit, but at some point it will be time again to get into the nuclear space and make some profit.  That time may come soon and should start with the Market Vectors Nuclear Energy ETF (NLR). 

::: >>>> For more analysis on the nuclear/uranium ETF click here

Massive Capitulation; Stock of Day – Morningstar (MORN) Revisited

I mentioned yesterday "the Dow has hit major support here at the 200 day moving average and the upward trend line around 12800 but as we’ve seen with major support levels in both the Nasdaq and S&P, the momentum to the downside puts this major support level at risk".   Many times areas of big support such as this support area in the Dow don’t provide support right at the line, particularly when emotions are high and fear based selling kicks in.  Rather, you often get some kind of capitulation – a large flush of weak hands, people scrambling to get sell orders in.  Essentially throwing in the towel.  An exhaustion of weak hand selling, bargain hunting and some big time short covering can fuel unbelievable rallies as we saw today.  After all that, the Dow still has support of its 200 day moving average and upward trend line.  The lows of today will act as a line in the sand, an area of significant support.   The move at the end of the day today was forceful and it is enough of a springboard for a dead cat bounce.  However, let’s keep in mind that most of the move today was in the worst hit industries such as financial, homebuilers and REIT’s.  Has anything changed really? No.  The market was way oversold and just needs to retrace some of the downward move.  As I’ve said before the big money will be made on the short side and any bounces, particularly weak volume bounces provide areas for short entries.  You have to believe that there are lots of people out there that have been piling up significant losses are just itching to get out with a wash or much smaller losses.  We have room to run a bit here, but this is NOT the time to be getting aggressive on the long side.  Patience.  I’ll have a full run down of the charts in the Weekly Report on Sunday night.  

::: Major Indices Performance – The Numbers :::

(Note: volume averages are based on the average over the past 50 days)
Data as of 4:00EST – End of Day August 16th 2007

Nasdaq: DOWN .32% today with volume 38% BELOW  average
Nasdaq ETF (QQQQ) DOWN .98%, volume 146% ABOVE average
Dow: DOWN .12%, with volume 64% ABOVE the average
Dow ETF (DIA): UP .23%, volume 162% ABOVE the average
S&P ETF (SPY): UP .75%, volume 154% ABOVE the average
Russell Small Cap ETF (IWM): 2.06%, volume 199% ABOVE the average

::: SelflInvestors Leading Stocks :::

The Self Investors Leading Stocks Index is comprised of stocks in the Breakout Tracker, which is a database of the fastest growing companies near a breakout or having already broken out of a base.  Leading stocks did not do well today despite the big market reversal.

Summary:

* Decliners led Advancers 213 to 129
* Advancers were up an average of 2.34% today, with volume 43% ABOVE average
* Decliners were down an average of 3.06% with volume 83% ABOVE average
* The total SI Leading Stocks Index was DOWN 1.02% today with volume 68% ABOVE average

::: Where’s the Money Flowing :::

Many investing websites provide leading industries based on price performance alone. However, without accompanying volume levels, this can sometimes be misleading.  The only way that I know of to gauge industry/sector strength WITH volume levels is through the analysis of ETF’s.  A couple years ago this was not possible, but as more traders/investors use ETF’s they become a much better tool for gauging the health of the market and seeing where the money is flowing (or not flowing).  Using the proprietary SelfInvestors Demand Indicator score which measures price and volume movements, I’m able to quickly see which sectors/industries are seeing the greatest inflows of cash.  For a detailed look at how I go about gauging sector/industry strength please see the following post: http://selfinvestors.com/si/industry_tracking/

* Current Leading Sectors/Industries (over last 30 trading days):  
Still Just Bonds!
                                          
* Current Lagging Sectors/Industries (over last 30 trading days): 
Broker/Dealers, Gold Miners, Utilities, Materials, Retail

* Today’s Market Moving Industries/Sectors (UP):
Regional Banks, REITs, Homebuilders, Financial

* Today’s Market Moving Industries/Sectors (DOWN):
Gold, Gold Miners, International Real Estate

::: Stocks :::

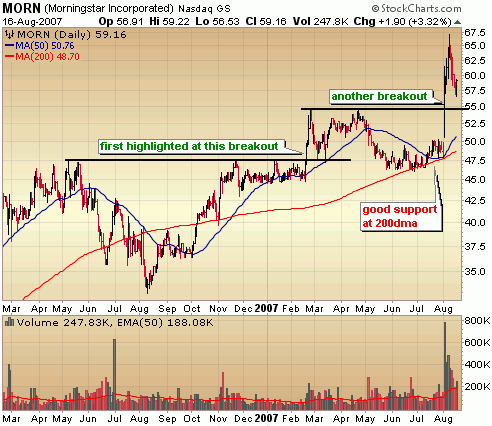
The stocks section will be an area where I highlight one stock selected from a group of stocks moving up with volume well above average and most likely breaking out of a base or consolidation.  Today’s stock is a stock I covered back in February when it first broke out of a base – Morningstar (MORN).  Most of the leading stocks that I track that moved with volume today were stocks that had beaten down  and were recovering from oversold conditions.  Morningstar (MORN) was one of the few near all time highs that moved with volume.  See my previous commentary on Morningstar (MORN).  Here’s an updated look at the current technical action:

I first highlighted the stock when it broke out above 47 back in February.  It quickly spiked 20% higher before settling into another base.  It wasn’t until the company reported outstanding earnings that the stock gapped up with record volume out of a cup with no handle base to a new all time high.  Very bullish action.  The stock is now digesting some of those gains and nearing another entry point.  I’m going to be looking to get in between 55 – 57.


Full Disclosure/Disclaimer: The stock of the day is by no means a buy recommendation.  Please do your own research and make a personal decision based on your own tolerance for risk.  I currently do not own a position in Morningstar (MORN)

Dow Hits Key Support, Market Due for Bounce; Stock of Day – LKQ Corp (LKQX)

Today was yesterday, it was Ground Hog’s Day.  Nothing changed and everything is the same except for one thing which I’ll get to in a minute.  Just like yesterday, decent economic data wasn’t enough to overcome the credit concerns.  A fairly tame reading on CPI and healthy regional manufacturing (even news of Buffet buying some BAC) weren’t enough to offset the daily dose of downgrades and credit concern comments.   Today was Ground Hog’s Day but with a change in strategy.  It’s time to begin paring back short positions and keeping the eyeballs peeled for opportunity on the long side.  Not long term opportunity, but bounce opportunity in the short term on the long side.  Let’s go to the charts:

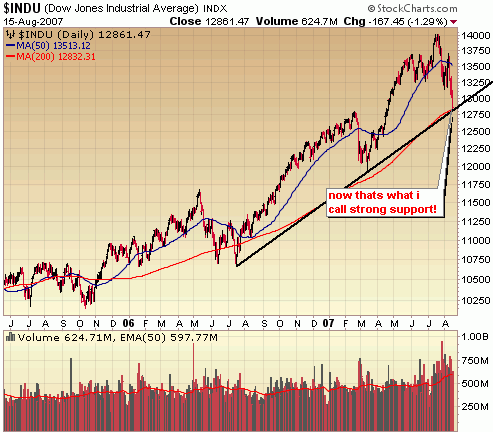
The Dow has hit major support here at the 200 day moving average and the upward trend line around 12800 but as we’ve seen with major support levels in both the Nasdaq and S&P, the momentum to the downside puts this major support level at risk.  However, I think we are getting closer and closer to a significant bounce in the market.  What I’ll be doing at some point tomorrow is paring back short positions and begin looking for the best long opportunities to dabble in.  I continue to believe that the best place for most investors right now is cash.

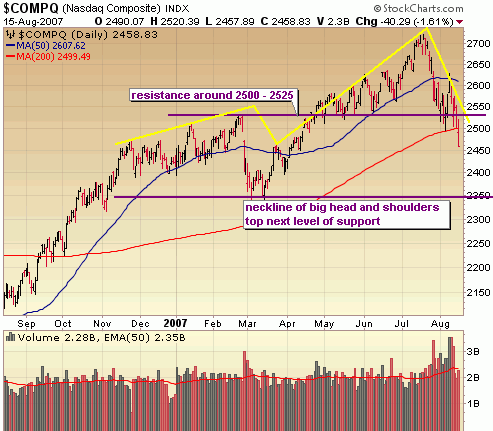
The Nasdaq took out very important support around 2500, setting it up for a test of the next level of significant support around 2350 at some point, which is the neckline of a large head and shoulders topping formation.  Before that happens though we should get a sizable bounce to test resistance at the area around the top of the shoulder and 200 day moving average (~2525).

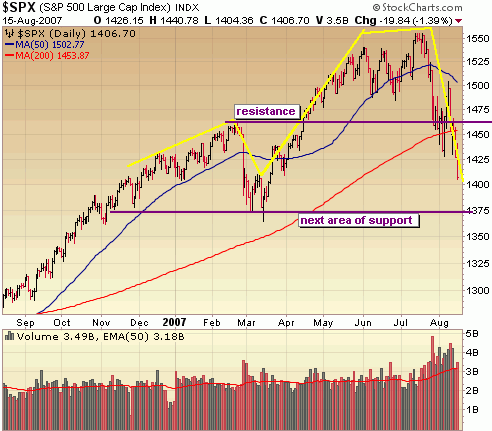
The S&P is much closer to the next key level of support around the neckline of a big head and shoulders formation.  I still think we’ll test resistance before it hits that level but I certainly wouldn’t be making large bets that that will happen.  As I mentioned above I’m paring back short positions and "looking" for good bounce plays on the long side.

::: Major Indices Performance – The Numbers :::

(Note: volume averages are based on the average over the past 50 days)
Data as of 4:00EST – End of Day August 15th 2007

Nasdaq: DOWN 1.6% today with volume 2% BELOW  average
Nasdaq ETF (QQQQ) DOWN 1.9%, volume 46% ABOVE average
Dow: DOWN 1.29%, with volume 4% ABOVE the average
Dow ETF (DIA): DOWN 1.26%, volume 47% ABOVE the average
S&P ETF (SPY): DOWN 1.38%, volume 54% ABOVE the average
Russell Small Cap ETF (IWM): DOWN 1.45%, volume 27% ABOVE the average

::: SelflInvestors Leading Stocks :::

The Self Investors Leading Stocks Index is comprised of stocks in the Breakout Tracker, which is a database of the fastest growing companies near a breakout or having already broken out of a base.  Leading stocks were hit hard again today as small to mid caps bear the brunt of the selling, but the selling wasn’t particularly intense again today.

Summary:

* Decliners led Advancers 303 to 39
* Advancers were up an average of 1.41% today, with volume 6% ABOVE average
* Decliners were down an average of 3.17% with volume 4% ABOVE average
* The total SI Leading Stocks Index was DOWN 2.65% today with volume 4% ABOVE average

::: Where’s the Money Flowing :::

Many investing websites provide leading industries based on price performance alone. However, without accompanying volume levels, this can sometimes be misleading.  The only way that I know of to gauge industry/sector strength WITH volume levels is through the analysis of ETF’s.  A couple years ago this was not possible, but as more traders/investors use ETF’s they become a much better tool for gauging the health of the market and seeing where the money is flowing (or not flowing).  Using the proprietary SelfInvestors Demand Indicator score which measures price and volume movements, I’m able to quickly see which sectors/industries are seeing the greatest inflows of cash.  For a detailed look at how I go about gauging sector/industry strength please see the following post: http://selfinvestors.com/si/industry_tracking/

* Current Leading Sectors/Industries (over last 30 trading days):  
Just Bonds!
                                          
* Current Lagging Sectors/Industries (over last 30 trading days): 
Broker/Dealers, Financial, Utilities, Materials, Semis

* Today’s Market Moving Industries/Sectors (UP):
None

* Today’s Market Moving Industries/Sectors (DOWN):
Homebuilders, Gold Miners, Transports, Materials, Water Resources

::: Stocks :::

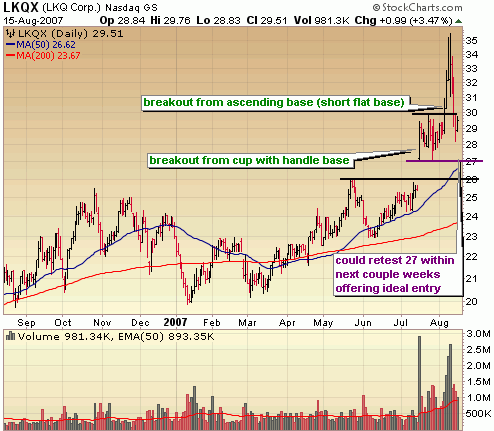
The stocks section will be an area where I highlight one stock selected from a group of stocks moving up with volume well above average and most likely breaking out of a base or consolidation.  Today’s stock is LKQ Corp (LKQX), which broke out of an ascending base and quickly shot up 20% before retracing the entire move during recent market weakness.

ABOUT:  LKQ Corporation is a provider of recycled light vehicle original equipment manufacturer (OEM) products and related services. The Company is also a provider of aftermarket collision replacement products and refurbished wheels. LKQ Corporation operates over 100 facilities offering its customers a range of replacement systems, components and parts to repair light vehicles. It participates in the market for recycled OEM products, as well as the market for collision repair aftermarket products. LKQ Corporation obtains aftermarket products and salvage vehicles from a variety of sources.
FUNDAMENTALS: KNXA is a very small company (just over 100 million in sales last year) but one that is experiencing a big growth spurt since first becoming profitable in 2005 when the company posted earnings of .40/share (compared to a loss of .22/share a year earlier).  The company continued the earnings momentum  last year by posting earning growth of 140%.  This kind of growth isn’t expected to continue but estimates do call for growth of around 30% over the next couple years.  Net margins are solid at around 13%, but ROE isn’t impressive at 8% and has been declining in the past couple years.  All in all, this is a very good company but not what I would consider elite.

FUNDAMENTALS:  LKQX is a company with a long history of growth.  In fact, since turning profitable in ’01, it has posted impressive growth of 155%, 43%, 15%, 37% and 27% over the past 5 years and is expected to continue to post growth of 25 – 30%.  This is organic growth behind strong sales.  On the margin front, the company is just OK with net margin just above the industry average at 6%.  Return on equity is solid at 12% and continues to rise year after year indicating strong management. 

TECHNICAL:  LKQX gapped up out of a cup with handle base on July 17th with record volume to new all time highs, paused in a short flat base then surged again another 20%.  During this market correction, the stock has digested all of that 20% move and could go a bit lower from here, offering an ideal entry point.  Sell volume still remains above average, so until sellers are showing signs of abating I’d avoid the stock.  However, when that time comes I believe it will offer an outstanding entry, perhaps near the 50 day moving average around 27.

SELFINVESTORS RATING: With a total score of 50/60 (26/30 for fundamentals, 24/30 for technical), LKQ Corp (LKQX) is a very good breakout play.

Full Disclosure/Disclaimer: The stock of the day is by no means a buy recommendation.  Please do your own research and make a personal decision based on your own tolerance for risk.  I currently own a small position in LKQX and will be looking to add a little more when this pullback is complete.

ETF, IPO & Breakout Stocks Analysis, Tracking & Research