Gold continues to run up nearly every day, enticing a growing number of johnny come lately’s to join the party. You’ve seen the headlines.. Gold $2000, $4000/oz. Could we see those kinds of numbers? Maybe, but analysts that make those kinds of predictions are just looking to create publicity for themselves and publishers looking for a good headline.
I like to take a different approach and analyze it from a supply/demand angle using technical analysis. Late last year was my last detailed analysis of gold and I predicted that a top in gold could come at the 1200 – 1300 level.
“What I see happening is some kind of climactic run in gold over the course of a few months with gains of 20 – 30%. That’s not a number pulled out of a hat, but based on previous runs from previous bases. Notice how the farther up you get into the rally, the returns diminish as the base quality deteriorates. Take a look at any big move in a stock and you’ll see this similar pattern. It’s reasonable to assume that the returns from this breakout will be less than what we saw with the 2007 breakout.. so somewhere around 20 – 30%. If the price of gold gets into that 1200 – 1300/oz area I’d be looking for some major topping action! A climax run in gold over the next few months followed by massive selling on the part of institutions may be the end of a nearly 10 year bull run in gold.”
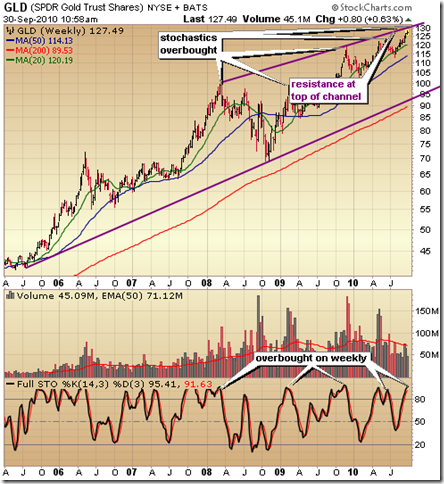
I expected gold would reach that level a bit earlier than it has, but we’re darn close to 1300 which happens to the next big level of resistance for gold and an area where a correction will likely take place. It’s much too soon to call $1300 a major top in gold and we could certainly take out $1300 at some point, but now is no time to be adding to gold and for many not a bad place to take some profits off the table.
Here’s a look at the current chart of the SPDR Gold ETF (GLD). Two important aspects of the chart to point out. One is the fact that GLD is overbought on the weekly chart once again. Take a look and see what happened to GLD the last four times we hit overbought on the weekly chart. The first time it led to a major correction of 30% in 2008 and three minor corrections since. We’re overbought again up around the 1300 level and it’s not out of the realm of possibility to see another 30% correction to test the bottom of the channel around 95 – 100. The second important component of this chart is that the 130 level coincides with resistance at the top of the channel (purple line)
===> You can get a free daily technical analysis of GLD here
