Running through 150 or so charts of ETF’s and closed end funds provide a good read on the overall market and where the money is flowing or not flowing whatever the case may be. Obviously, the current environment is leading to mostly breakdowns in the charts. There were no breakouts, with the exception of the S&P Biotech ETF (XBI) which briefly touched all time highs during the week. Clean Energy (PBW) also looks very strong but it hasn’t cleared all time highs quite yet. On to the round of breakdowns….
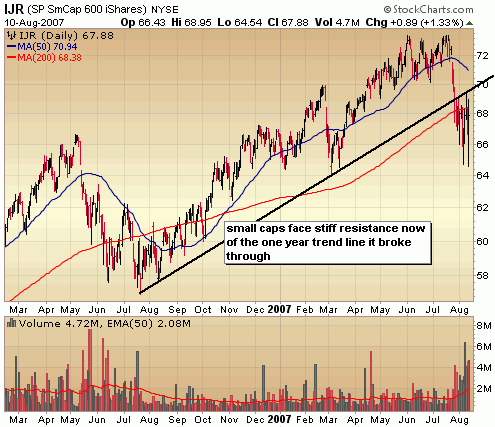
Starting with a broader scale, the Ishares Small Caps ETF (IJR) has taken out the steeper one year trend line but it should be noted that the longer 3 year trend line at around 65 is still intact. If we take out those lows we’re in trouble. I think there is a very real possibility of that happening but it will probably be several weeks before that happens.
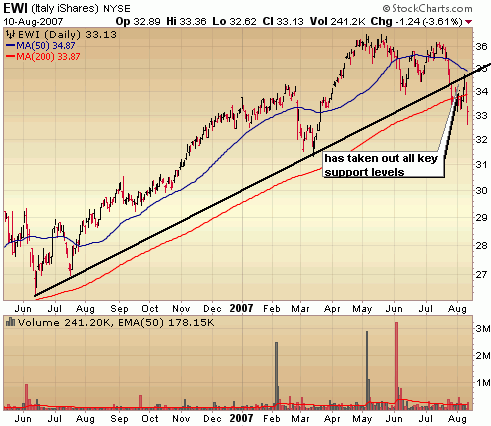
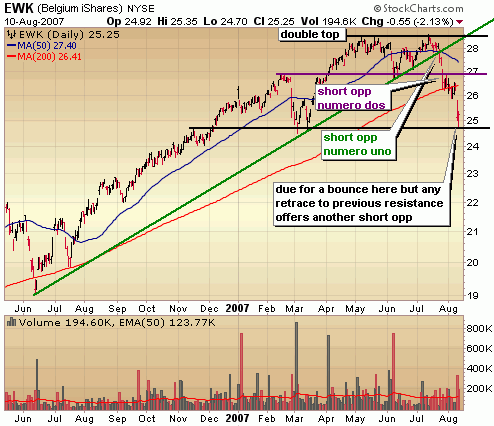
I’m seeing more European ETF’s breaking down with Italy (EWI) and Belgium (EWK) leading the way. It should be noted that many other country ETF’s are still holding up for the most part (this would include "emerged" market high flyers such as Brazil, Mexico and China).
I’ve made a mess of this chart but what it’s I’m trying to say is that it’s taken out several key support levels but due for a bounce. The double top indicated that well.. a top might have formed. When it broke the upward trend line (in green), it confirmed the top. That followed with further weakness and it busted through the bottom of the channel (in purple) and eventually took out support of the 200 day moving average. I’d be looking to get in a short opportunity if it can bounce to the 26.50 – 27 range.
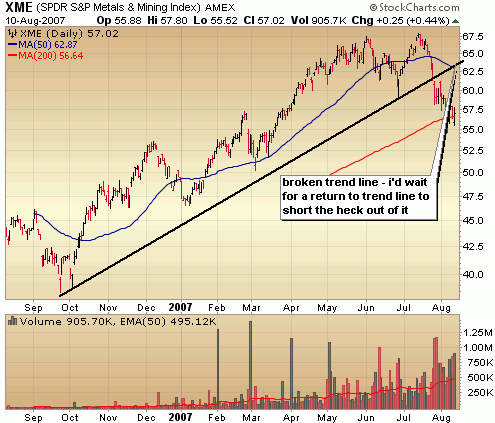
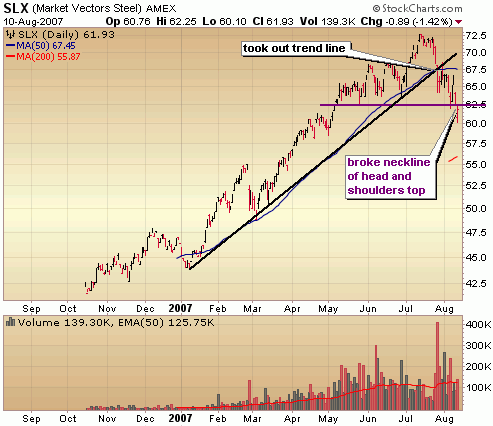
One other theme for this week is the breakdown in metals, specifically the Market Vectors Steel Fund (SLX) & the SPDR Metals & Mining ETF (XME).
Head and shoulders topping formation in the SLX which along the way resulted in a break of the trend line.. also oversold now but any weak bounce would provide shorting opportunities.
Metals & Mining are breaking down after their torrid run, but oversold in the short term. If it returns to new resistance around the upward trend line and 200 day moving average around 63, I’d be shorting the heck out of it. Notice the double top in this one as well.
