Category Archives: Weekly/After Stock Market Review Archives

Every Sunday evening a full market review is sent to members of SelfInvestors.com which provides commentary on the technical and economic picture, a review of the SelfInvestors Model Portfolio, the best/worst performing industries and ETF’s for the week, IPOs to watch, upcoming economic reports as well as notable earnings reports. In addition, on days when the market makes a significant move I’ll highlight the technical action discussing price/volume movements and support/resistance levels, industries/sectors leading and lagging the market as well as a Stock of the Day. In the past these were sent in the middle of the trading day but I’ve since begun publishing them and sending them to members after the market closes. These reports will be archived here as well.

Market Due for Bounce, But Bull Run On Last Legs; Hot IPO – Virtusa (VRTU)


I’ve done enough rambling about the fundamentals of the market recently, so this week I’m going right to the charts.  From a technical perspective, the market is a bit oversold but given the conviction behind the selling late last week, there is signficant danger of the major indices taking out critical long term trendlines in the coming weeks.  However, before that happens, we’ll probably see some kind of oversold bounce shortly.  Remember: Bull markets die hard.  The market often provides several opportunities to get it right.  That is, if you held on to positions through this sell off or missed the multitude of short opportunities, you will be given another chance to adjust.

Note: Chris Perruna has a nice list of links to check out which discuss the recent market plunge
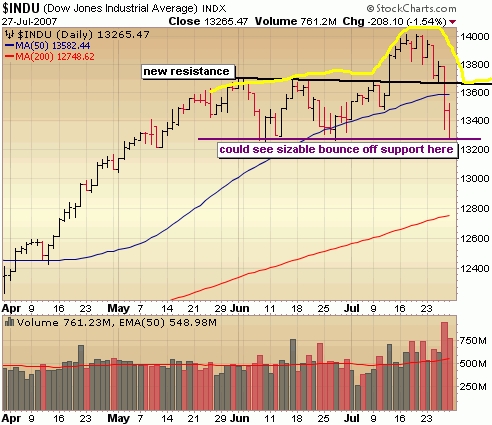
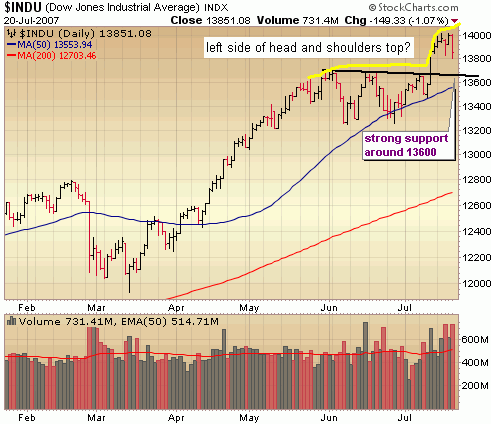
I’ve been discussing the emerging head and shoulders formations that have been forming, most distinctly in the Dow.  Notice there is significant support right at these levels which could ultimately be the neckline of the head and shoulders pattern.  If in fact this is the pattern that is being carved out, we should expect a bounce from here to around 13,650 or roughly 400 points in the next few weeks followed by sideways action.  Then we’ll need to watch that neckline support, a break of which would most likely signal further deterioration to the point of the previous breakout back in April and the 200 day moving average around 12800.

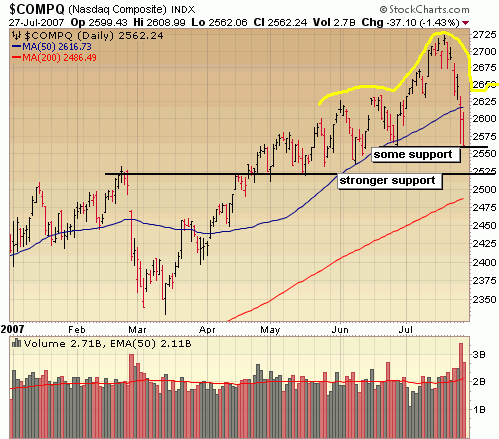
The Nasdaq could also be carving out a head and shoulders pattern, albeit a steeper one and could get a bounce here to form the right shoulder of the patter in the coming weeks.  Notice the index has nearly wiped out all of the gain it has made since the breakout in April.  This will be a significant area of support and an area to watch closely.

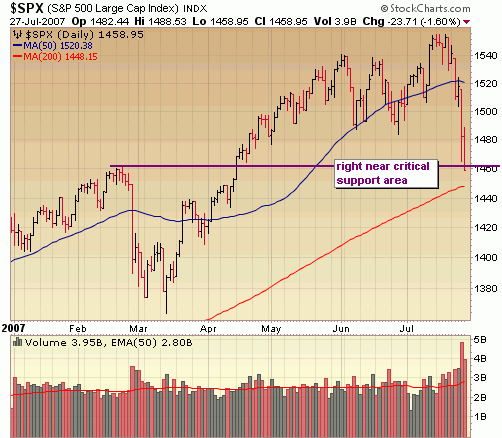
In just 4 trading days, the S&P has given up nearly the entire gain since breaking out in April and finds itself at a critical area of support.  I would expect an oversold bounce but if it eventually takes out key support around 1450 – 1460, I think you can declare this bull market officially dead.

 
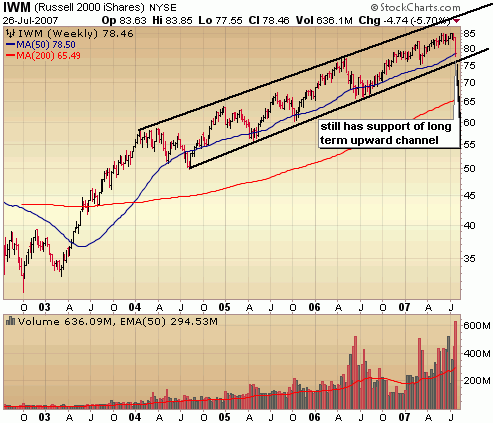
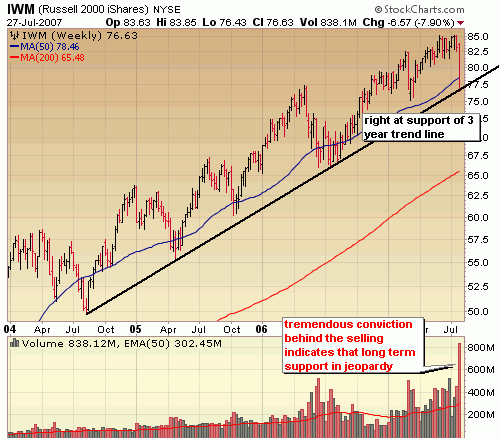
The long term weekly chart of the Russell 2000 ETF indicates it’s on the brink of a meltdown.  Currrently it is right at support of a long term 3 year trend line with much momentum behind it to the downside (as indicated by that big volume spike).  It looks to me like it’s just a matter of time before that trend line is broken and that does not bode well for this market.  The bulls have removed the party hats with one foot out the door.  If big buying doesn’t come in soon, it could be lights out.
 

 ::: Model Portfolio Update :::

In an email to premium members this week I expressed my displeasure with the performance of the Model Portfolio in the last few months and felt that I had become too hesitant and conservative which has hurt my performance.  The performance hasn’t been awful (a bit below the S&P), but certainly not anywhere close to my yearly goal of doubling to tripling the performance of the S&P.  I mentioned that from here on out, members would begin to see the portfolio traded in a way that mimicked how I trade my personal accounts… with no hesitation. .. trading what I see and acting immediately.  It’s not always easy to take on the risk necessary for success, particularly when you’re detailing your performance each and every week for all the world to see.  In this business you’re only as good as how you’ve performed over the previous few months.. Very few care about your long term success, they want to get rich and they want it now.  This is the most likely the result of conditioning from late night infomercials, spam mail claiming riches, and ridiculous claims of producing overnight millionaires from the multitudes of "pretender" advisory services out there.  This misinformation and lack of integrity is one of the main reasons I got into this business in the first place.  I’ll gladly trade a few extra members seeking overnight riches for a service of integrity made up of long term members who are genuinely interested in achieving sustained long term profits year after year. 

On Tuesday, the market dropped big.  No big deal on the surface.. heck we’ve seen drops like this on a few occasions this year only to see the market come roaring back to new all time highs.  It was differrent this time.  The subprime and housing issues that had largely been ignored due to the Fed minimizing their impact (which they continue to do) were for the first time a real concern for the market.  On that day, my entire database of leading stocks dropped by over 3%, the first time I have seen a drop over 3% in this index since I put it together.  The character of the market had changed and I was going to act with no hesitation.  On Wednesday, the market gapped up and provided the perfect short entry opportunity.  Itook it and continued to close long positions and initiate several short positions to shift the portfolio from one that was biased on the long side to one that was biased on the short side.  In all, 6 long positions were closed, replaced with 4 short positions.  This time around the strategy paid off big, resulting in a gain when the major indices dropped 4 – 5%.  In just two days, the Model Portfolio went from lagging the S&P by 3% to more than doubling the performance year to date.  I don’t highlight this to boast, I highlight this to remind those trading your own accounts that there will be difficult time when you question your abilities.  Stay focused, stay positive, trust yourself, trade what you see and don’t hesitate.  If you do those things you will emerge from the peaks and valleys of this difficult business and emerge with great success over the long term. 

::: Best/Worst Performers :::

– Top 10 Performing Industries For the Week –

1. Diagnostic Substances: 10.90%
2. Catalog & Mail Order Houses: 1.95%
3. Security Software & Services: .85%
4. Medical Equipment Wholesale: .40%
5. Research Service: .35%
6. Personal Products: .05%
7. Aerospace/Defense:  0%
8. Biotechnology: -.08%
9. Specialized Health Services: -.45%
10. Water Utilities: -.95%

– Top 10 Worst Performing Industries For the Week –

1. Rubber & Plastics: -13.85%
2. Trucks & Other Vehicles: -13.60%
3. Toy & Hobby Stores: -12.50%
4. REIT – Hotel/Motel: -11.20%
5. Gold: -11.20%
6. REIT – Healthcare Facilities: -11.15%
7. REIT – Office: -10.50%
8. Silver: -10.50%
9. Industrial Metals & Minerals: -10.22%
10. Residential Construction: -10.15%

– Top 5 Best Performing ETFs For the Week –
 
1. Indonesia (IF)  23.00%
2. Gold Miners (GDX) 4.20%
3. Turkish Investment Fund (TKF) 4.20%
4. HLDRS Internet Architecture (IAH) 2.85%
5. Ishares Oil Equipment & Services (IEZ) 2.80%

– Worst 5 Performing ETF’s –

1. HLDRS Internet Infrastructure (IIH)  -11.90%
2. SPDR Metals & Mining (XME) -11.30%
3. Ishares Home Construction (ITB) -11.15%
4. SPDR Homebuilders (XHB) -10.40%
5. Powershares Energy Exploration (PXE) -9.70%

:::  IPO’s Worth Watching for This Week :::

1. Virtusa (VRTU): the company provides a variety of software development and information technology services, including software engineering, application development, training, maintenance, systems design, and legacy migration. Virtusa’s customers come from industries such as financial services, telecommunications, manufacturing, and retail, including BT Group, Thomson Healthcare, and Vignette. It boasts operations in the US, UK, India, and Sri Lanka.Trading set to begin on Friday.

2.  Concho Resources (CXO): Concho Resources explores and develops properties, located primarily in the Permian Basin region of eastern New Mexico and the western area of Texas, for the production of oil and gas. It also owns properties in North Dakota and Arkansas. More than half of the company’s 467 billion cu. ft. in proven reserves is made up of crude oil while the rest consists of natural gas. Concho Resources gets two-thirds of its sales from crude oil. Customers include such energy marketers as Navajo Refining Company (53% of sales) and DCP Midstream (18%). The company has over 80 producing wells in operation.   Trading set to begin on Thursday.

3.  Genpact Limited (G):  The company got its start in 1997 as the India-based business process services operation for GE Capital, GE’s financial services unit. Today it manages business processes (sales & marketing analytics; financial services core operations & collections; and supply chain, finance & accounting, information technology, and enterprise application services) for companies worldwide. Since 2005 (when Genpact became an independent company), it has inked contracts with over 35 clients in industries such as banking and finance, insurance, manufacturing, transportation, and healthcare. GE continues to account for the majority (74%) of Genpact’s revenue.   Trading set to begin on Thursday.

4. Sucampo Pharma  (SCMP): Sucampo works with a group of compounds derived from functional fatty acids, called prostones; it uses prostones in the development of therapies for the treatment of age-related gastrointestinal, vascular, and central nervous system diseases and disorders. Its main hope, AMITIZA (lubiprostone), was approved in 2006 for the treatment of chronic idiopathic constipation; other applications for AMITIZA, including treatment of irritable bowel syndrome, are in the works. Trading set to begin on Thursday.

::: Upcoming Economic Reports (7/30/07 – 8/3/07) :::

Monday:         None
Tuesday:       Personal Income / Spending, PCE Inflation, Chicago PMI, Construction Spending, Consumer Confidence
Wednesday:  ISM Index, Pending Home Sales, Crude Inventories, Auto & Truck Sales
Thursday:      Initial Claims, Factory Orders
Friday:            Nonfarm Payrolls, Unemployment Rate, Hourly Earnings, Average Workweek, ISM Services

::: Notable Upcoming Earnings Reports I’ll Be Watching This Week :::

Monday:

Superior Energy Services (SPN), DXP Enterprises (DXPE), ValueClick (VCLK), Silicon Motion Technology (SIMO), Vulcan Materials (VMC), Monster Worldwide (MNST), CB Richard Ellis Group (CBG), CTC Media (CTCM), Manitowac (MTW), Actuate (ACTU), Interactive Intelligence (ININ)

Tuesday:

First Solar  (FSLR), Companhia Vale do Rio Doce (RIO), Buffalo Wild Wings (BWLD), BE Aerospace (BEAV), Hologic (HOLX), Chipotle Mexican Grill (CMG), Trimble Navigation (TRMB), NYMEX Holdings (NMX), United Therapeutics (UTHR), Cameron Intl (CAM), Ritchie Bros Auctioneers (RBA), General Cable (BGC), Coach (COH), Vistaprint (VPRT), Under Armour (UA)

Wednesday: 

Oceaneering Intl (OII), Globalsantafe (GSF), Dolby Laboratories (DLB), Liquidity Services (LQDT), Central European Distribution (CEDC), Houston Wire & Cable (HWCC), NATCO Group (NTG), Garmin (GRMN), Transocean (RIG), Mastercard (MA), Noble Energy (NBL), Helmerich & Payne (HP), Gmarket (GMKT)
                 
Thursday:

Pride International (PDE), Bucyrus International (BUCY), Cbeyond (CBEY), Morningstar (MORN), Green Mountain Coffee (GMCR), Visual Sciences (VSCN), Radiation Therapy Services (RTSX), Diodes (DIOD), Jones Soda (JSDA), DealerTrack (TRAK), Techwell (TWLL), Rowan Companies (RDC), Tower Group (TWGP), Gildan Activewear (GIL), GFI Group (GFIG), CommVault Systems (CVLT), WellCare Health Plans (WCG), Flotek Industries (FTK), Rio Tinto (RTP)

Friday:

Silver Wheaton (SLW), Tenaris (TS), Hercules Offshore (HERO)

::: In Case You Missed It – SelfInvestors Blog Entries of the Past Week :::

1. Leading Stocks Take Earnings Hit – New Oriental (EDU), Millicom (MICC), Atheros (ATHR)

2. LBO Mania Done, A Great Depression for Housing?

3. Earnings Movers – Ladish (LDSH) & SeaBright Insurance (SEAB) Breakout to All Time Highs

4. Relief Rally

5. Stericycle (SRCL) & Crocs (CROX) New All Time Highs; Netgear (NTGR) Crushed
Relief Rally

Today we got the much anticipated relief rally… to the downside.  Relief from the never ending barrage of "Dow 14,000" blurbs and flashing alerts from CNBC.  Ok I’m done bashing them.. I’ll leave it to the other blogs to do that since they do a much better job.  Suffice it to say I’m disgusted with some of the comments that have been made .. maybe another post for another day.  The point is that we needed this move today to wring out the excess and exuberance.. to throw some sensibility back into the market by (and now the talking heads) taking a more serious look at the underlying problems in the economy that have been bubbling but largely ignored (insert Fed officials here).  The fact is that this economy is still in a state of extremes that began with the internet bubble mania of the late 90’s, resulting in the market crash, which led to rate cut after rate cut, which fueled the housing boom and the LBO boom, which fueled……. another market crash?  Probably not, but you have to believe that there has to be an equal an opposite reaction of fear to the amount of runaway greed we have seen lately. That doesn’t paint a purdy picture, but hopefully it will eventually lead to a more normalized economic environment where extremes are thing of the past….

Anyway, I’m not an economist and just thinking out loud.. I’m a  technical trader and key off the charts.  I mentioned on Tuesday, that the character of this market had changed with the big move down.  The market, which had done such a good job of sweeping the underlying issues under the rug was beginning to take notice.  Bull runs die when the market begins finding any bad news to move on which we saw following the Bill Gross and Countrywide CEO comments.  The move up on Thursday was a gift.. an opportunity to close out some long positions and get short before the confirmation move below key support levels today.  How bad was it today? There isn’t any other way to describe it other than ugly with sell volume coming in at record levels and key support levels taken out left and right.  On the bright side, the market did rally a bit at the end of the day and most importantly, the market still looks OK when you look at the big picture on the weekly charts.  There is a bit of room to run to the downside before we start approaching what I would call the bull market / bear market mendoza lines.  Let’s have a look:

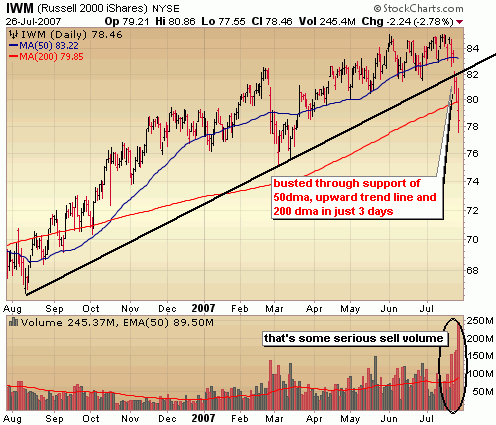
I’ll start with the Russell Tracking Index ETF (IWM), comprised of the small ones and the weakest of the indices.  The daily chart indicates the severity of the damage in the short term as the index took out 3 key support levels in the past 3 days, but the long term perspective shows that we’re still within the confines of an upward trend for now.  Key support in the IWM is around 76.

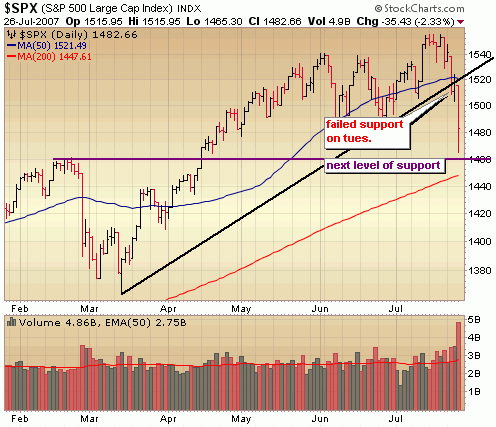
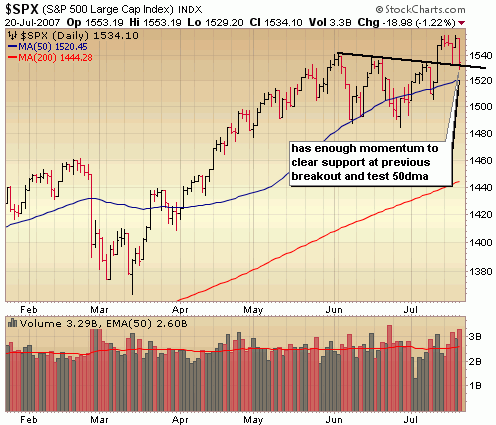
The S&P busted through a few key support levels as well but retains support around the area of the April breakout and 200 day moving average. 

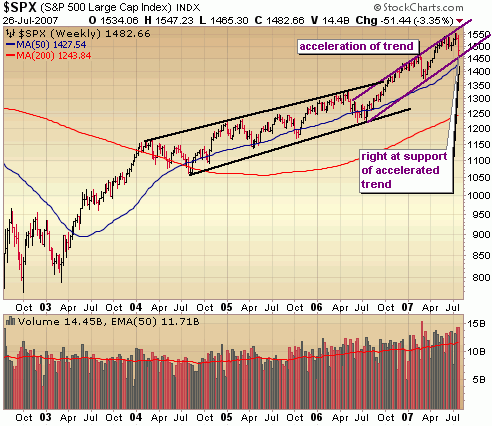
The weekly view of the S&P indicates that despite the sell off of the past few days, it still has support at the bottom of an accelerated channel and would have to drop another 100 points before it hits the longer term channel.  Key support in the S&P from here is around 1460.

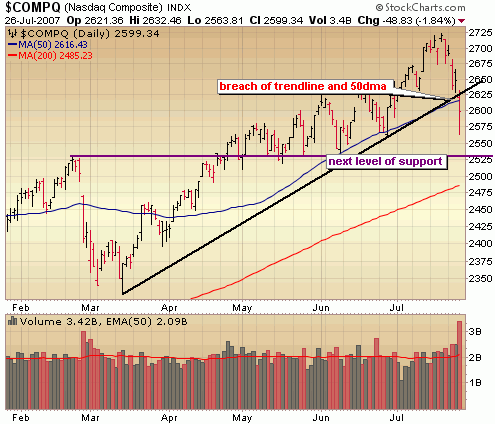
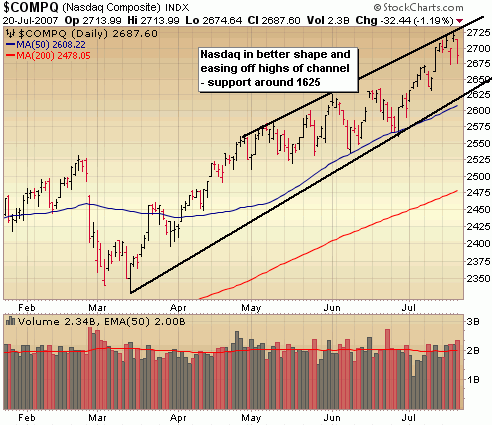
The Nasdaq daily shows the break of key support at the upward trend line and 50 day moving average today which is a new resistance area for the index.  I do think we’ll see some kind of bounce to this resistance before we ultimately head lower.  Such a move would provide another area to initiate short positions and/or cut losses / lock in gains.  Next level of support is around 2525.

::: Major Indices Performance – The Numbers :::

Distribution across all indices.

(Note: volume averages are based on the average over the past 50 days)
Data as of 4:00EST – End of Day July 26thth 2007

Nasdaq: DOWN 1.84% today with volume 63% ABOVE average
Nasdaq ETF (QQQQ) DOWN .85%, volume 161% ABOVE average
Dow: DOWN 2.26%, with volume 75% ABOVE the average
Dow ETF (DIA): DOWN 2.03%, volume 220% ABOVE the average
S&P ETF (SPY): DOWN 2.37%, volume 212% ABOVe the average
Russell Small Cap ETF (IWM): DOWN 2.78%, volume 189% ABOVE the average

::: SelflInvestors Leading Stocks :::

The Self Investors Leading Stocks Index is comprised of stocks in the Breakout Tracker, which is a database of the fastest growing companies near a breakout or having already broken out of a base.  Small caps were hit the hardest again today, but surprisingly they actually fared a bit better today than they did on Tuesday.

Summary:

* Decliners led Advancers 353 to 43

* Advancers were up an average of 3.2% today, with volume 132% ABOVE average
* Decliners were down an average of 3.08% with volume 34% ABOVE average
* The total SI Leading Stocks Index was DOWN 2.59% today with volume 76% ABOVE average

::: Where’s the Money Flowing :::

Many investing websites provide leading industries based on price performance alone. However, without accompanying volume levels, this can sometimes be misleading.  The only way that I know of to gauge industry/sector strength WITH volume levels is through the analysis of ETF’s.  A couple years ago this was not possible, but as more traders/investors use ETF’s they become a much better tool for gauging the health of the market and seeing where the money is flowing (or not flowing).  Using the proprietary SelfInvestors Demand Indicator score which measures price and volume movements, I’m able to quickly see which sectors/industries are seeing the greatest inflows of cash.  For a detailed look at how I go about gauging sector/industry strength please see the following post: http://selfinvestors.com/si/industry_tracking/

* Current Leading Sectors/Industries (over last 30 trading days):  
Networking, Clean Energy, Software, Commodities, Technology
                                          
* Current Lagging Sectors/Industries (over last 30 trading days): 
Broker Dealers, Utilities, Home Construction, Financials, Consumer Discretionary

* Today’s Market Moving Industries/Sectors (UP with volume):
Bonds

* Today’s Market Moving Industries/Sectors (DOWN with volume):
Internet Infrastructure, Real Estate, Energy, Basic Materials, Gold, Homebuilders

::: Stocks :::

The stocks section will be an area where I highlight one stock selected from a group of stocks moving up with volume well above average and most likely breaking out of a base or consolidation. 

Sorry, no stock of the day today.

LBO Mania Done, A Great Depression for Housing?

You won’t ever hear that the LBO boom is over or that the depreciation in housing is reaching levels not seen since the Great Depression from the Fed or any government official for that matter.  The truth might be seen as irresponsible, sending markets tumbling across the world.  So, the Fed has been carefully spoon feeding us the truth by transitioning from telling us that the subprime / housing issue was contained to finally acknowledging that the subprime and housing issue has deteriorated and is worse than expected.  So Bernanke told us last week.  Today, the sugar coating was removed as PIMCO’s Bill Gross and Countrywide Financial CEO Angelo Mozilo told us how they really feel. 

From Bill Gross:

" Both borrowers and lenders may have bitten off more than they can chew, and even those that swallow their hot dogs whole – Nathan’s Famous Coney Island style – are having a serious bout of indigestion.’

‘That growing lack of confidence – more so than the defaults of two Bear Stearns hedge funds and the threat of more to come – has frozen future lending and backed up the market for high yield new issues such that it resembles a constipated owl: absolutely nothing is moving.’

‘The tide appears to be going out for levered equity financiers and in for the passive owl money managers of the debt market."

"No longer therefore will stocks be supported so effortlessly by the double-barreled impact of LBOs and company buybacks. The U.S. economy in turn will not benefit from this tidal shift and increasing cost of financing. The Fed tightens credit by raising short-term rates but rarely, if ever, have they raised yields by 150 basis points in a month and a half’s time as has occurred in the high yield market."

Bill Gross’ entire August outlook is a  good read, check it out.

.. and from Mr. Doom, Countrywide CEO

"During the quarter, softening home prices continued to affect many areas of the country and delinquencies and defaults continued to rise across all mortgage product categories as a result. Due to these adverse conditions, the Company incurred increased credit-related costs in the quarter, primarily related to its investments in prime home equity loans."

Perhaps we can no longer call this just a subprime issue!

"We are experiencing home price depreciation almost like never before, with the exception of the Great Depression"

Did he say the Great Depression?  Perhaps a poor choice of words that may have spooked the markets a bit more than need be, but you get the idea… the housing market isn’t recovering anytime soon.

Today’s remarks certainly instilled some fear in the minds of traders, but it really isn’t anything all that new.  It’s just that after shrugging off bad news after bad news (which is what happens in a bull run), the bulls finally relinquished and today, for whatever reason, the news mattered.  The selling was significant enough to create a change of character in this market, possibly creating a market of opportunity sellers rather than a market of dip buyers as we’ve seen over the past several months.  That remains to be seen.  It’s important to realize that while technically this market has some problems, all indices retain key The S&P took out the 50 day moving average and dropped a hair below its upward trend line and the Russell 2000 is already fast approaching its 200 day moving average.   Both the Dow and Nasdaq have a bit further to go before testing key support levels.  The area around Nasdaq 2620 and Dow 13600 will certainly be watched closely

After the bell, Amazon reported another blow out quarter and was up 20% after hours at one point, but it may not be enough to stem the red tide tomorrow.  All in all, if you weren’t playing conservatively before today, you certainly should be now.  Preserve that capital!

::: Major Indices Performance – The Numbers :::

(Note: volume averages are based on the average over the past 50 days)
Data as of 4:00EST – End of Day July 24thth 2007

Nasdaq: DOWN 1.89% today with volume 24% ABOVE average
Nasdaq ETF (QQQQ) DOWN 1.48%, volume 47% ABOVE average
Dow: DOWN 1.62%, with volume 24% ABOVE the average
Dow ETF (DIA): DOWN 1.39%, volume 45% ABOVE the average
S&P ETF (SPY): DOWN 1.73%, volume 78% ABOVe the average
Russell Small Cap ETF (IWM): DOWN 2.39%, volume 96% ABOVE the average

::: SelflInvestors Leading Stocks :::

The Self Investors Leading Stocks Index is comprised of stocks in the Breakout Tracker, which is a database of the fastest growing companies near a breakout or having already broken out of a base.  Small caps were hit the hardest today, so it’s no surprise that Leading Stocks were hammered as well.  The AVERAGE percentage decline in leading stocks was over 3% today!  I don’t recall ever seeing that since I started tracking this information.

Summary:

* Decliners led Advancers 365 to 31
* Advancers were up an average of 1.57% today, with volume 68% ABOVE average
* Decliners were down an average of 3.08% with volume 34% ABOVE average
* The total SI Leading Stocks Index was DOWN 2.71% today with volume 37% ABOVE average

::: Where’s the Money Flowing :::

Many investing websites provide leading industries based on price performance alone. However, without accompanying volume levels, this can sometimes be misleading.  The only way that I know of to gauge industry/sector strength WITH volume levels is through the analysis of ETF’s.  A couple years ago this was not possible, but as more traders/investors use ETF’s they become a much better tool for gauging the health of the market and seeing where the money is flowing (or not flowing).  Using the proprietary SelfInvestors Demand Indicator score which measures price and volume movements, I’m able to quickly see which sectors/industries are seeing the greatest inflows of cash.  For a detailed look at how I go about gauging sector/industry strength please see the following post: http://selfinvestors.com/si/industry_tracking/

* Current Leading Sectors/Industries (over last 30 trading days): 
Basic Materials, Clean Energy, Networking, Technology, Gold Miners, Software
                                          
* Current Lagging Sectors/Industries (over last 30 trading days): 
Broker Dealers, Home Construction, Financial, Banks, Homebuilders

* Today’s Market Moving Industries/Sectors (UP with volume):
Agriculture

* Today’s Market Moving Industries/Sectors (DOWN with volume):
Homebuilders, Global Equity Dividend, Nanotech, Utilities

::: Stocks :::

The stocks section will be an area where I highlight one stock selected from a group of stocks moving up with volume well above average and most likely breaking out of a base or consolidation. 

Sorry, no stock of the day today.

Bulls/Bears Battle Resistance; Hot IPO – Lululemon Athletica (LULU)

Following last weeks breakout move of the market, there were all kinds of earnings reports, economic data  and fed speak to sway the market big either way.  I was looking for some kind of confirmation of the breakout move (ie. a convincing move above Dow 14,000 and all time highs of the S&P around 1555), especially considering that the breakout move itself was suspicious, occurring with lackluster volume. Outside of some good ‘ol fashioned jubilee on CNBC when the Dow closed a hair above 14000, the bulls weren’t strapping on the party hats this week.  With the exception of the move on Friday, it was for the most part, a stalemate (despite some big intraday swings) and I still await a confirmation move.. I think that move may have to wait awhile. The downside momentum on Friday sets up a test of new support levels in the indices and probably more volatile sideways action.
 
 For the week, I’m calling the action just a bit bearish based on Friday’s move (volume as skewed higher due to double witching). Over the next few weeks I’m straddling neutrality..

 ::: Model Portfolio Update :::

I didn’t do a whole lot with the Model Portfolio this week which is fairly typical during earnings season because I rarely hold a stock through the earnings report.  This eliminates many opportunities from consideration in the coming weeks.  One company I do hold through earnings season is Google which I have been building a position in for some time and it represents the backbone of the portfolio.  Needless to say, I took a bit of a hit after the earnings miss, but as I wrote up over at the blog, I’m satisfied enough with the earnings report and believe the miss was an aberration due to one time costs associated with over hiring and a modification of accounting.  I’m holding on and may add to my position in the coming weeks.  I didn’t hold on with NVEC and dumped the position ahead of earnings for a 12% gain which saved me from further earnings report damage.  Also closed during the week were small positions in HANS (-4%) and AMZN (+1).  Both stocks look OK, but have stalled out for the time being and probably need more time to base.  With earnings coming up, the right thing to do was get out and wait for better entries.  On the addition side, two new Quick Strike Profit plays were added.  For the week, the portfolio took a 3% hit bringing the YTD performance to 5.3%.  Obviously, I’ve got my work cut out for me if I’m going to whoop the S&P again this year.  I’m up for the challenge!

::: Best/Worst Performers :::

– Top 10 Performing Industries For the Week –

1. Manufactured Housing: 8.45%
2. Data Storage Devices: 4.50%
3. Semiconductor – Equipment & Materials: 4.40%
4. Railroads: 3.85%
5. Diversified Computer Systems: 3.45%
6. Medical Appliances & Equipment: 3.35%
7. Gold:  3.15%
8. Home Furnishing Stores: 2.90%
9. Application Software: 2.85%
10. Specialty Chemicals: 2.80%

– Top 10 Worst Performing Industries For the Week –

1. Recreational Goods: -8.30%
2. Drug Delivery: -8.10%
3. Investment Brokerage National: -6.65%
4. Residential Construction: -6.50%
5. Toy & Hobby Stores: -6.30%
6. Long Distance Carriers: -5.70%
7. Sporting Goods: -5.70%
8. Internet Info Providers: -5.30%
9. REIT – Healthcare Facilities: -5.20%
10. Surety & Title Insurance: -5.00%

– Top 5 Best Performing ETFs For the Week –
 
1. Indonesia (IF)  23.00%
2. Gold Miners (GDX) 4.20%
3. Turkish Investment Fund (TKF) 4.20%
4. HLDRS Internet Architecture (IAH) 2.85%
5. Ishares Oil Equipment & Services (IEZ) 2.80%

– Worst 5 Performing ETF’s –

1. Japan Small Cap (JOF)  -5.25%
2. Ishares Broker Dealer (IAI) -5.20%
3. Proshares Agriculture (4.30) -4.30%
4. Ishares Home Construction (ITB) -4.20%
5. US Natural Gas (UNG) -4.15%

:::  IPO’s Worth Watching for This Week :::

1. Lululemon Athletica (LULU): The company designs and sells lululemon athletica and oqoqo branded apparel for the athletically hip in nearly 60 franchised and company-owned stores. lululemon athletica specializes in women’s clothing designed for yoga, dance, and running, and is expanding its accessories, undergarments, and outerwear lines and growing its men’s business. Nearly three-quarters of its shops are in Canada, with some 15 in the US, three in Japan, and one in Australia. Third-party, mostly Taiwanese, vendors manufacture its apparel, which is distributed from facilities in Vancouver and Washington.  The company is growing quickly and profitable making it the hot IPO of the week!  Trading set to begin on Friday.

2.  Perfect World (PWRD): Perfect World offers multiplayer online role-playing games (MMORPGs) to the masses. Popular titles include Perfect World, Legend of Martial Arts, Perfect World II, and Zhu Xian. With Perfect World, the company generates revenue using a time-based revenue model; players are charged based on the time they spend playing the game. The remaining games derive revenue based on an item-based model; players play games for free but pay for in-game item purchases (such as performance-enhancing products, clothing, and related accessories).   Trading set to begin on Thursday.

3.  Rex Energy (REXX):  The oil and gas exploration and production company has estimated proved reserves of 14.5 million barrels of oil equivalent, primarily from three regions: the Illinois Basin (in Illinois and Indiana); the Appalachian Basin (Pennsylvania and West Virginia); and the southwestern US (New Mexico and Texas). The company’s Lawrence Field ASP (alkaline-surfactant-polymer) Flood Project utilizes ASP technology, which washes residual oil from reservoir rock, thereby improving the existing waterflow’s ability to sweep the residual oil and increasing ultimate oil recoveries.    Trading set to begin on Wednesday.

4. Voltaire (VOLT): The company designs and develops server and storage switching hardware and software for high-performance grid computing. Voltaire’s products allow end customers to manage the growth of their data center’s through scalable high performance switching hardware and dynamic management and provisioning software. Outsourcing the manufacturing work, Voltaire relies on its two contract manufacturers to churn out its switching components. The company also relies on server original equipment manufacturers (OEMs) to incorporate the Voltaire Grid Backbone into their products as its primary sales channel. Trading set to begin on Thursday.

5.  BladeLogic (BLOG): The company offers data center automation software to clients such as General Electric, Microsoft, priceline.com, and Sprint. BladeLogic also offers a variety of professional services including consulting, support, training, installation, and maintenance.  Trading set to begin on Wednesday.

6.  Monotype Imaging Holdings (TYPE):  The company’s software offers scaling, compression, and lay out programs for formatting text on laser printers, digital copiers, mobile phones, digital televisions, and digital cameras. It allows customers to access more than 9,000 typefaces. Monotype also licenses its fonts on four Web sites frequented by creative and business users though most of its revenue comes from OEM sales. Major customers include Nokia, JVC, Sony, Hewlett-Packard, and Microsoft.  Trading set to begin on Wednesday.

::: Upcoming Economic Reports (7/23/07 – 7/27/07) :::

Monday:        None
Tuesday:       None
Wednesday:  Existing Home Sales, Crude Inventories, Fed Beige Book
Thursday:      Durable Orders, Initial Claims, New Home Sales
Friday:           GDP (adv), Chain Deflator (adv), Mich. Sentiment (rev)

::: Notable Upcoming Earnings Reports I’ll Be Watching This Week :::

Monday:

Woodward Governor (WGOV), Steel Dynamics (STLD), Atheros Communications (ATHR), Grupo Aeroportuario Del Paci (PAC)

Tuesday:

Smith International (SII), Robert Half (RHI), Legg Mason (LM), Jacobs Engineering (JEC), Complete Production Services (CPX), Ladish (LDSH), Portfolio Recovery Associates (PRAA), ENSCO Intl (ESV), Ceradyne (CRDN), Burlington Northern (BNI), Cerner (CERN), New Oriental Education (EDU), EMC (EMC), America Movil (AMX), Homex
Development (HXM), Lam Research (LRCX), Double Take (DBTK), Precision Castparts (PCP), Anixter International (AXE), Phase Forward (PFWD), Chicago Mercantile (CME), Vocus (VOCS), Paccar (PCAR)

Wednesday:

Apple (AAPL), Lifecell (LIFC), National Oilwell (NOV), Alcon (ACL), Grant Prideco (GRP), F5 Networks (FFIV), Core Laboratories (CLB), MEMC Electronic Materials (WFR), Akamai (AKAM), Baidu.com (BIDU), Allegheny Technologies (ATI), Mellanox Technologies (MLNX), RPC (RES)

Thursday:

Rediff.com (REDF), VASCO Data Security (VDSI), Falconstor Software (FALC), The Ultimate Software Group (ULTI), Celgene (CELG), Strayer Education (STRA), Stericycle (SRCL), Diamond Offshore (DO), Comcast (CMCSA), W-H Energy Services (WHQ), NII Holdings (NIHD), Tidewater (TDW), Intercontinental Exchange (ICE), Franklin Resources (BEN), Life Time Fitness (LTM), LKQ Corp (LKQX), Netgear (NTGR), Riverbed Technology (RVBD)
                 
Friday:

Baker Hughes (BHI)

::: In Case You Missed It – SelfInvestors Blog Entries of the Past Week :::

1. Trade of the Day – Tucows (TCX), Breakout to New Multi Year Highs
https://selfinvestors.com/tradingstocks/stock-trade-of-the-day/trade-of-the-day-tucows-tcx-breakout-to-new-multi-year-highs/

2. Trade of the Day – Iconix Brand Group (ICON) Attempts Cup With Handle Breakout
https://selfinvestors.com/tradingstocks/stock-trade-of-the-day/trade-of-the-day-iconix-brand-group-icon-attempts-cup-with-handle-breakout/

3. Sunpower (SPWR) & NVE Corp (NVEC) Dive After Earnings But Still Have Support
https://selfinvestors.com/tradingstocks/company-earnings/sunpower-spwr-nve-corp-nvec-dive-after-earnings-but-still-have-support/

4. Google (GOOG) Reports Earnings After Bell, Holding Again
https://selfinvestors.com/tradingstocks/company-earnings/google-goog-reports-earnings-after-bell-holding-again/

5. Trade of the Day – Cup with Handle Breakout in PRG Schultz (PRGX)
https://selfinvestors.com/tradingstocks/stock-trade-of-the-day/trade-of-the-day-cup-with-handle-breakout-in-prg-schultz-prgx/

6. Google (GOOG) Sell Off Offers Opportunity; Strong Technical Support at 500
https://selfinvestors.com/tradingstocks/company-earnings/google/google-goog-sell-off-offers-opportunity-strong-technical-support-at-500/

7. Intuitive Surgical (ISRG) Soars; Google (GOOG) & Caterpillar (CAT) Hold Up After Earnings https://selfinvestors.com/tradingstocks/company-earnings/intuitive-surgical-isrg-soars-google-goog-caterpillar-cat-hold-up-after-earnings/

Market Breaks Out, S&P Clears All Time High; Hot IPO – Airvana (AIRV)

I have to admit, I didn’t see it coming.  That rally we had on Thursday.. the largest in a couple of years that led to breakouts of trading ranges in both the Dow and S&P500.  There must have been some kind of terrific news out right? A hint of a rate cut from the Fed, news that inflation doesn’t exist and never will, news that China is buying the US at a 50% premium.  No, it was just news that the typically volatile same store retail sales weren’t as bad as everyone had feared.  Walmart posted surprisingly upbeat results, which by the way, comes after struggling with same store sales for many weeks.  Was it just an aberration?  Never mind that the June same store sales growth was due in large part to grocery sales.  Grocery sales?  Oh and the daily dose of merger activity also provided a boost with news of a Rio Tinto takeover of Alcoa.  It all scared the shorts off shorts which further fueled the rally.   Hey, nobody ever said the market made any sense.  We’ve all heard the phrase "The market can stay irrational longer than you can stay solvent."  This doesn’t mean we should ignore the growing concerns in housing, food and energy inflation, etc. but until this market begins paying more attention to the negative news (ie. Friday’s poor retail results) rather than rallying on any nugget (however small) of positive news, it pays to ride the trend. 

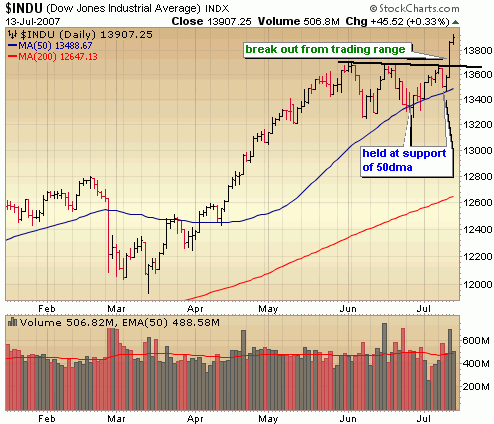
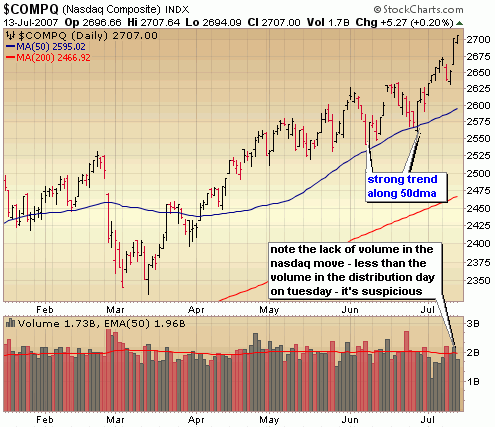
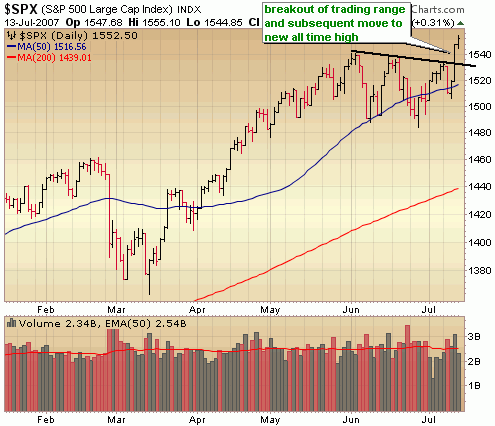
From a technical perspective, Thursday’s rally was significant.  Both the Dow and S&P broke out of trading ranges catapulting both indices to new all time highs (these former resistance levels will now act as key support).  One knock against Thursday’s rally was  the volume, which was lackluster for a move of this magnitude.  We’re certainly overbought in the near term, but any light volume pull backs from here would provide opportunities to initiate additional opportunities on the long side. 

dow breakout stock chart

Looking ahead to next week, earnings (particularly in tech) kick off in full force with reports out of Intel, Yahoo, Google, Ebay which could set the stage for this market for the rest of the year.  Also on tap is inflation data and Fed minutes.  My feeling is if the market can hold its breakout on Thursday following all of the key reports, we could be in for another nice leg up. 

::: Model Portfolio Update :::

The model portfolio was positioned to take advantage of a market move either way with a bias to the long side, but with Thursday’s move that little lean to the bearish side was gone with the elimination of some hedging with DXD and QID positions which were closed for significant losses.  I still don’t regret the decision to hedge my bets with these Ultra Short ETF’s, despite te fact it hurt my performance considerably.  I have to trade what I see and what has worked well for me over the years.  From a technical perspective, my analysis was showing some trouble ahead.  It hasn’t panned out that way but I’m still in good position to beat the market by keeping pace during what has been a highly irrational (from a technical perspective) and volatile market.  During the week, despite losses in the hedge positions, the portfolio surged another 2% and closed the week with an 8.3% YTD gain.   With the market breaking out of a trading range the allocation of the portfolio has shifted more to the long side with 3 new long positions initiated.  A sizable portion remains in cash (30%) and just a small portion remains in short positions (5%).

::: Best/Worst Performers :::

– Top 10 Performing Industries For the Week –

1. Aluminum: 10.70%
2. Technical Services: 10.30%
3. Aerospace/Defense: 6.75%
4. Copper: 6.35%
5. Trucks & Other Vehicles: 5.75%
6. Diversified Investments: 5.20%
7. Semiconductor – Memory:  5.00%
8. Farm & Construction Machinery: 4.75%
9. Nonmetallic Mineral Mining: 4.50%
10. Semiconductor Specialized: 4.20%

– Top 10 Worst Performing Industries For the Week –

1. Long Distance Carriers: -4.85%
2. Auto Parts Stores: -4.40%
3. Sporting Activities: -3.30%
4. Electronic Stores: -3.15%
5. Office Supplies: -2.90%
6. Major Airlines: -2.75%
7. Publishing – Books: -2.70%
8. Surety & Title Insurance: -2.45%
9. Music & Video Stores: -2.45%
10. Auto Dealerships: -2.40%

– Top 5 Best Performing ETFs For the Week –
 
1. Morgan Stanley China (CAF)  8.15%
2. Wilshire Clean Energy (PBW) 5.80%
3. Ishares South Korea (EWY) 5.20%
4. Ishares Brazil (EWZ) 5.10%
5. Templeton Russia (TRF) 4.90%

– Worst 5 Performing ETF’s –

1. Chile Fund (CH)  -6.00%
2. Ishares Mexico (EWW) -1.05%
3. SPDR Retail (XRT) -.90%
4. HLDRS Oil Services (OIH) -.65%
5. SPDR REITs (RWR) -.55

:::  IPO’s Worth Watching for This Week :::

You won’t find Orbitz on the list this week.  You’d think this would be a hot IPO in a well recognized internet travel company growing by leaps and bounds, but this is a company that lost 146 million last year.  Giga Om calls it the worst IPO of 2007: http://gigaom.com/2007/05/11/orbitz-the-worst-ipo-of-2007/

1. Airvana (AIRV): The company makes mobile broadband infrastructure products for wireless carriers. Its products enable wireless networks to deliver broadband multimedia services — such as Internet access, e-mail, music downloads, and video streaming — to cell phones, laptops, and other mobile devices. Airvana sells its software and hardware to service providers such as Verizon Wireless in the US, TELUS in Canada, Telstra in Australia, Israel’s Pelephone, and Eurotel in the Czech Republic; however, most of its revenue (some 95% in 2006) is derived from Nortel Networks. Founded in 2000, Airvana operates offices in China, India, Japan, South Korea, the UK, and the US.  Trading set to begin on Friday.

2.  Limco-Piedmont (LIMC): wants to keep planes out of limbo while waiting for repairs. The company (formerly Limco-Airepair) performs aircraft component maintenance, repairs, and overhaul services for commercial and military planes as well as air cargo carriers. Most of its work is on heat transfer parts. Limco-Piedmont also makes heat transfer equipment used in airplanes and offers inventory management and parts procurement for airlines. Parts services account for about a quarter of the company’s business. Major customers include the US government, KLM Royal Dutch Airlines, Lufthansa, and Bell Helicopter. The company is a subsidiary of Israeli aircraft parts maker TAT Technologies (note: TAT is a growing company with a nice looking base – check it out ticker TATTF.  Trading set to begin on Friday.

3.  MF Global (MF):  MF Global isn’t just working Monday through Friday. The brokerage firm, one of the largest in the US, handles futures, options, foreign exchange products, and equity derivatives. It also acts as an intermediary in metals and energy markets. With more than $61 billion of funds under management, MF Global operates on about 15 exchanges including LIFFE and the Chicago Mercantile Exchange. About half its revenue comes from institutional investors, half from individuals. The company has a dozen offices in Asia, Africa, Europe, and North America. Hedge fund manager Man Group, which is spinning off its Man Financial as MF Global, dates to 1783 when James Man formed a sugar trading business.    Trading set to begin on Thursday.

4. Netezza (NZ): Netezza provides data warehouse appliances used to manage large databases. Targeted toward companies such as financial services companies and telecom service providers, Netezza’s appliance integrates database, server, and storage functions, allowing customers to quickly analyze huge amounts of data. Customers include Acxiom, Amazon.com, CNET Networks, ClarityBlue, Neiman Marcus, and Shoppers Drug Mart. The company established a Federal Systems division in 2005, aiming at federal government customers. "Netezza" is the Urdu word for "results." The company was founded in 2000 and filed to go public in 2007.  Trading set to begin on Thursday.

::: Upcoming Economic Reports (7/16/07 – 7/20/07) :::

Monday:        NY Empire State Index
Tuesday:       PPI, Net Foreign Purchases, Capacity Utilization, Industrial Production
Wednesday:  CPI, Housing Starts, Building Permits, Crude Inventories
Thursday:      Initial Claims, Leading Indicators, FOMC Minutes
Friday:           None

::: Notable Upcoming Earnings Reports I’ll Be Watching This Week :::

Earnings season kicks off in full force on Tuesday!

Tuesday: Intel (INTC), Yahoo (YHOO), Johnson & Johnson (JNJ), Healthcare Services (HCSG)

Wednesday: Noble Corp (NE), NVE Corp (NVEC), Acergy (ACGY), First Cash Financial (FCFS)
                      Altria Group (MO), Cavium Networks (CAVM), Ebay (EBAY)

Thursday: Google (GOOG), Sunpower (SPWR), Danaher (DHR), CyberSource (CYBS)
                  Gilead Sciences (GILD)

Friday: Caterpillar (CAT), Satyam Computer (SAY), Schlumberger (SLB), Citigroup (C)

::: In Case You Missed It – SelfInvestors Blog Entries of the Past Week :::

1. Trade of the Day – Daystar Technologies (DSTI) Attempting Breakout from Triangle
https://selfinvestors.com/tradingstocks/stock-trade-of-the-day/trade-of-the-day-daystar-technologies-dsti-attempting-breakout-from-triangle/

2. Gary Scott Highlights the Risks & Rewards of Leveraging
https://selfinvestors.com/tradingstocks/uncategorized/gary-scott-highlights-the-risks-rewards-of-leveraging/

3. Beware of Credit Card Fraud
https://selfinvestors.com/tradingstocks/credit-cards/beware-of-credit-card-fraud/

4. Trade of the Day – Banco Itau (ITU), Flat Base Break Out
https://selfinvestors.com/tradingstocks/stock-trade-of-the-day/trade-of-the-day-banco-itau-itu-flat-base-break-out/

5. Trade of the Day – Energizer Holdings (ENR) Flat Base Breakout
https://selfinvestors.com/tradingstocks/stock-trade-of-the-day/trade-of-the-day-energizer-holdings-enr-flat-base-breakout/

6. Market Distribution After Profit Warnings in Housing, Retail
https://selfinvestors.com/tradingstocks/weeklyafter-stock-market-review-archives/market-distribution-after-profit-warnings-in-housing-retail/

7. Trade of Day – Monolithic Power Systems (MPWR) – Flat Base Breakout
https://selfinvestors.com/tradingstocks/stock-trade-of-the-day/trade-of-the-day-monolithic-power-systems-mpwr-flat-base-breakout/

Market Distribution After Profit Warnings in Housing, Retail

In the first significant day of trading in over a week, bears came out of hiding after profit warnings left traders wondering just how upbeat earnings will be this quarter and provided an excuse to take some profits.  Warnings out of Home Depot (HD) and DR Horton (DHI) along with Standard & Poors cutting ratings on 12 billion of subprime mortgage bonds got the market off on the wrong foot, but it wasn’t until the end of Bernanke’s speech that the selling really accelerated.  Bernanke usuallly has a way of providing some pop to the market, but this time around didn’t say much of anything to alleviate concerns.  The robust consumer is showing signs of wavering recently with Walmart’s recent poor results and the warning out of Sears today.  As I’ve said before this will be a critical area to watch so keep an eye on the retail numbers due out this Friday. 

Technically, today’s action was obviously bearish but not disastrous.  Volume levels indicated distribution, but considering the market was pushing higher with diminishing volume, some significant selling shouldn’t be too much of a surprise.  While the S&P just barely took out support of the 50 day moving average it remains firmly in a supportive channel.  Both the Nasdaq and Dow still have support of their 50 day moving averages.  The selling today sets up further deterioration but it would take another few days of intense selling to cause significant technical damage to the indices.  It still pays to be quite cautious up here until we begin to get into the bulk of earnings season which kicks off next week.  Stay tuned, it should be a wild ride over the next few weeks!

::: Major Indices Performance – The Numbers :::

(Note: volume averages are based on the average over the past 50 days)
Data as of 4:00EST – End of Day July 10th 2007

Distribution across all indices.

Nasdaq: DOWN 1.16% today with volume 11% ABOVE average
Nasdaq ETF (QQQQ) DOWN .84%, volume 12% BELOW average
Dow: DOWN 1.09%, with volume 20% ABOVE the average
Dow ETF (DIA): DOWN 1.07%, volume 9% BELOW the average
S&P ETF (SPY): DOWN 1.36%, volume 36% ABOVe the average
Russell Small Cap ETF (IWM): DOWN 2.95%, volume 30% ABOVE the average

::: SelflInvestors Leading Stocks :::

The Self Investors Leading Stocks Index is comprised of stocks in the Breakout Tracker, which is a database of the fastest growing companies near a breakout or having already broken out of a base.  Leading stocks performed about in line with the rest of the market today.

Summary:

* Decliners led Advancers 324 to 61
* Advancers were up an average of 1.67% today, with volume 37% ABOVE average
* Decliners were down an average of 1.86% with volume 4% BELOW average
* The total SI Leading Stocks Index was DOWN 1.3% today with volume 2% ABOVE average

::: Where’s the Money Flowing :::

Many investing websites provide leading industries based on price performance alone. However, without accompanying volume levels, this can sometimes be misleading.  The only way that I know of to gauge industry/sector strength WITH volume levels is through the analysis of ETF’s.  A couple years ago this was not possible, but as more traders/investors use ETF’s they become a much better tool for gauging the health of the market and seeing where the money is flowing (or not flowing).  Using the proprietary SelfInvestors Demand Indicator score which measures price and volume movements, I’m able to quickly see which sectors/industries are seeing the greatest inflows of cash.  For a detailed look at how I go about gauging sector/industry strength please see the following post: http://selfinvestors.com/si/industry_tracking/

* Current Leading Sectors/Industries (over last 30 trading days): 
Clean Energy, Technology, Semis, Aerospace/Defense
                                          
* Current Lagging Sectors/Industries (over last 30 trading days): 
Bonds, Biotech, Home Construction, Banks, Financial

* Today’s Market Moving Industries/Sectors (UP with volume):
Agriculture

* Today’s Market Moving Industries/Sectors (DOWN with volume):
Home Construction, Broker Dealers, Retail, Telecom, Financial

::: Stocks :::

The stocks section will be an area where I highlight one stock selected from a group of stocks moving up with volume well above average and most likely breaking out of a base or consolidation. 

It’s been a long day and I’m short on time tonight so no Stock of the Day for today but you might like to have a look at these high quality companies moving with volume today – Perficient (PRFT), Allis Chalmers (ALY) and Visual Sciences (VSCN).

Disclaimer: I own a small position in Visual Sciences (VSCN)

Nasdaq Breaks Out of Range, S&P Reclaims Support But…

In a return to the trading action we’ve seen over the past few months, it seemed the market was going to find some kind of excuse to push higher.  The Nasdaq led the way and busted out of a trading range to a new multi year high.  The S&P reclaimed support of its 50 day moving.  This alone is very bullish action, but as I’ve been mentioning we can’t place too much importance on it due to the light holiday trading volume. 

At this point, until the bears can strike with significant technical damage, the bulls still have the upper hand.  As normal trading volume levels return next week, keep  an eye on the 50 day moving averages of the indices.  It’s an area that is shaping up as a key short term support level, particularly for the Dow and Nasdaq.

::: Model Portfolio Update :::

It was another week of relative inaction on my part, choosing to sit largely on the sidelines until holiday traders come back and we get some meaningful volume.  It was a good week for the market and even better for the SelfInvestors Model Portfolio which jumped 2.2%.  My strategy at this point is to remain leaning to the bullish side but initiating smaller postions and locking in profits quicker than I ordinarily would.  A good example of this was the sell of GMCR Friday morning.  The stock is still showing very bullish action and no signs of slowing down but considering I had a 30% gain in just a month I had no problems locking in the gain.  It had just come too far too fast in a market that is on a bit of shaky ground.  As it turns out the stock closed considerably higher by the end of the day but I don’t have an regrets.  The only other transactions that were made during the week were 2 small Quick Strike Profit long entries.  The current allocation of the portfolio is 55% long, 20% short and 25% cash.

::: Best/Worst Performers :::

– Top 10 Performing Industries For the Week –

1. Lodging: 10.35%
2. Diversified Electronics: 8.60%
3. Silver: 8.50%
4. REIT – Hotel/Motel: 8.00%
5. Heavy Construction: 7.85%
6. Copper: 7.60%
7. Gold:  7.55%
8. Aluminum: 7.35%
9. Shipping: 7.15%
10. Industrial Metals & Minerals: 6.90%

– Top 10 Worst Performing Industries For the Week –

1. Music & Video Stores: -2.95%
2. Sporting Goods: -1.60%
3. Investment Brokerage: -1.20%
4. Personal Service: -1.10%
5. Manufactured Housing: -1.00%
6. Movie Production – Theatres: -.90%
7. Long Term Care Facilities: -.90%
8. General Entertainment: -.90%
9. Printed Circuit Boards: -.90%
10. Air Delivery & Freight Service: -.80%

– Top 5 Best Performing ETFs For the Week –
 
1. Turkish Investment Fund (TKF)  8.25%
2. Ishares South Korea (EWY) 7.85%
3. Korea Fund (KF) 7.80%
4. Market Vectors Gold (GDX) 7.70%
5. Japan Small Cap (JOF) 7.20%

– Worst 5 Performing ETF’s –

1. Herzfeld Caribbean Basin (CUBA)  -4.20%
2. HLDRS Biotech (BBH) -.80%
3. HLDRS Internet Infrastructure (IIH) -.20%
4. Ishares Home Construction (ITB) -.05%
5. Powershares Dynamic Biotech (PBE) -.05

:::  IPO’s Worth Watching for This Week :::

No IPO’s worth watching again  this week- the summer slowdown is upon us.

::: Upcoming Economic Reports (7/9/07 – 7/13/07) :::

Monday:        Consumer Credit
Tuesday:       Wholesale Inventories
Wednesday:  Crude Inventories
Thursday:      Initial Claims, Trade Balance, Treasury Budget
Friday:           Export/Import Prices, Retail Sales, Business Inventories, Mich. Sentiment (prelim)

::: Notable Upcoming Earnings Reports I’ll Be Watching This Week :::

Tuesday: HDFC Bank (HDB)
Wednesday: Genentech (DNA), Acergy (ACGY)
Thursday: Fastenal (FAST)

Hang on to your hats.. earnings season begins to ramp up next week!

::: In Case You Missed It – SelfInvestors Blog Entries of the Past Week :::

1. Stocks Rocket, But With Little Sizzle; Stock of Day NVE Corp (NVEC)
https://selfinvestors.com/tradingstocks/weeklyafter-stock-market-review-archives/stocks-rocket-with-little-sizzle-stock-of-day-nve-corp-nvec/

2. Blackstone (BX) Buying the World, Adds Hilton (HLT)
https://selfinvestors.com/tradingstocks/news/blackstone-bx-buying-the-world-adds-hilton-hlt/

:::::::::::::::::::: Billboard ::::::::::::::::::::::::::::::::

Buying a home in the US is everyone’s dream. But without home mortgage refinancing you cannot afford to buy your dream house. If you had bad credit in your past then a bad credit loan can help you to sort out your problems. To protect your bad credit, insurance companies play vital roles in it. They give full cover insurance of your home mortgage. Because without insurance, you cannot afford to have a credit loan, for this you have to remove your bad credit loan history. This will also help to solve your credit debt problem.

Stocks Rocket With Little Sizzle; Stock of Day – NVE Corp (NVEC)

A bit of a pre holiday pop today after another round of Monday merger mania and a positive ISM number which came in a bit above expectations.  It was a surprisingly strong day today and the Nasdaq came within inches of a new mutli year high, but you really can’t take away too much from it.  Trading volume was light ahead of the holiday and that should remain throughout the week.  We can’t place too much importance on market moves until probably early next week.

* This will be the last report from me until Thursday – have a great 4th!

::: Major Indices Performance – The Numbers :::

(Note: volume averages are based on the average over the past 50 days)
Data as of 4:00EST – End of Day July 2nd 2007

Nasdaq: UP 1.12% today with volume 11% BELOW  average
Nasdaq ETF (QQQQ) UP .86%, volume 34% BELOW average
Dow: UP .95%, with volume 14% BELOW the average
Dow ETF (DIA): UP .8%, volume 37% BELOW the average
S&P ETF (SPY): UP .9%, volume 24% BELOW the average
Russell Small Cap ETF (IWM): UP 1.24%, volume 28% BELOW the average

::: SelflInvestors Leading Stocks :::

The Self Investors Leading Stocks Index is comprised of stocks in the Breakout Tracker, which is a database of the fastest growing companies near a breakout or having already broken out of a base.  Leading stocks did extremely well today but the lack of volume behind the move wasn’t surprising given the holiday week.

Summary:

* Advancers led Decliners 313 to 61
* Advancers were up an average of 2.27% today, with volume 8% BELOW average
* Decliners were down an average of 1.04% with volume 4% ABOVE average
* The total SI Leading Stocks Index was UP 1.73% today with volume 5% BELOW average

::: Where’s the Money Flowing :::

Many investing websites provide leading industries based on price performance alone. However, without accompanying volume levels, this can sometimes be misleading.  The only way that I know of to gauge industry/sector strength WITH volume levels is through the analysis of ETF’s.  A couple years ago this was not possible, but as more traders/investors use ETF’s they become a much better tool for gauging the health of the market and seeing where the money is flowing (or not flowing).  Using the proprietary SelfInvestors Demand Indicator score which measures price and volume movements, I’m able to quickly see which sectors/industries are seeing the greatest inflows of cash.  For a detailed look at how I go about gauging sector/industry strength please see the following post: http://selfinvestors.com/si/industry_tracking/

* Current Leading Sectors/Industries (over last 30 trading days): 
Technology, Oil & Gas Services, Commodities, Semis
                                          
* Current Lagging Sectors/Industries (over last 30 trading days): 
Real Estate, Biotech, Regional Banks, Home Construction

* Today’s Market Moving Industries/Sectors (UP):
Realty, Real Estate, Clean Energy, REIT, Utilities, Telecom

* Today’s Market Moving Industries/Sectors (DOWN):
None

::: Stocks :::

The stocks section will be an area where I highlight one stock selected from a group of stocks moving up with volume well above average and most likely breaking out of a base or consolidation.  Today’s stock is a stock I highlighted to premium members on Friday and purchased for the SelfInvestors Model Portfolio.  Today, it followed through from Friday’s move and soared above the high of the handle formation of a large cup base.

ABOUT:  NVE Corporation (NVE) develops and sells devices using spintronics, a nanotechnology it helped pioneer, which utilizes electron spin rather than electron charge to acquire, store and transmit information. The Company is a licensor of spintronic magnetoresistive random access memory technology (MRAM), which has the potential to revolutionize electronic memory. NVE also manufactures spintronic products, including sensors and couplers that are used to acquire and transmit data. The Company’s designs use one of two nano-scale spintronic structures: giant magnetoresistors or spin-dependent tunnel junctions. Both structures produce a large change in electrical resistance depending on the electron spin orientation in a free layer. In giant magnetoresistance (GMR) devices, resistance changes due to conduction electrons scattering at interfaces within the devices. NVE operates through a single segment and has three product lines to offer: sensor products, coupler products and MRAM products.  The company provides its technology to Starkey Laboratories, which improve the user experience with its hearing aids, allowing for the automatic adjustment during a cell phone call as well as smaller hearing aid devices.  Another major customer is St Jude Medical, which uses NVEC technology in its pacemakers and implantable cardioverter defibrillators.

FUNDAMENTALS: NVEC is a very small company (15.4 million in sales in ’06) that experienced tremendous growth in 2003 when it posted its first profitable year and then again in 2004 when earnings more than doubled over ’03.  Then the company hit a bit of a snag and posted poor results over the next two years.  However, the good times are here again for NVEC.  Over the past year, the company has posted quarter over quarter earnings growth of 111%, 238%, 144% and 154% and sales growth has accelerated nearly every quarter over the past year.  2008 estimates call for a 30% increase in earnings over 2007, so it’s clear the company is finding additional customers and larger contracts for its technologies. .. and those companies are willing to pay a premium with pre tax margins of 44%.  Return on equity is equally impressive at around 25%.

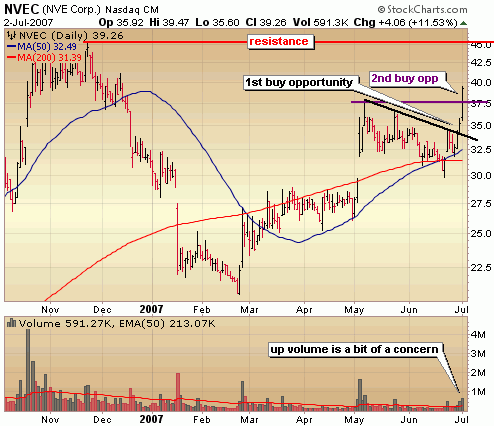
TECHNICAL:  On Friday, NVEC provided the first buy opportunity when it broke through the downward trend (by drawing a line across the highs) of the handle.  Today, it confirmed that move and provided a 2nd buy opportunity when it cleared the high of the handle formation above 37.67.  Over the past 2 days, the stock has vaulted nearly 20% but the volume behind the move is a bit of a concern.  Trading volume today was less than the volume during the move in early May as well as the move on February 26th.  That being said, I believe the stock has enough momentum to hit resistance around the November ’06 highs, but should not be chased at these levels.  If you missed the two buy opportunities wait for some kind of pull back to at least 37.67 and preferably to the area around 35.  I’m looking to take profits around the November highs due to the severity of this base which is too deep with sell volume too intense in the left side.  I believe the base is prone to failure after it hits 45 but would reconsider another position if it can surge above that level and hold for a few weeks.

nve corp nvec stock chart breakout

SELFINVESTORS RATING: With a total score of 49/60 (26/30 for fundamentals, 23/30 for technical), NVE Corp (NVEC) is a high quality breakout stock.

Full Disclosure/Disclaimer: The stock of the day is by no means a buy recommendation.  Please do your own research and make a personal decision based on your own tolerance for risk.  I currently DO own a position in NVEC.

Sub Prime Concerns Weigh on Market, But Holding Firm

With a slew of economic reports, a fed decision and end of quarter trading, it was expected to be a wild week of trading – which it was, with volatile intraday swings throughout the trading week.  However, bulls and bears just chased each other’s tails around and the net result was little change for the week. 

Sub prime concerns continue to crop up with news of a couple Bear Sterns hedge funds near collapse due to over exposure in the sup prime market.   Any additional news about the sub prime melt down spreading to the top of the food chain is a concern that will no doubt be watched closely.  My feeling is that it’s going to get much worse before it gets better.  Tempering the sub prime concerns this week was another decent inflation reading on Friday with the PCE core deflator rising just .1% in May bringing the year over year inflation reading to 1.9% which is at the top, but within the Fed comfort zone of 1 – 2%.  I just wonder when the Fed is going to place more importance on energy and food prices which have typically been excluded due to their volatility. 

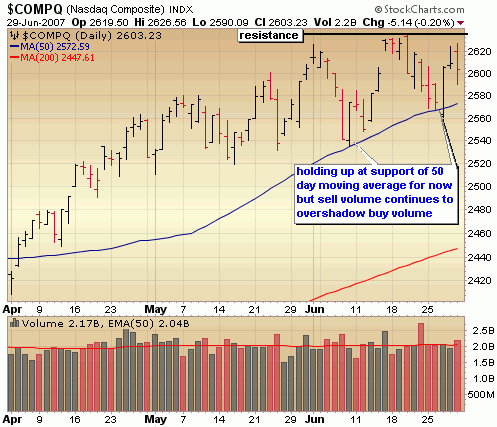
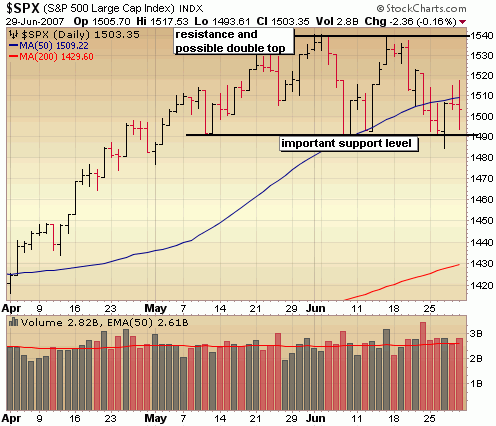
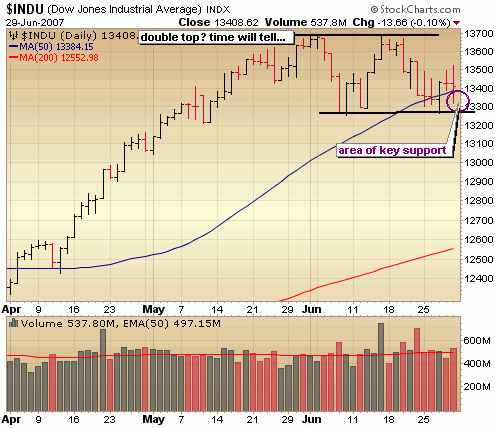
From a technical standpoint, I’d call the action of last week nearly neutral.  On the bearish side, four of five trading days resulted in a close near or at the lows of the day.  Several weeks ago,  traders were looking to buy the dips, but the theme now is that traders are looking to sell the rallies.  On the bullish side, the bears continue to have trouble exerting any kind sustained control as the Dow was able to reclaim support of its 50 day moving average and the Nasdaq continues to hold above that level.  All in all, the market seems a bit uncertain about which way it wants to go at this time and you know what that means for you the successful trader.. let it sort itself out without making large bets in either direction.  Next week is a holiday week, so don’t expect the market to reveal many clues as to its direction until the following week.  If you’re thinking of vacationing for a few weeks and watching the market from the sidelines, now is a great time 🙂  If you are more of an active trader like myself, consider locking in profits a bit earlier and be quicker to cut losses.

Market Action This Week: Neutral
Outlook for the Next Month: Leaning Bearish

nasdaq chart

s&p500 chart

dow jones chart

::: Model Portfolio Update :::

I’m continuing to remain quite cautious with the model portfolio right now with a sizable portion in cash and the portfolio relatively even in long and short positions.  Few transactions were made during the week with 3 positions closed and one new small long position initiated.  I closed out my FMCN position for a 17% gain.  I hate to close out positions after a big move like it had on Friday, but I did sell near Friday’s high and think it will have trouble getting much higher than that in the coming weeks.  FMCN is now trading just above the upward trend line which could indicate a parabolic move from here or indicate it’s overbought in the short term and needs to consolidate significantly.  Considering the market is a bit shaky right now and me having some trouble of late locking in some significant gains, I opted to lock in the profit and look for a better entry to reinitiate a trade.  On the losing side, I did close out 2 trades in BTJ (a short) and SYNL for losses of 9% and 10% respectively, but both were very small positions, so it didn’t hit the portfolio too hard.  The SYNL trade was particularly difficult to swallow because I had a decent gain on the stock before it turned a jeckyl and hyde on me and went from bullish breakout to nine straight days of declines!  I rode this one out thinking it would get a bounce at the 50 moving average, but that never materialized and found myself eating a loss.  Such is trading.  Sometimes the most bullish of charts don’t always act as they should.  The good news is that they work more often than not, so that if you keep your losses small enough you can make lots ‘o money over the long haul.  For the week, the portfolio was off a bit and the YTD stands at 4.3%, which is still a bit shy of the S&P500 YTD performance of 6%.  My goal is to stay close to even with the S&P through the summer, before really ramping up my performance in the last 3 months of the year, which is typically a bullish time of year.

::: Best/Worst Performers :::

– Top 10 Performing Industries For the Week –

1. Toy & Hobby Stores: 15.60%
2. Education & Training Services: 7.75%
3. Water Utilities: 6.45%
4. Reseach Services: 4.70%
5. Dairy Products: 4.35%
6. Tobacco Products: 4.20%
7. Diversified Communications:  4.00%
8. Sporting Goods Stores: 3.85%
9. Cigarettes: 3.75%
10. Auto Manufacturers: 2.65%

– Top 10 Worst Performing Industries For the Week –

1. Residential Construction: -4.35%
2. Printed Circuit Boards: -3.80%
3. Diversified Investments: -3.55%
4. Music & Video Stores: -3.40%
5. Mortage Investment: -3.20%
6. Oil & Gas Equipment & Servicese: -3.10%
7. Specialty Retail: -3.00%
8. Drug Manufacturers: -3.00%
9. Business/Management Services: -2.90%
10. Silver: -2.80%

– Top 5 Best Performing ETFs For the Week –
 
1. HLDRS Internet Infrastructure (IIH)  3.45%
2. India Fund (IFN) 2.90%
3. Central Europe and Russia Fund (CEE) 2.60%
4. HLDRS Telecom (TTH) 2.50%
5. Chile Fund (CH) 2.45%

– Worst 5 Performing ETF’s –

1. Latin America Discovery Fund (LDF)  -8.90%
2. Morgan Stanley China (CAF) -5.45%
3. Ishares Silver (SLV) -5.05%
4. Ishares Homebuilders (ITB) -4.90%
5. SPDR Homebuilders (XHB) -4.70

:::  IPO’s Worth Watching for This Week :::

No IPO’s worth watching for the next two weeks – the summer slowdown is upon us.

::: Upcoming Economic Reports (7/2/07 – 7/6/07) :::

Monday:        ISM Index
Tuesday:       Factory Orders, Pending Home Sales, Auto/Truck Sales
Wednesday:  None – Holiday
Thursday:      Initial Claims, ISM Services, Crude Inventories
Friday:           Nonfarm Payrolls, Unemployment Rate, Hourly Earnings

::: Notable Upcoming Earnings Reports I’ll Be Watching This Week :::

None for this week but we are fast approaching earnings season!

::: In Case You Missed It – SelfInvestors Blog Entries of the Past Week :::

1. 9 IPO’s to Consider Right Now
https://selfinvestors.com/tradingstocks/ipos/ipo-watch-list-top-9-ipos-to-consider-right-now/

Note: Be sure to the check out the latest addition of the Investors Blog Network Festival at BioHealthInvestor