I took a look at the major indices in detail a few days ago, so in this weekly report I’ll take a look at the latest trends in ETF’s to get an idea of where money is being put to work in this challenging market. As for the overall market, the odds are increasing for a major snapback rally of 3 – 5% before I believe bears resume control. In my opinion, being aggressively short down here is a mistake with cash being the best option, while taking advantage of a snap back rally with aggressive day/swing trades on the long side using leveraged ETFs such as DDM, SSO or QLD. The Dow is reaching oversold levels not seen since the January plunge, so could be the biggest beneficiary of a snap back rally.
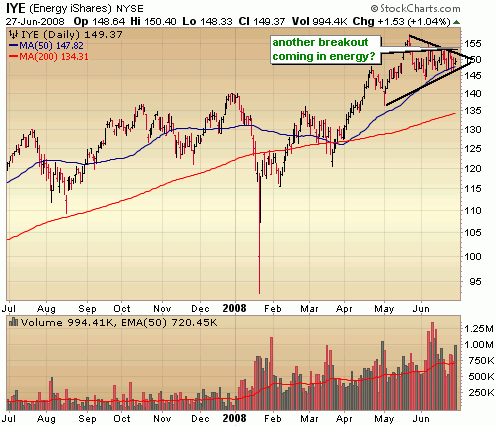
The bull run in energy continues unabated for the time being with the Energy Ishares ETF (IYE) carving out a bullish triangle formation on the daily chart. A breakout from this formation could signal another upside move in energy stocks. The US Oil Fund ETF (USO) broke out of a short consolidation last Thursday… so no bearish indications in the oil charts just yet. However, I continue to hold my Ultra Short Oil & Gas ETF (DUG) for the time being. It needs to break out above the 50 day moving average and soon.. the longer oil holds up without a significant correction, the greater the likelihood oil will continue pushing higher.
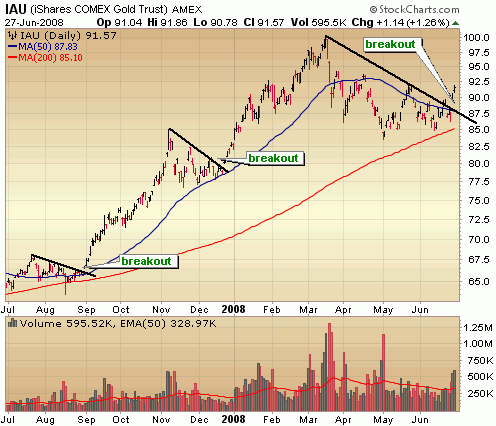
Gold as a long play was discussed here several days ago and it continues to be a top performer. The iShares Gold Trust ETF (IAU) broke out of a downtrend and looks poised to test all time highs around 100 within the next few months. If you missed out, be patient.. it should pull back and offer a better entry. I have been playing gold with the Double Long ETN (DGP) and my top individual play is Yamana Gold (AUY)
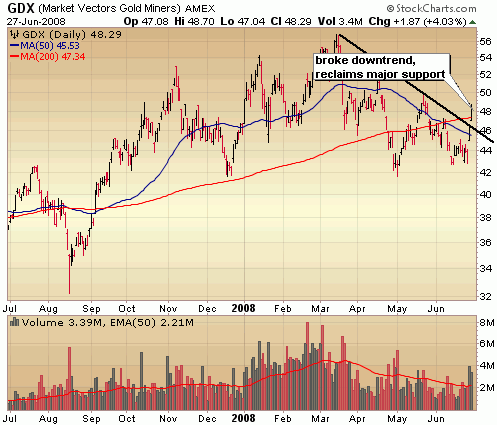
No surprise that the Gold Mining group broke out as well. Bucyrus Intl (BUCY) is the play here and still looks quite bullish despite already doubling this year.
I’ve liked the Market Vectors Nuclear Energy ETF (NLR) for some time now but have been patiently waiting for entry. I still think we’ll see Uranium/Nuclear join the commodity party particularly if John McCain wins the presidency. I just want to see price and volume surge a bit out of this handle formation in a double bottom base before initiating a position.
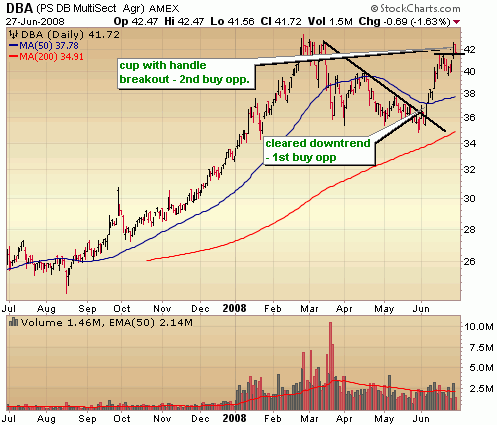
The PowerShares DB Agriculture ETF (DBA) was the hottest ETF in the last months of 07 and carved out a much needed base this year. It broke out of the downtrend in early June offering an initial entry point, paused briefly for a handle formation and is breaking out again. This is a fund that seeks a return based largely on the price of sugar, corn, soybeans and wheat. Expect this fund to do well if Obama, who fully supports ethanol subsidies, wins the presidency.
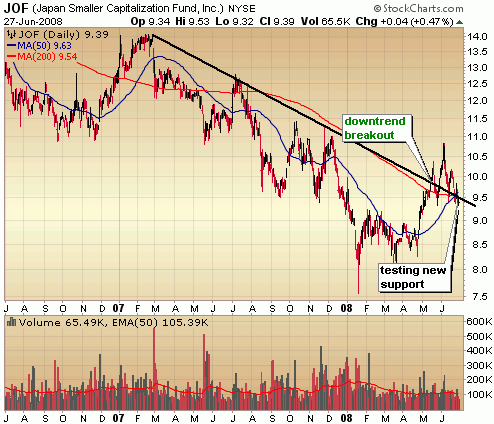
The Japan Small Cap ETF (JOF) looks mighty interesting down here for the patient investor. It broke a more than one year downtrend in May and has been digesting those gains in a healthy manner, possibly setting up a decent entry as it tests new support.
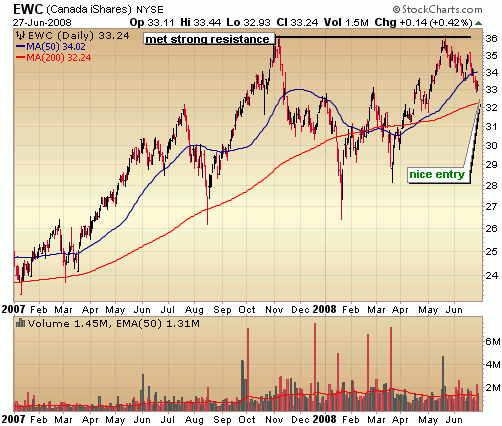
Oh Canada, the beneficiary of surging commodity demand without all the political risk. The Canada iShares ETF (EWC) met strong resistance at 36 before digesting the big gains off the March lows. I like the EWC off the 50 dma around 32.
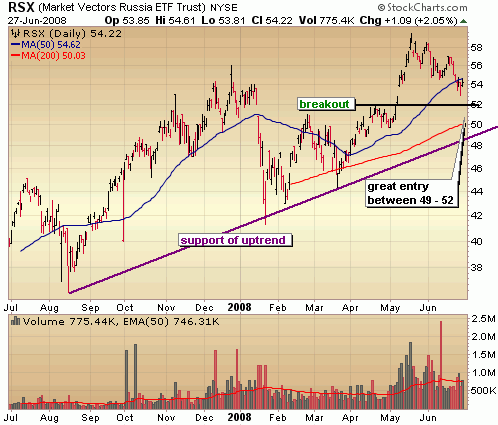
Russia is benefiting from surging oil demand BUT with major POLITICAL RISK. Much more speculative than the Canada ETF, but with potentially more reward. The area between 50 (support of upward trend) to 52 (where it broke out in May) is a big support area for the Market Vectors Russia ETF (RSX). I’d consider a position in this area and hold it as long as it remains above the upward trend line in purple.
::: Model Portfolio :::
** This section will now appear as a separate report about every other Wednesday.
The Self Investors Model Portolio wrapped up 2006 with a gain of 27.6%, 2007 with a gain of 30.2% and is more than 10% ahead of the S&P in a very difficult 2008. This is a REAL portfolio with position sizing and features annualized returns of 24%.
Would you like to receive buy and sell alerts in the Model Portfolio within minutes (NEW! now get them via instant messaging in near real time) of each transaction? You can receive these along with ALL of the tracking tools and video reports with the very popular Gold membership. Don’t delay, get started today and join me for many more highly profitable months here at SelfInvestors.com.
::: Best/Worst Performers :::
– Top 10 Performing Industries For the Week –
1. Gold: 9.55%
2. Silver: 6.90%
3. Research Services: 3.25%
4. Oil & Gas Drilling & Exploration: 2.60%
5. Drugs Generic: 2.45%
6. Oil & Gas Equip & Services: 2.10%
7. Photographic Equip & Supplies: 2.10%
8. Drug Delivery: 1.45%
9. Hospitals: 1.40%
10. Computer Based Systems: 1.40%
– Top 10 Worst Performing Industries For the Week –
1. Semis – Memory Chips: -14.25%
2. Trucks & Other Vehicles: -13.35%
3. Surety & Title Insurance: -12.95%
4. Medical Practitioners: -11.65%
5. Mortgage Investment: -11.20%
6. Office Supplies: -10.50%
7. Major Airlines: -10.40%
8. Resorts & Casinos: -10.05%
9. Long Term Care Facilities: -9.20%
10. Sporting Activities: -9.20%
– Top 5 Best Performing ETFs For the Week –
1. Market Vectors Gold Miners (GDX) 10.15%
2. Asa Gold (ASA) 9.85%
3. US Oil Fund (USO) 4.20%
4. PowerShares Agriculture (DBA) 4.05%
5. PowerShares Commodities (DBC) 3.95%
– Worst 5 Performing ETF’s –
1. iShares Sweden (EWD) -10.20%
2. iShares Belgium (EWK) -9.90%
3. India Fund (IFN) -8.80%
4. iPath India (INP) -7.85%
5. PowerShares Clean Energy (PBW) -7.40%
::: Upcoming Economic Reports (6/30/2008- 7/4/2008) :::
Monday: Chicago PMI
Tuesday: Auto/Truck Sales, Construction Spending, ISM Index
Wednesday: Crude Inventories, ADP Employment, Factory Orders
Thursday: Initial Claims, Nonfarm Payrolls, Unemployment Rate, ISM Services
Friday: None – Holiday
::: Earnings I’m Watching This Week :::
None this week – earnings season won’t kick off in full force until mid July
